De-Leveraging The Eurodollar System In Favor Of Bitcoin
The eurodollar has been an instrument that allowed for massive global credit and leverage. Bitcoin will benefit from the de-leveraging of that failing system.
Kane McGukin has 13 years of wealth management experience spanning brokerage and institutional equity sales. He is an independent registered investment advisor.
As the calendar neared September 2021, the money printer had slowed and individuals were beginning to tire from the toils of trading a basket of work-from-home stocks. At this point, COVID-19 was over, the crash was old news and lockdowns were nearing two years old. Most were looking to shift their focus to something new. Something like getting back to what used to be their real day jobs.
You Can Only Keep An Animal Caged For So Long
That’s the tough reality of the corner the Federal Reserve has boxed itself into.
For decades, the Maestro had conducted a seemingly beautiful orchestra, but you can only keep people and financial instruments locked up for so long. Eventually, there’s a breaking point — a point where you can no longer massage the data or print enough money to satisfy human greed. Greed, that internal emotion that leads one to believe if they just get more money, they’ll find happiness.
At some point, animal spirits begin to stir. In times of economic stress, these spirits have a voice of their own. One that cannot be tamed or controlled by a board of 12 members, headed by a chair.
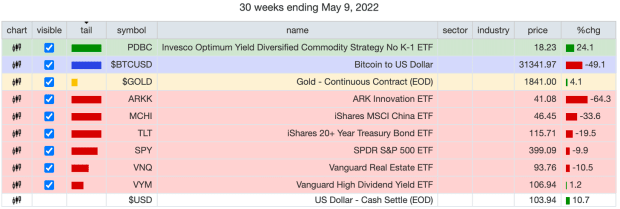
For many years, and more specifically in 2021 and 2022, I’ve watched the rotations of the major financial asset classes. Recently, to my surprise, only three asset classes have had positive returns over the last seven months. Those are commodities, gold and the dollar (though when accounting for [tru]inflation, 11.8% now with a peak of 12.74%, the dollar’s return is actually negative as of time of this writing).
Note: actual real estate has been up and quite bubbly in many places in the U.S., though the public market ETF shows negative returns. Likely because public markets are all down and it’s a publicly traded instrument.

Most assets have been punished since late 2021, as markets began to cool and rates started to reverse their 40-year downtrend.
When Money Is Free, Leverage Builds In The System
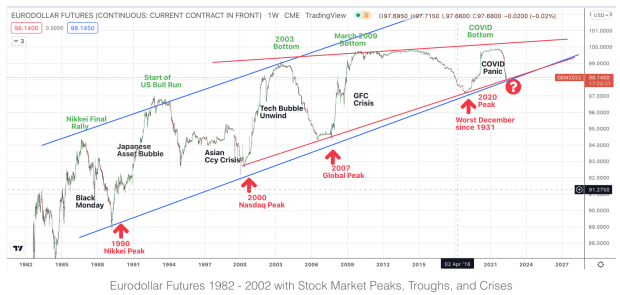
The eurodollar market is a bit obscure in that its size is relatively unknown (about $14T in 2016), and it was responsible for roughly 90% of international loans in 1997. So, one can assume that eurodollars are the center of most global financial activity when it comes to lending. This is abundantly clear when viewing the eurodollar futures chart below.
Background: The eurodollar market started in 1957 when non-U.S. banks began holding dollars on behalf of entities or nations potentially being blocked from holding actual dollars directly with U.S. banks. For doing so, these intermediary banks received higher interest on the dollars they lent out and also paid a higher level of interest to the rightful, but not actual, owner/holder of the dollars. Given the additional linkages, which lead to more layers of risk, it makes sense that higher interest rates are expected by investors.
These dollars, more or less, became a second derivative of the U.S. dollar.
When you break it down, is it not really just an international bank holding dollars and re-lending them outside of the purview of the legal jurisdiction of the Fed?
Effectively, these non-U.S. banks create money without having the same powers as the U.S. Fed. Remember, the global perception is that the Fed is the only one who can lend dollars. However, due to the global spread of fractional reserve banking and financial engineering, we can see that through eurodollars many other banking institutions have been playing “Fed” with their own re-lending of dollars throughout the global financial system.
Over the last 37 years, a clear channel was established for the eurodollar. As price approached the upper side of the channel (nearing par), bottoms formed in financial markets; and as price approached the bottom side of the channel, tops formed in various global markets.
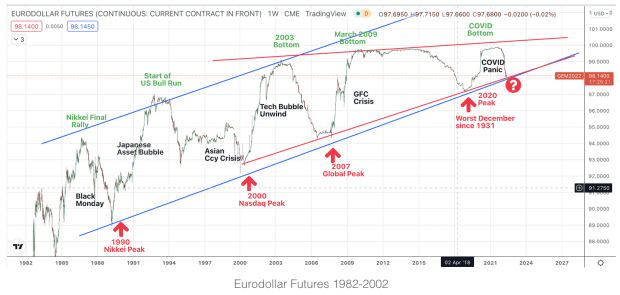
Note, the bottom side foreshadowed some of the worst financial crises in history as global leverage unwound and eurodollar prices began spiking higher during those runs toward $100.
As the chart shows, in the 1980s, the boom in credit was really beginning as globalization began heating up. At this point, with U.S. dollars firmly cemented as the global reserve currency, it was the eurodollar that was the actual growth driver. They were used to finance global growth, create leverage or in some cases circumvent sanctions by the U.S. Outside of crisis times, eurodollars generally rose while actual dollars fell. During the tough periods, lending and leverage would abate, while credit was unwound and disasters struck global financial markets (eurodollars falling, dollars rising).
Definitionally, “Eurodollar futures are interest-rate-based financial futures contracts specific to the Eurodollar, which is simply a U.S. dollar on deposit in commercial banks outside of the United States.”
The TL;DR
In more recent decades, as most assets have been financialized, very few actually hold the underlying asset, and most transactions or loans rely on reserves, credit or a spread of some kind, rather than the transfer of a physical underlying asset.
For example, with eurodollar futures as an expectation of future rates, if they fall from 99 to 98 the expectation is for rates to fall (relationship: the underlying — dollars — go up).
This is what the Bretton Woods system promoted: borrow cheap money (at low rates) to lever up and buy assets.
As rates begin rising, it eventually slows the incentive to buy assets that are rising over time. This encourages early derivative levers to unwind back to dollars, Treasuries, and/or gold (safety) as market risk increases. That is the flight to safety: back to a “risk free” asset. In turn, this selling of assets and moving back to safety, puts pressure on prices and crashes, with late buyers or weak hands losing money. After being flushed out, the process begins again with eurodollars at a lower price and room to reflate to the upside again. When I look at these charts, this is what becomes abundantly clear.
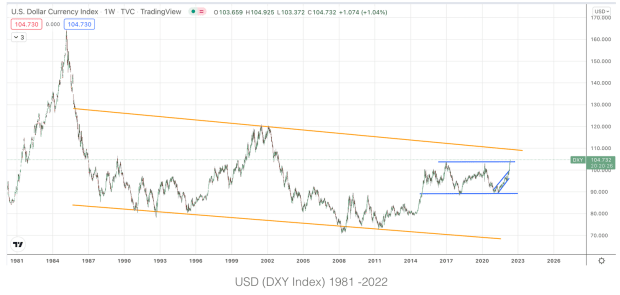
From the ‘80s to now, the dollar fell from $160s to a low of around $70, while eurodollars rose from around $85 to just under $100. One acted as the reserve, and the other as the tool of leverage and credit to drive global consumption.
According to Wikipedia,
“Several factors led eurodollars to overtake certificates of deposit (CDs) issued by U.S. banks as the primary private short-term money market instruments by the 1980s, including:
- The successive balance of payments deficits of the United States, causing a net outflow of dollars;
- Regulation Q, the U.S. Federal Reserve’s ceiling on interest payable on domestic deposits during the high inflation of the 1970s
- Eurodollar deposits were a cheaper source of funds because they were free of reserve requirements and deposit insurance assessments”
Taking A Closer Look
Zooming in, what’s most interesting is the wedge that has begun to form in recent years. Since the Great Financial Crisis, price has not reached the upper bound indicating a waning momentum.
Thinking this through, it makes sense on a couple of fronts.
First, globally, we are at peak credit and money sloshing around in the system. U.S. government stimulus in 2020 amounted to 40% of all dollars ever created. Think on that one for a minute.
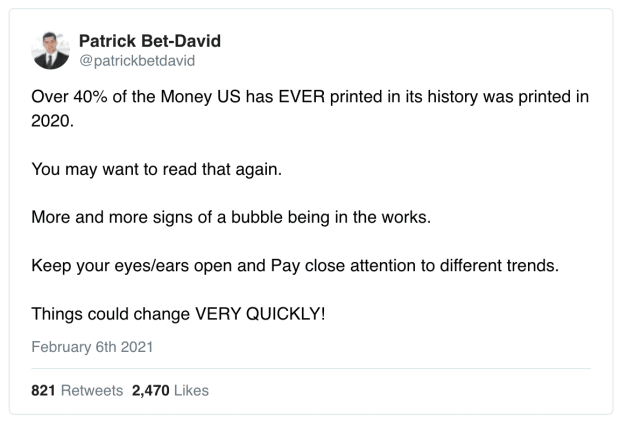
So, if the average person needs credit or leverage, it’s generally available one way or another.
Second, if you think about eurodollars as a derivative of the dollar, then it would make sense that you would not want to pay over par (100) to lever-up more than needed. Especially if the internal rate of return was not significantly higher than your borrowing rate. It just doesn’t make mathematical sense.
Last, eurodollar futures are also a gauge for interest rates in that they respond to 3-month Libor interest rates. Since 1981, interest rates have fallen from 16% to near 0% in 2021. As an inverse, the eurodollar rose. Were Treasuries acting as a savings mechanism while the derivative eurodollar was the credit mechanism? During this period, acting as the global reserve currency, the U.S. has largely been the benefactor here.
That’s why current macro and geopolitical skirmishes are so heated these days.
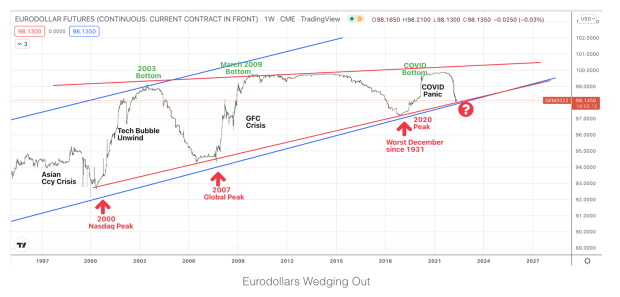
Looking back at the chart, this dynamic makes the wedge setup very interesting.
Wedges at peaks and troughs tend to indicate price corrections and trend changes in the opposite direction. In this case, eurodollars would likely fall to the mid- to low-90s. If that were to be, I can imagine it would mean a lot of players in global markets would be de-levering for one reason or another.
Additionally, it would indicate that interest rates would have a lot more room to upside. Inflation anyone?
Again, as a second or third derivative, why would you want to pay over 100 to bid it up even more? Room to the upside is needed unless the entire world goes on a zero interest-rate policy.
That would mean interest rates would have to go negative and stay negative, which doesn’t exactly work. A few European countries tried this, only to stop sometime after as they had no idea as to what else might break in the system. Nor did they understand the unintended consequences because it’s never been done before (except in Japan).
The setup seems to suggest we may see a reflation of stocks, but likely not for too long as there are only two points to the upside before reaching eurodollar par (100). Is the next eurodollar rollover the all-asset bubble? Is it a quality indicator? Or, does the U.S. pull out the Japanese playbook and take rates negative to stave off the inevitable?
Granted, we’ve mocked and criticized Japan for the better part of 30 years, so there would be an about-face if the U.S. were to reverse course in economic policies. By the same token, it’s hard to say what the current administration is capable or incapable of doing these days. Sorry, the proof’s in the data.
My thought after this review is that the eurodollar has been an instrument that allowed for massive global credit and leverage for over three decades. But, there’s no longer any room to run because we’re essentially at 100. In order for the Fed and other central banks to kick the can down the road once more, they’ll need another tool.
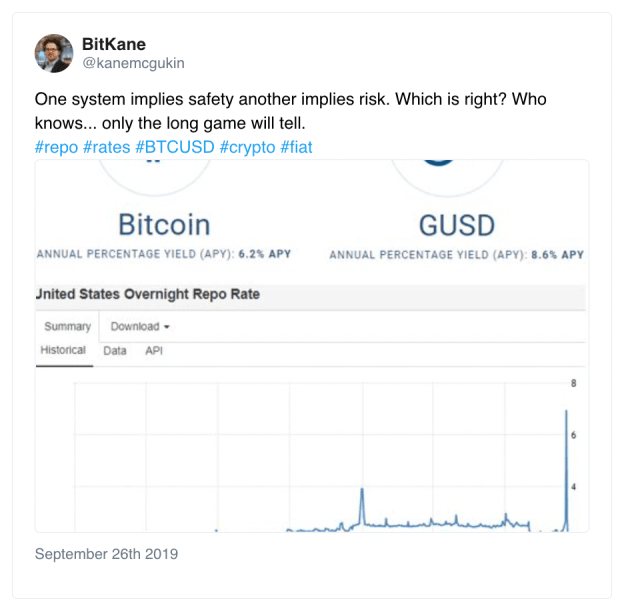
The Role of Stablecoins? Eurodollars 2.0?
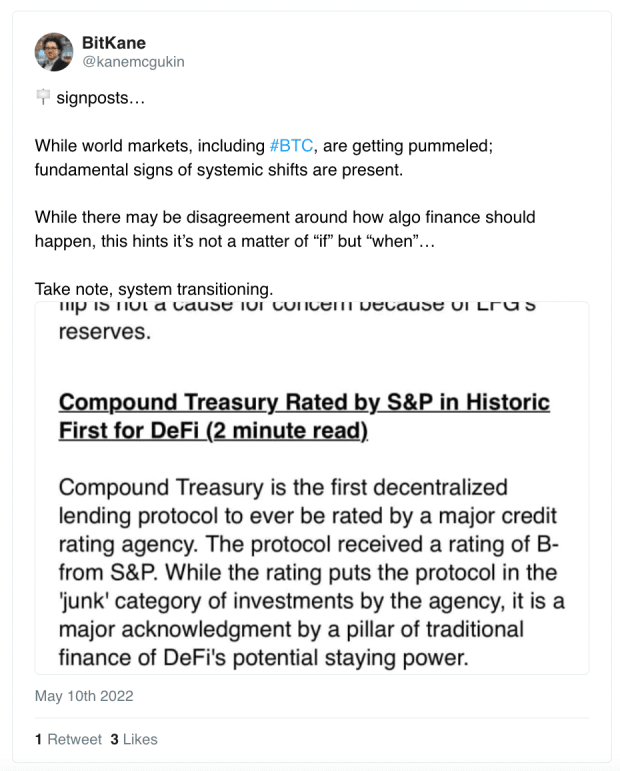
First things first. If cryptocurrency was pointless, then the S&P has no business looking at Compound, a Decentralized Finance (DeFi) interest rate protocol. Much less, giving it a rating! That’s a fundamental sign, in my opinion, that cryptocurrency is here to stay, and the financial rails are definitely in transition.
With the Fed and other global central banks out of ammunition, and individuals and institutions uninterested in living without credit (being largely productive). There are only two options:
- Take a massive haircut: Let the eurodollar fall and de-lever while the global financial system unwinds in a nasty way.
- Introduce another tool in a parallel financial system that allows for leverage and lending to carry on, but more importantly, allows governments to kick the can down the road once again. That’s the path chosen for the last 20 years. That’s a role stablecoins and central bank digital currencies (CBDCs) could fill, the latter of which would be full Modern Monetary Theory, in my opinion. Also adding a much deeper Big-Brother insight into how and where people spend their money. (Remember how well this worked out with Facebook…) Plus, providing the capability to add or pull funds at any point that agencies want, and for any reason.
Assuming a new unit is added to the foray of leverage (dollars, Treasuries, eurodollars, stablecoins/CBDCs), this potentially allows — at minimum — disbursement of the leverage that has happened on a singular sound asset, gold. For a quick primer on this past history, read Nik Bhatia’s “Layered Money.” It’s easy and a must-read.
In addition, we’re currently watching a new parallel financial system being built. That’s the Bitcoin network and it provides an additional and much-needed sound money asset.
Bitcoin along with other digital asset integrations provides on- and off-ramps between stablecoins, digital assets and traditional dollar assets/financial markets. In the coming decades, money will be able to flow from our old global dollar financial network to a new financial network built on Bitcoin, because after all, data is the new oil. And money is the greatest form of communication that we have.
These supporting casts will be important as the system continues its transition, much like it did in the 1930s from a gold-based system to the Bretton Woods system of pegged currencies. Eventually, a meeting will be held and the new Bretton Woods agreement will be announced, paving the way for the Bitcoin economy to provide ample support to the failing, old and rusty financial rails of the past.
The next few decades of finance are going to be fun, but not without a few bumps and bruises as we’ve seen recently with the demise of the algorithmic stablecoin Terra Luna.
Opinions expressed in this article are not to be considered investment advice. Past performance is not indicative of future performance as all investments carry risk including potential loss of principle.
This is a guest post by Kane McGukin. Opinions expressed are entirely their own and do not necessarily reflect those of BTC Inc. or Bitcoin Magazine.


