Dangerous Pattern Emerging for ETH, Price Could Crash to $1.4K (Ethereum Price Analysis)
Ethereum’s price has taken a notably bearish turn, breaching several critical support levels and tilting on the verge of a concerning death cross.
Despite these developments, there is a glimmer of hope as the price approaches a substantial support zone, hinting at the possibility of a temporary consolidation phase.
Technical Analysis
By Shayan
The Daily Chart
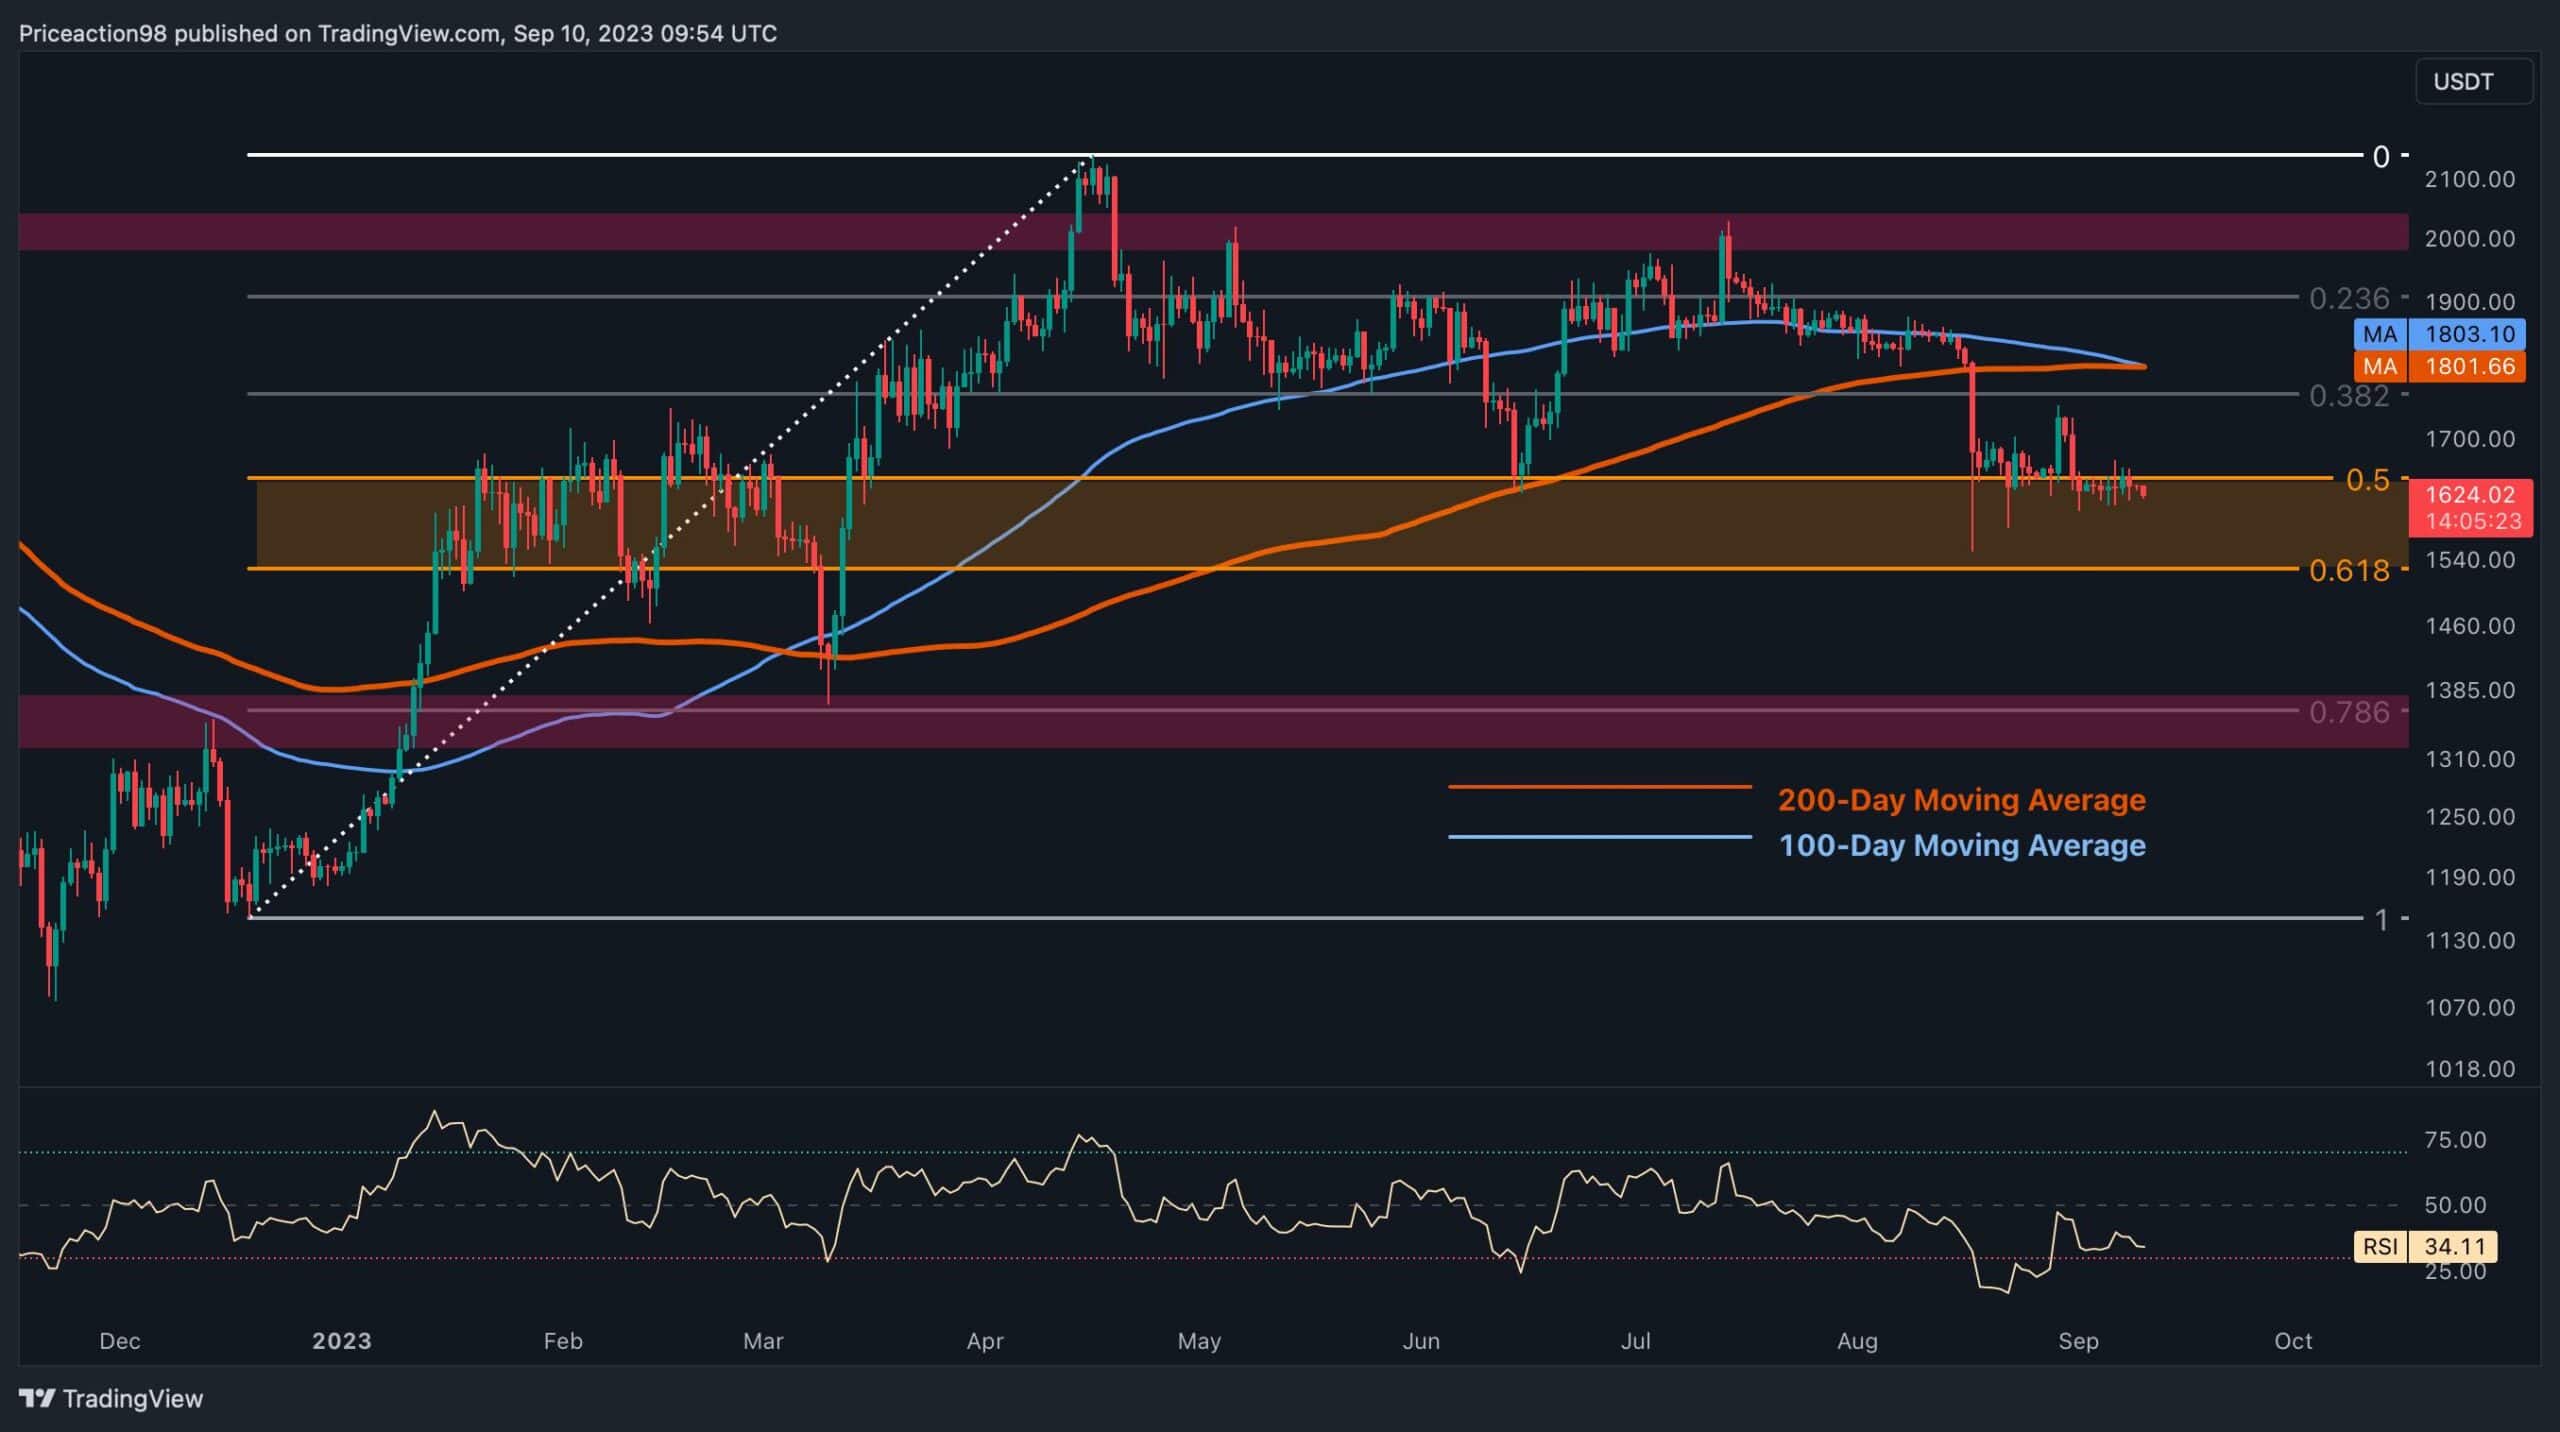
Ethereum’s price has recently experienced a significant downtrend, leading to a breach of multiple support levels, including the crucial 100 and 200-day moving averages. This rejection has also pushed the price below its previous major swing low at $1,625, marking a daily lower low. This shift strongly suggests transitioning from an uptrend to a potential downward trajectory.
Additionally, the 100-day moving average is on the verge of crossing below the 200-day moving average, forming a death cross pattern. If this breakout occurs, the market could anticipate a notable descent towards the $1.4K support region.
However, amidst the bearish signals, the price has reached a critical support region characterized by the 61.8% Fibonacci retracement level. This range is often seen as the last line of support for Ethereum bulls. Should the price slip below this threshold, the likelihood of a sharp decline would increase.
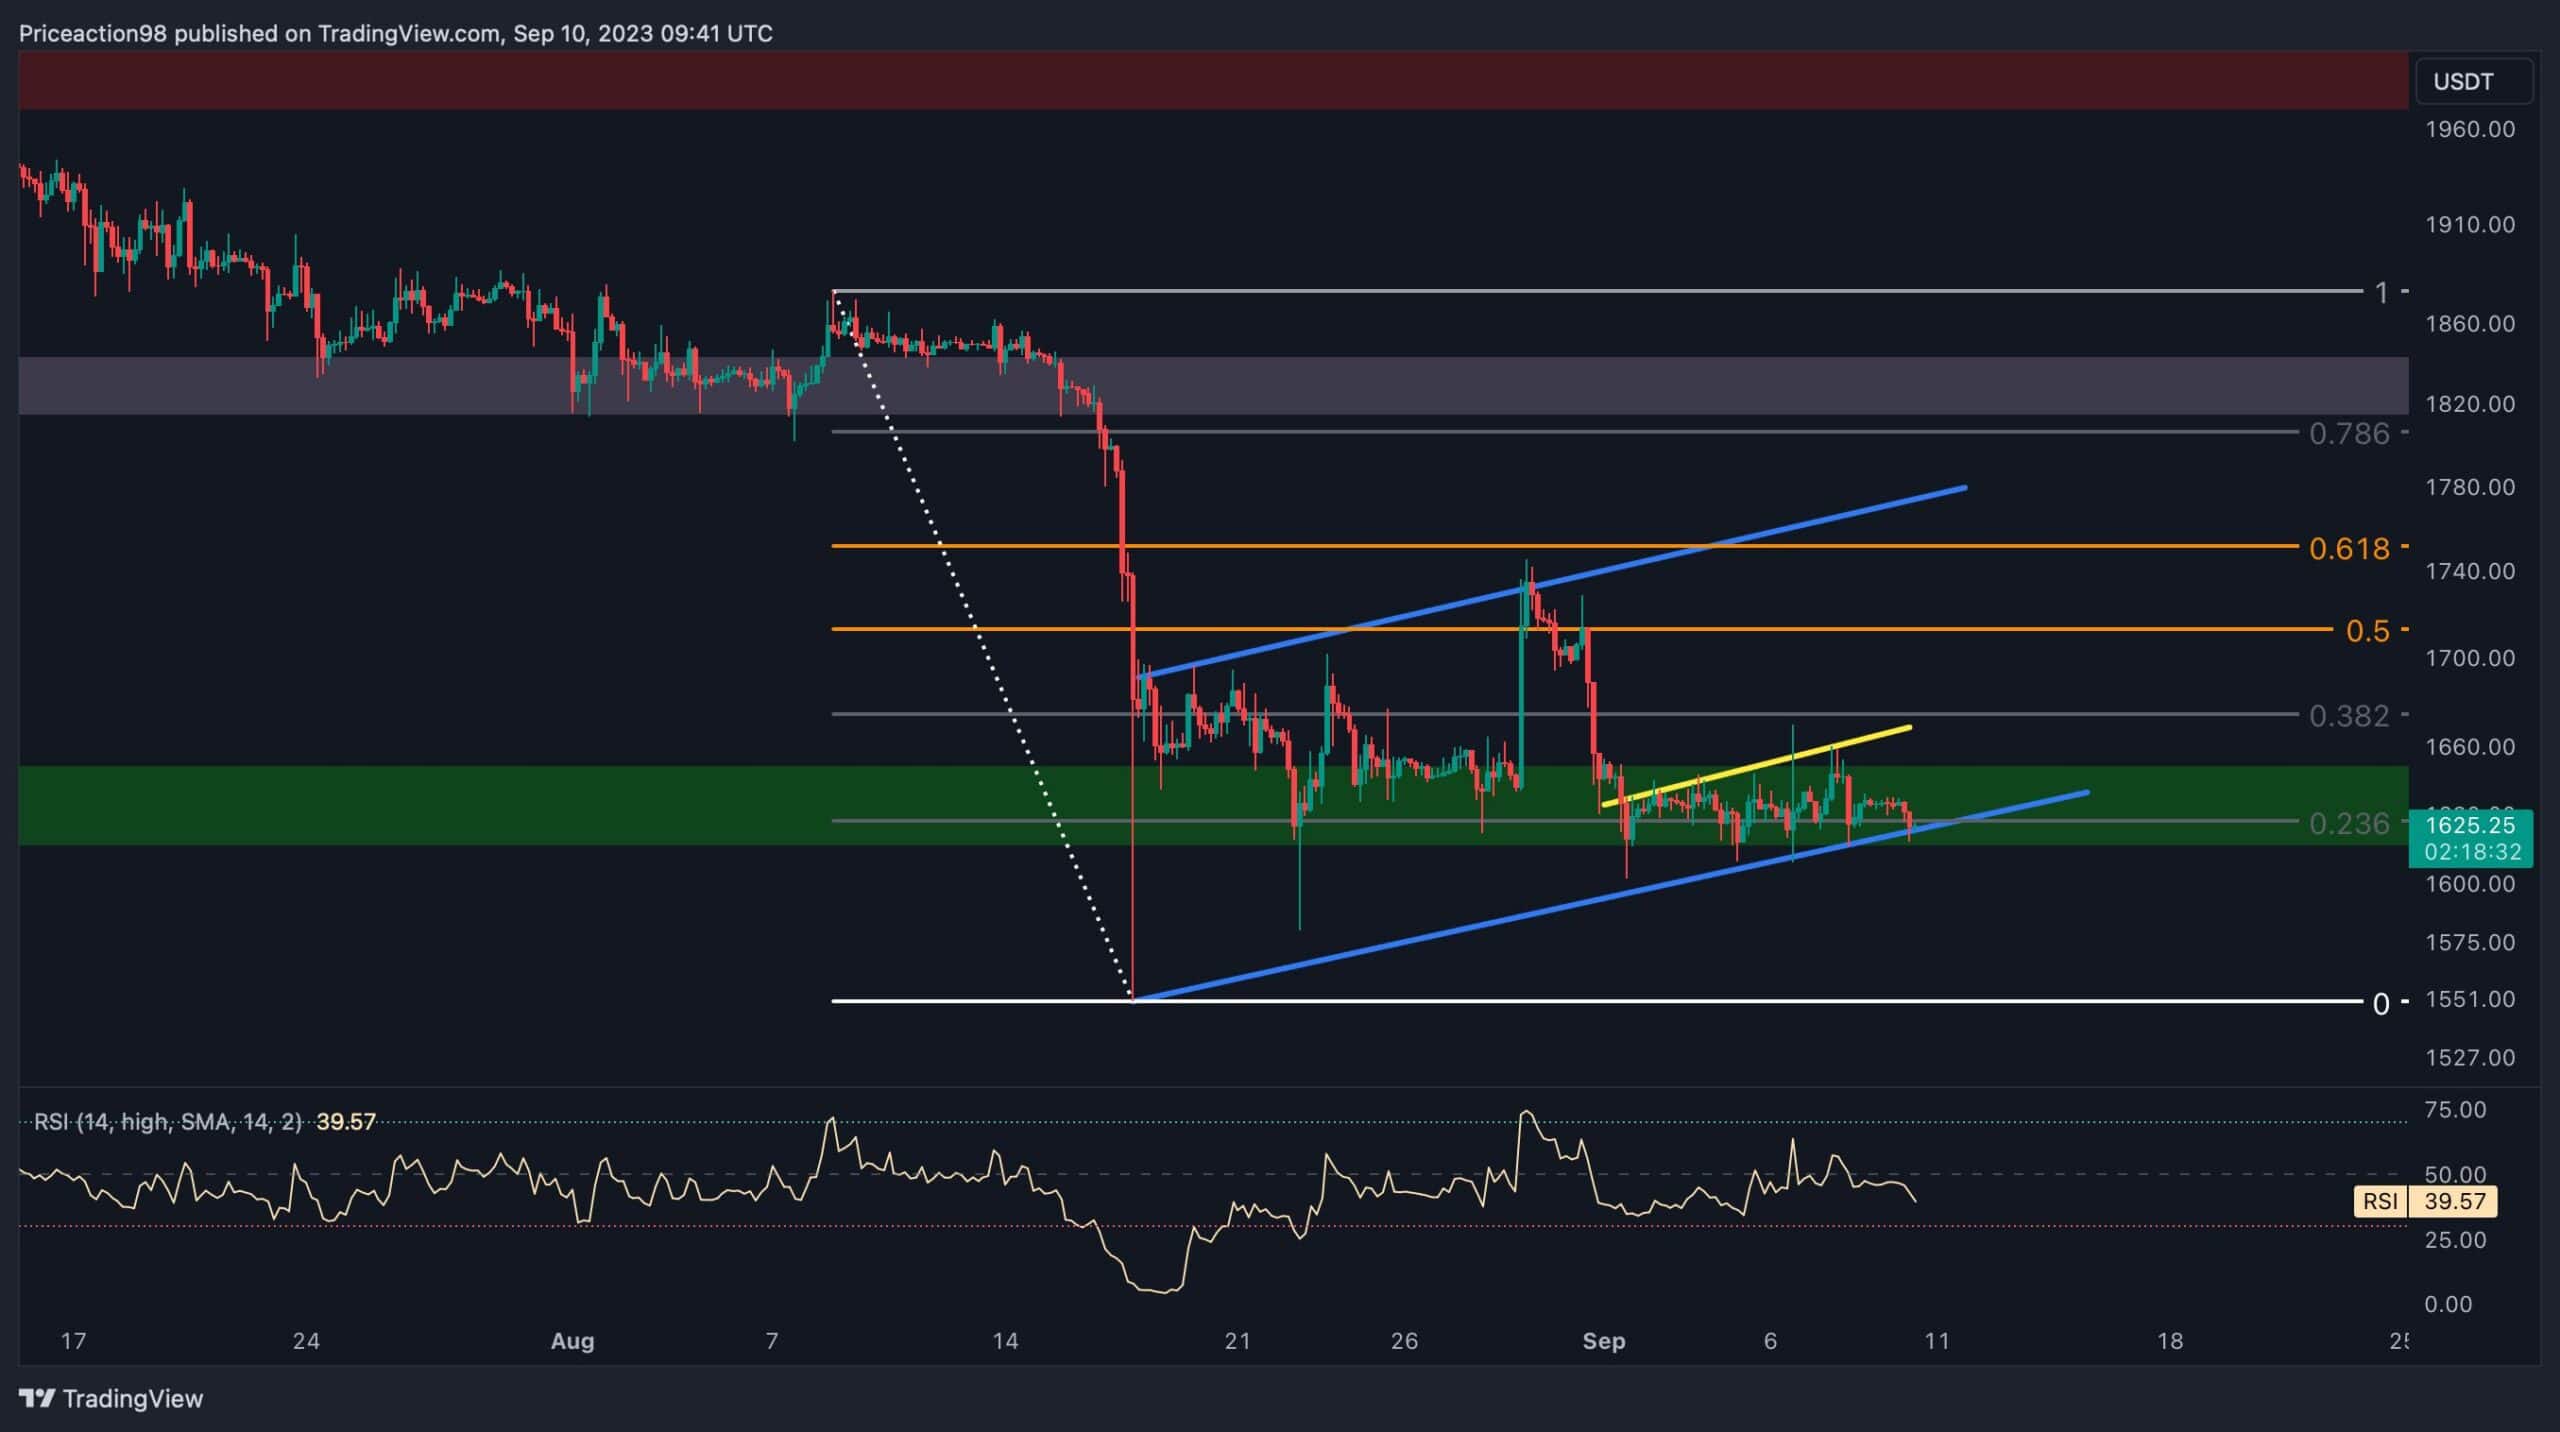
The 4-Hour Chart
Examining the 4-hour timeframe, a temporary pause in the aggressive downtrend can be observed when Ethereum found support around the significant $1.6K region.
Subsequently, the price experienced a bounce-back but encountered strong resistance at the 61.8% Fibonacci level. This led to a consolidation phase, during which the price formed an ascending flag pattern—a recognized bearish continuation pattern.
However, another impulsive retracement drove the price back toward the $1.6K range, bringing it close to the lower boundary of the flag pattern. As the $1.6K threshold aligns with the flag’s lower trendline, it carries considerable psychological significance. Consequently, if sellers push the price below this critical level, the market could witness another swift and steep decline toward lower price levels.
On-chain Analysis
By Shayan
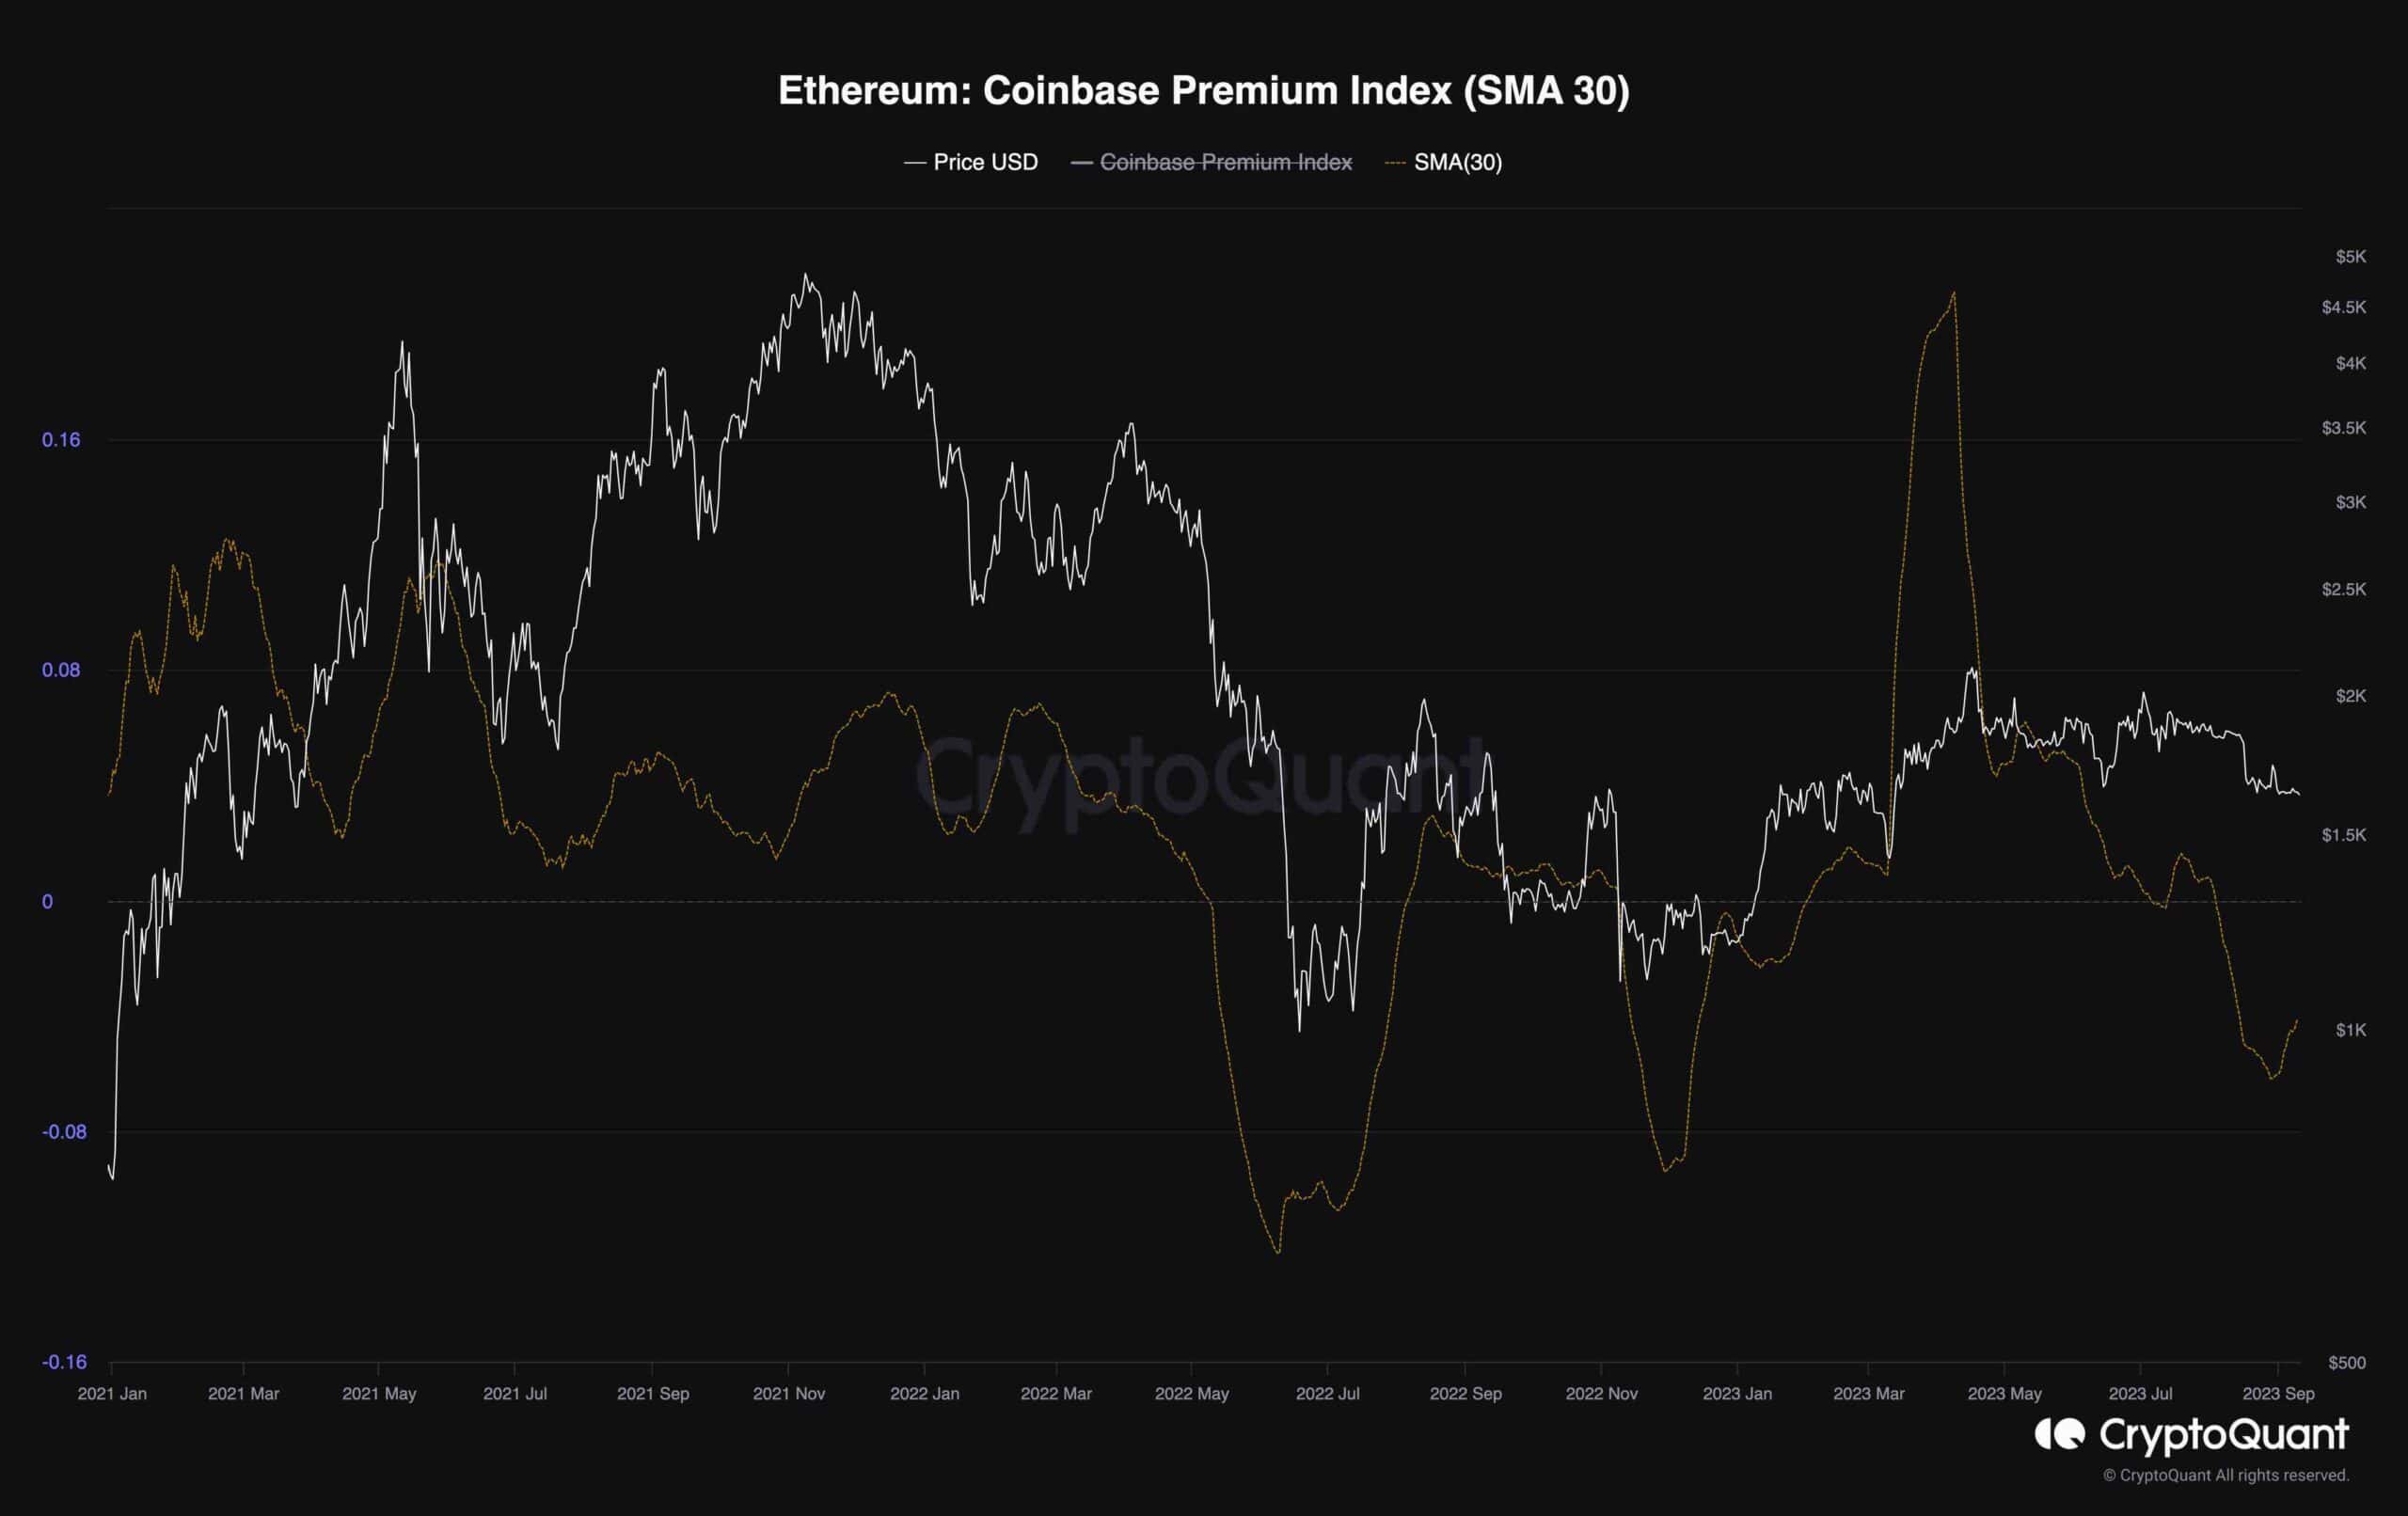
The chart visually represents the Ethereum Coinbase Premium Index, a 30-day moving average added, and the price. This metric measures the price difference between Ethereum on Coinbase and its counterpart on Binance, two prominent global cryptocurrency exchanges. What makes this metric particularly relevant is its ability to serve as a barometer for gauging whether U.S. investors collectively lean towards buying or selling Ethereum compared to their global counterparts.
What emerges as a compelling observation is the intriguing correlation between the price action of Ethereum and the Coinbase premium metric. The chart shows that this metric’s corresponding spike or plunge has mirrored every significant price surge or dip in Ethereum’s value.
However, the more noteworthy development recently has been the noticeable shift in sentiment within the U.S. cryptocurrency market. This shift is made evident by the pronounced downward trajectory of the premium index, reaching a yearly low. This shift in sentiment is significant because many U.S. investors involved are either high-net-worth individuals or institutional entities whose actions can wield substantial influence in the cryptocurrency landscape. Hence, the market seems to be in total fear and uncertainty until a robust price surge and heightened buying pressure occur.
The post Dangerous Pattern Emerging for ETH, Price Could Crash to $1.4K (Ethereum Price Analysis) appeared first on CryptoPotato.