Cryptocurrency Usage On Darknet Markets Reached ATH Revenue Of $1.5B in 2020
Although the total revenue on darknet markets using cryptocurrencies in 2020 has surpassed the 2019 results, the number of active participants and markets has decreased this year. The blockchain forensics company Chainalysis reported the developments and attributed it mostly to the COVID-19 pandemic.
2020 vs. 2019 Darknet Market Crypto Usage
In its annual report on darknet markets activity, Chainalysis compared the developments in 2019 and 2020 while acknowledging the significant role of the COVID-19 pandemic.
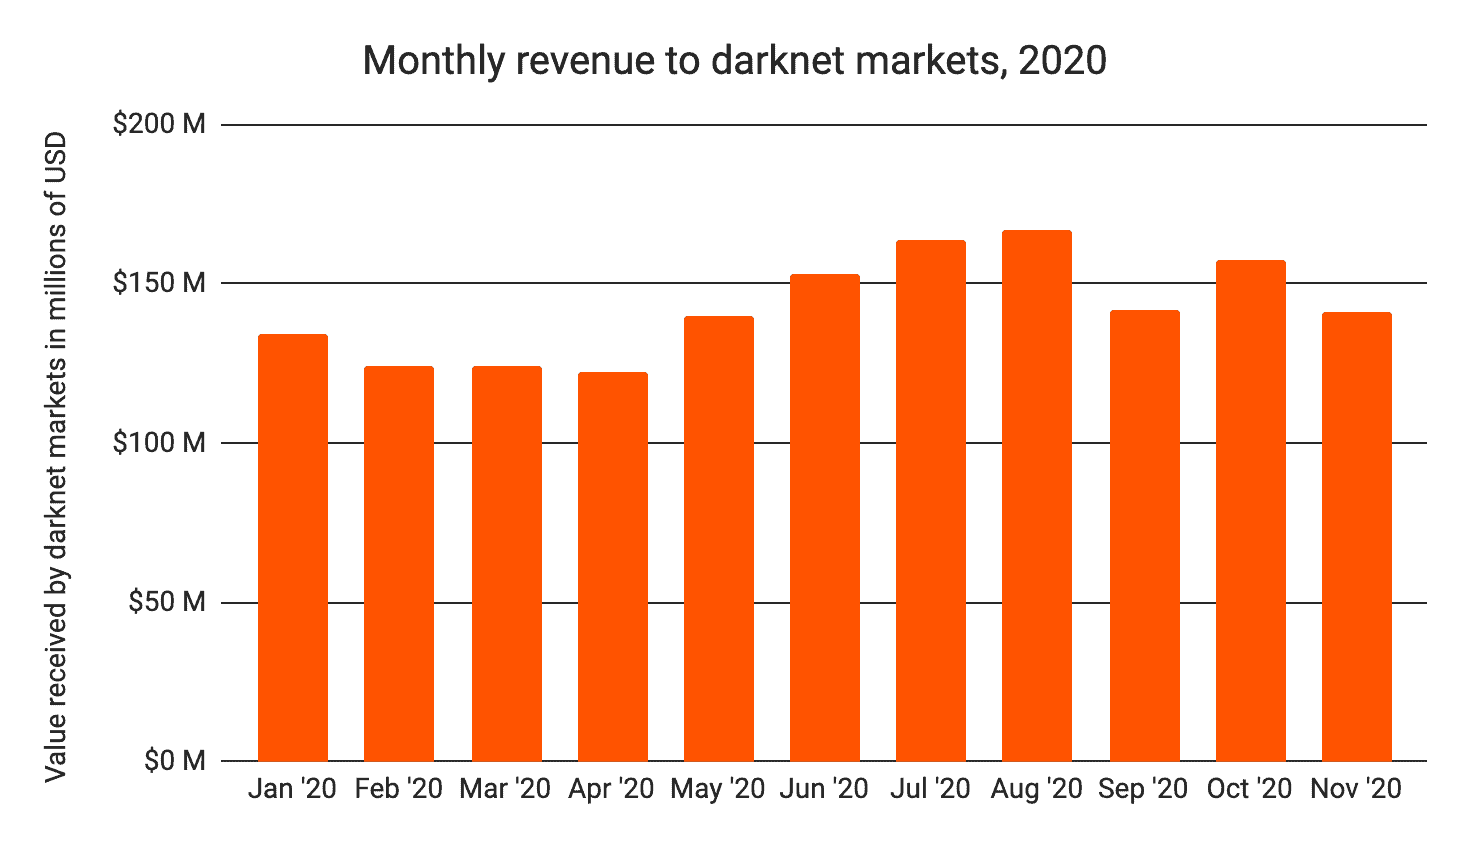
The paper informed that the total darknet market revenue in 2020 is already greater than the 2019 numbers, despite the sudden drop in March and April. At the time, the darknet activity, previously impervious to BTC price movements, decreased as most cryptocurrencies lost up to 70% of value during the liquidity crisis.
However, this change proved to be only temporary. The revenue started to accelerate rapidly from May and broke the short-term correlation with the prices.
“Since then, darknet markets’ monthly revenue has steadily grown, save for small drops in September and November, which largely fall in line with seasonal trends.”

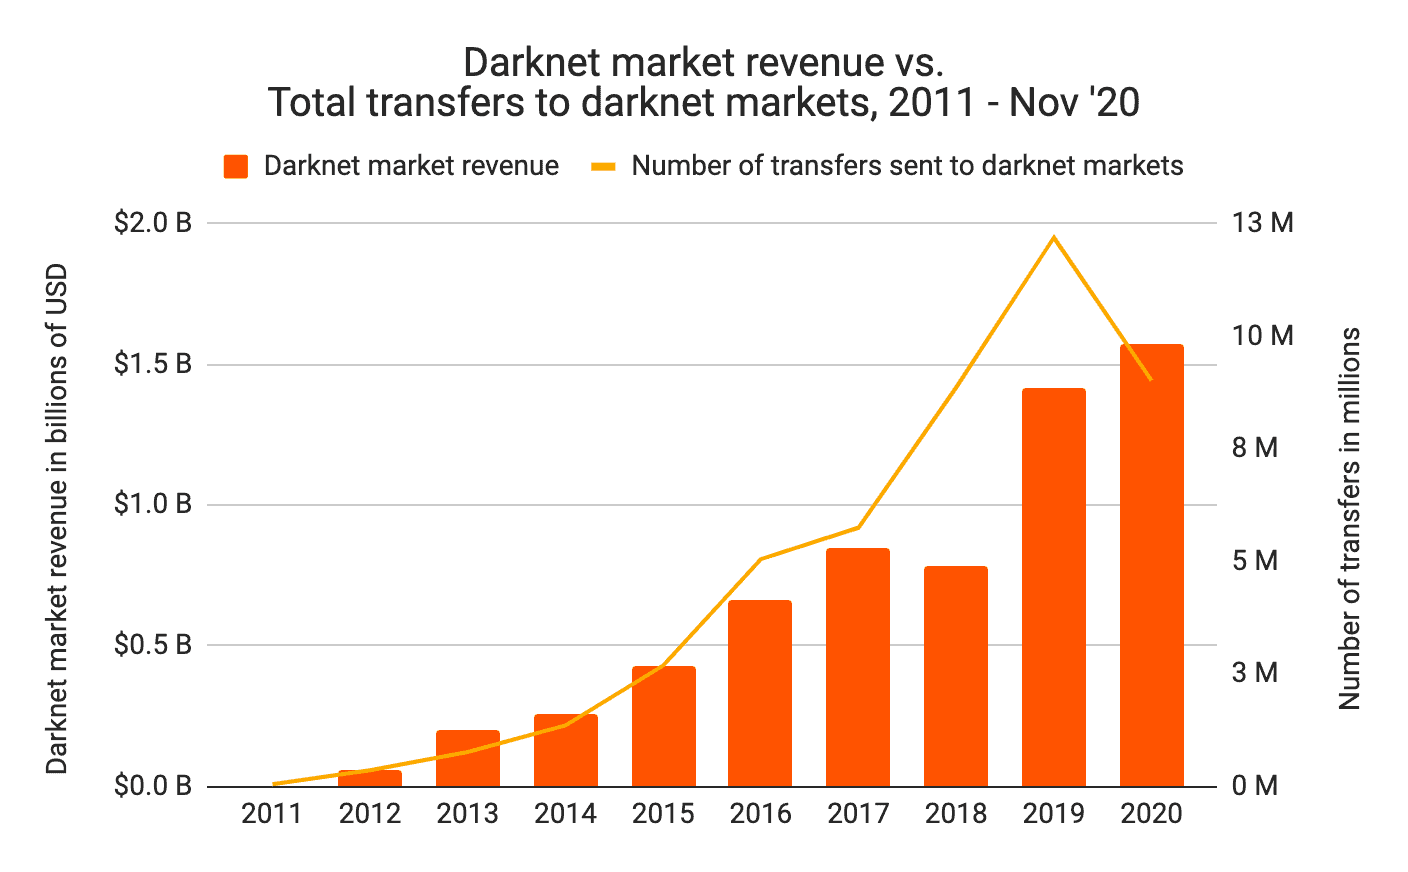
Ultimately, the total revenue this year has surged to an all-time high of over $1.5 billion, even though the data doesn’t include December 2020. It’s worth noting that Chanalysis has explored transfers completed with Bitcoin, Bitcoin Cash, Litecoin, and Tether.

Decreasing Transfers And Darknet Venues
As the graph above illustrates, the total revenue has increased, but the number of transfers to darknet markets, which the report has used to roughly approximate the number of individual customers and purchases, has declined.
The number of such transfers in 2020 has dropped to 9 million, while in 2019, it was well above 12 million. This means that while customers have made fewer purchases this year, they have been for larger amounts.
“This could indicate that casual buyers or those buying drugs for personal use are shifting away from darknet markets, while those buying in larger amounts – either for personal use or to sell to others – are purchasing more. It could also mean that some casual buyers have begun placing larger orders to stock up amidst uncertainty.”
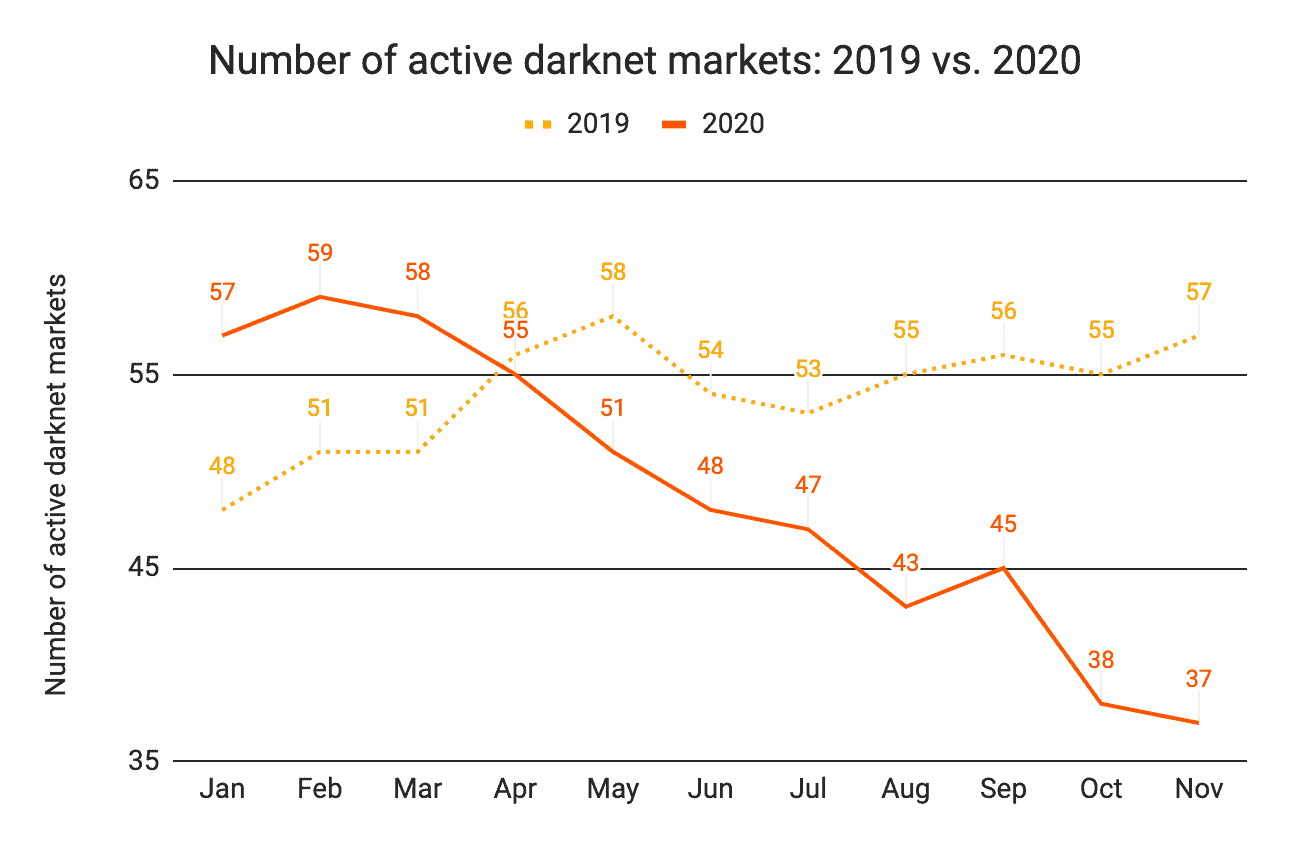
Chainalysis, which recently closed $100 million in a funding round, indicated that the number of active darknet markets has dropped to 37 – the lower total since November 2017. The decline in such venues follows a period of sustained growth from 2018 to February 2020. Nevertheless, the company acknowledged that some markets claim their closures are only temporary.


