Crypto Price Analysis & Overview May 7th: Bitcoin, Ethereum, Ripple, Cardano, and Litecoin
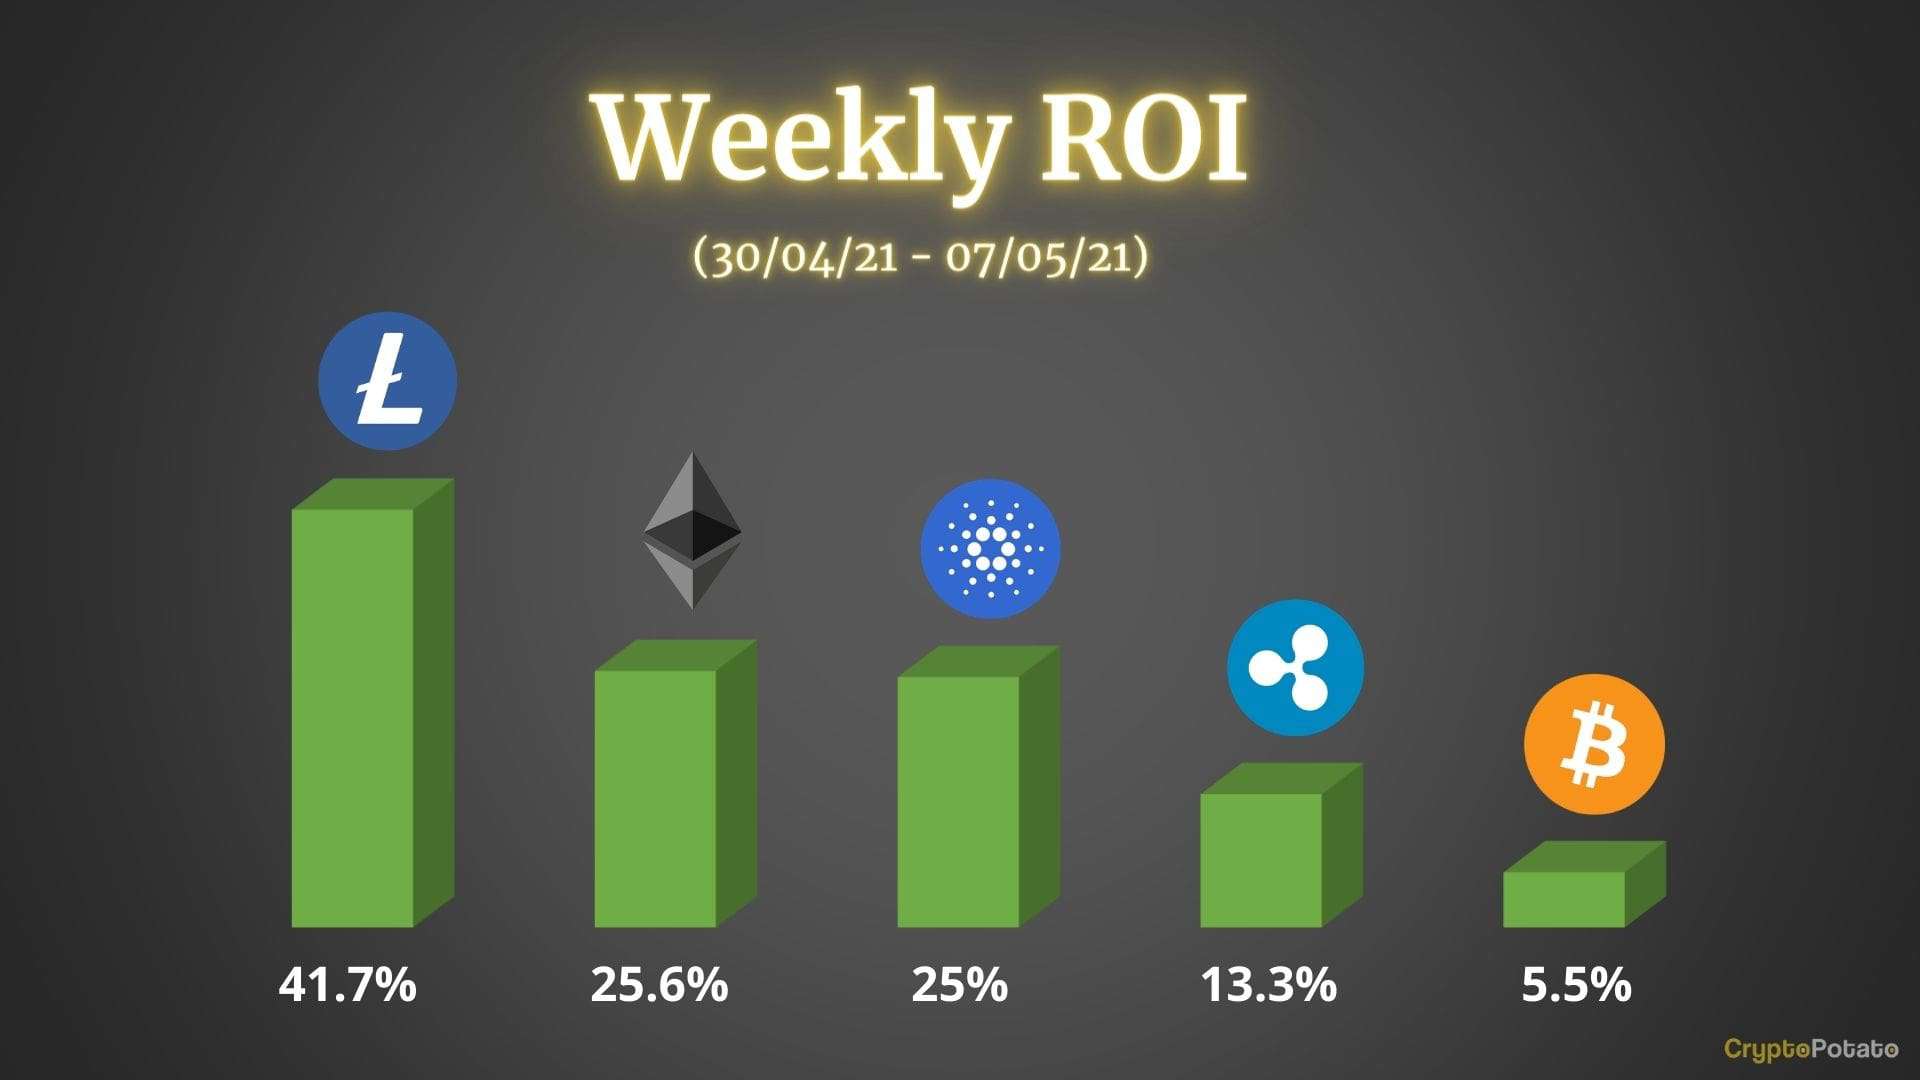
Altcoins continue to outperform bitcoin’s price and this week was no exception. One of the biggest winners over the past seven days was Litecoin, up more than 40%. Here’s how some other top coins performed and what to look forward to.
Bitcoin
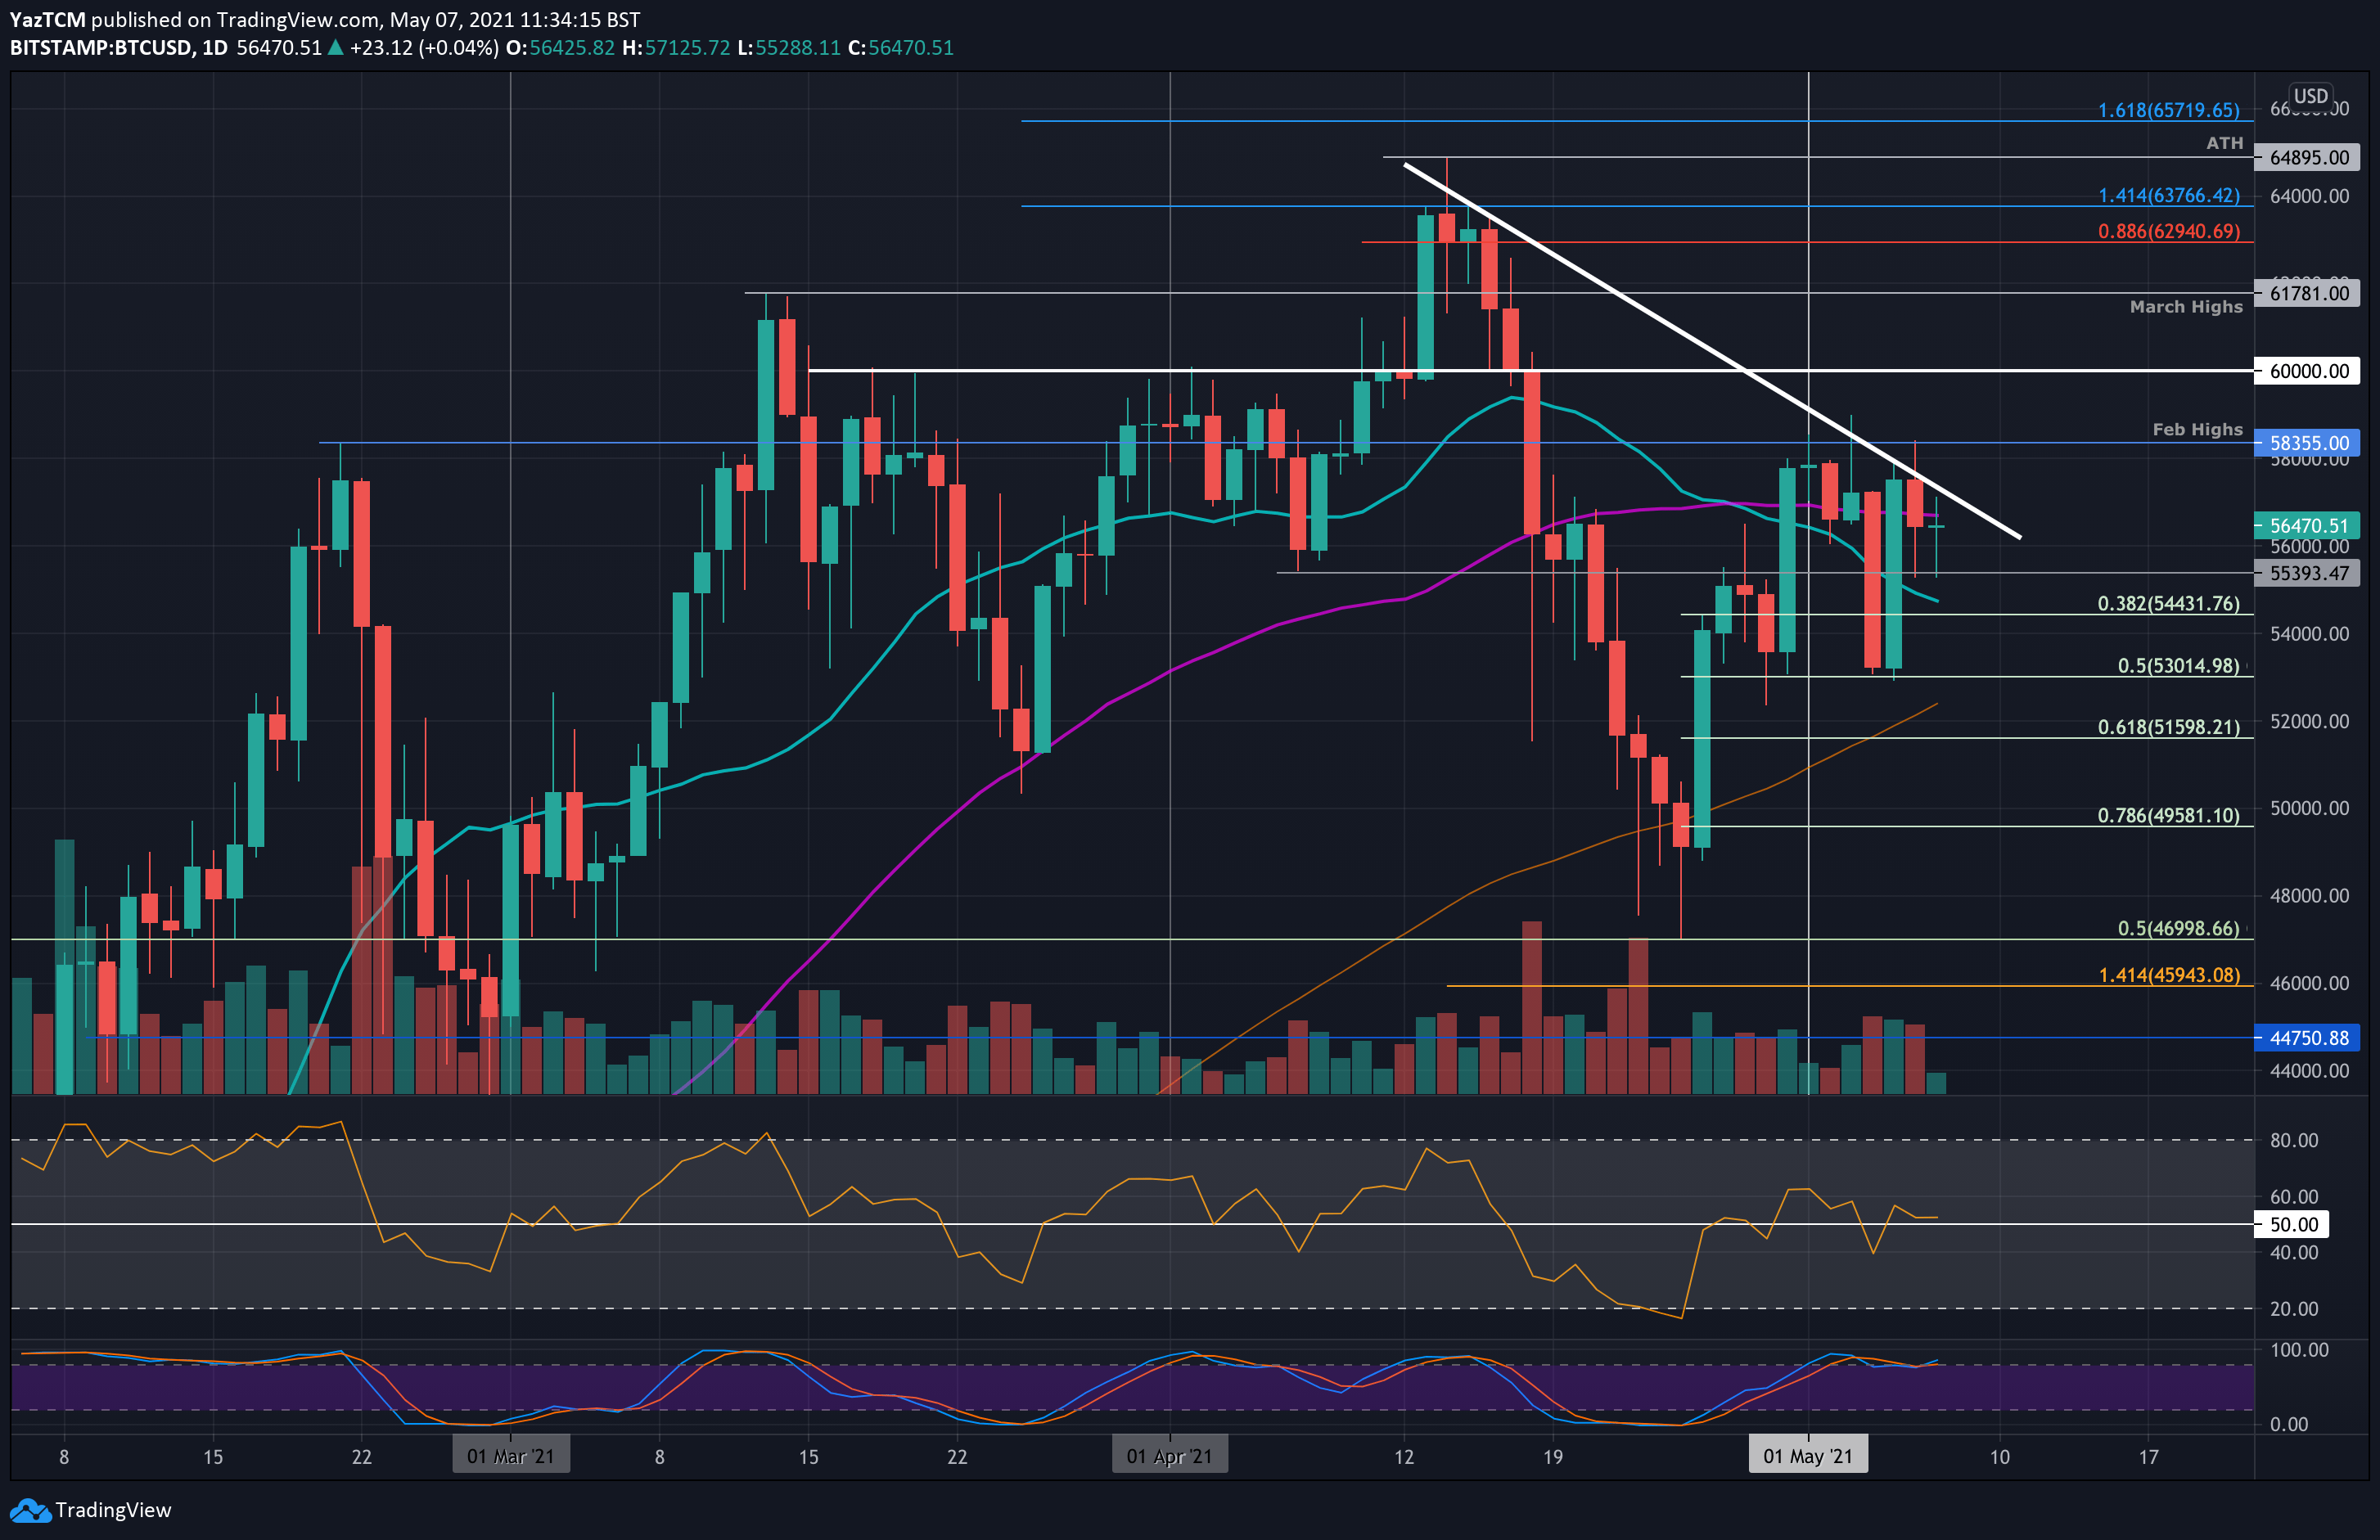
Bitcoin is up by a total of 5.5% this week as it battles with $56,500 in an attempt to climb over the 50-days MA. It has struggled to surge above $58,000 so far in May as it fails to break above a short-term descending trend line.
On Tuesday, bitcoin saw a sharp 8% price fall as it dropped beneath the 50-days MA to reach as low as $53,000. There, it found support at a .5% Fib and rebounded on Wednesday to break back above the 50-days MA. However, it still is struggling with the descending trend line and has since dropped beneath that critical resistance.
Looking ahead, the first support lies at $55,400. This is followed by $54,450 (20-days MA), $53,000 (.5 Fib), $52,400 (100-days MA), and $51,600 (.618 Fib).
On the other side, the first resistance lies at $55,500 (50-days MA). This is followed by the descending trend line, $58,355 (Feb 2021 highs), $60,000, and $61,780 (March 2021 highs).
Ethereum
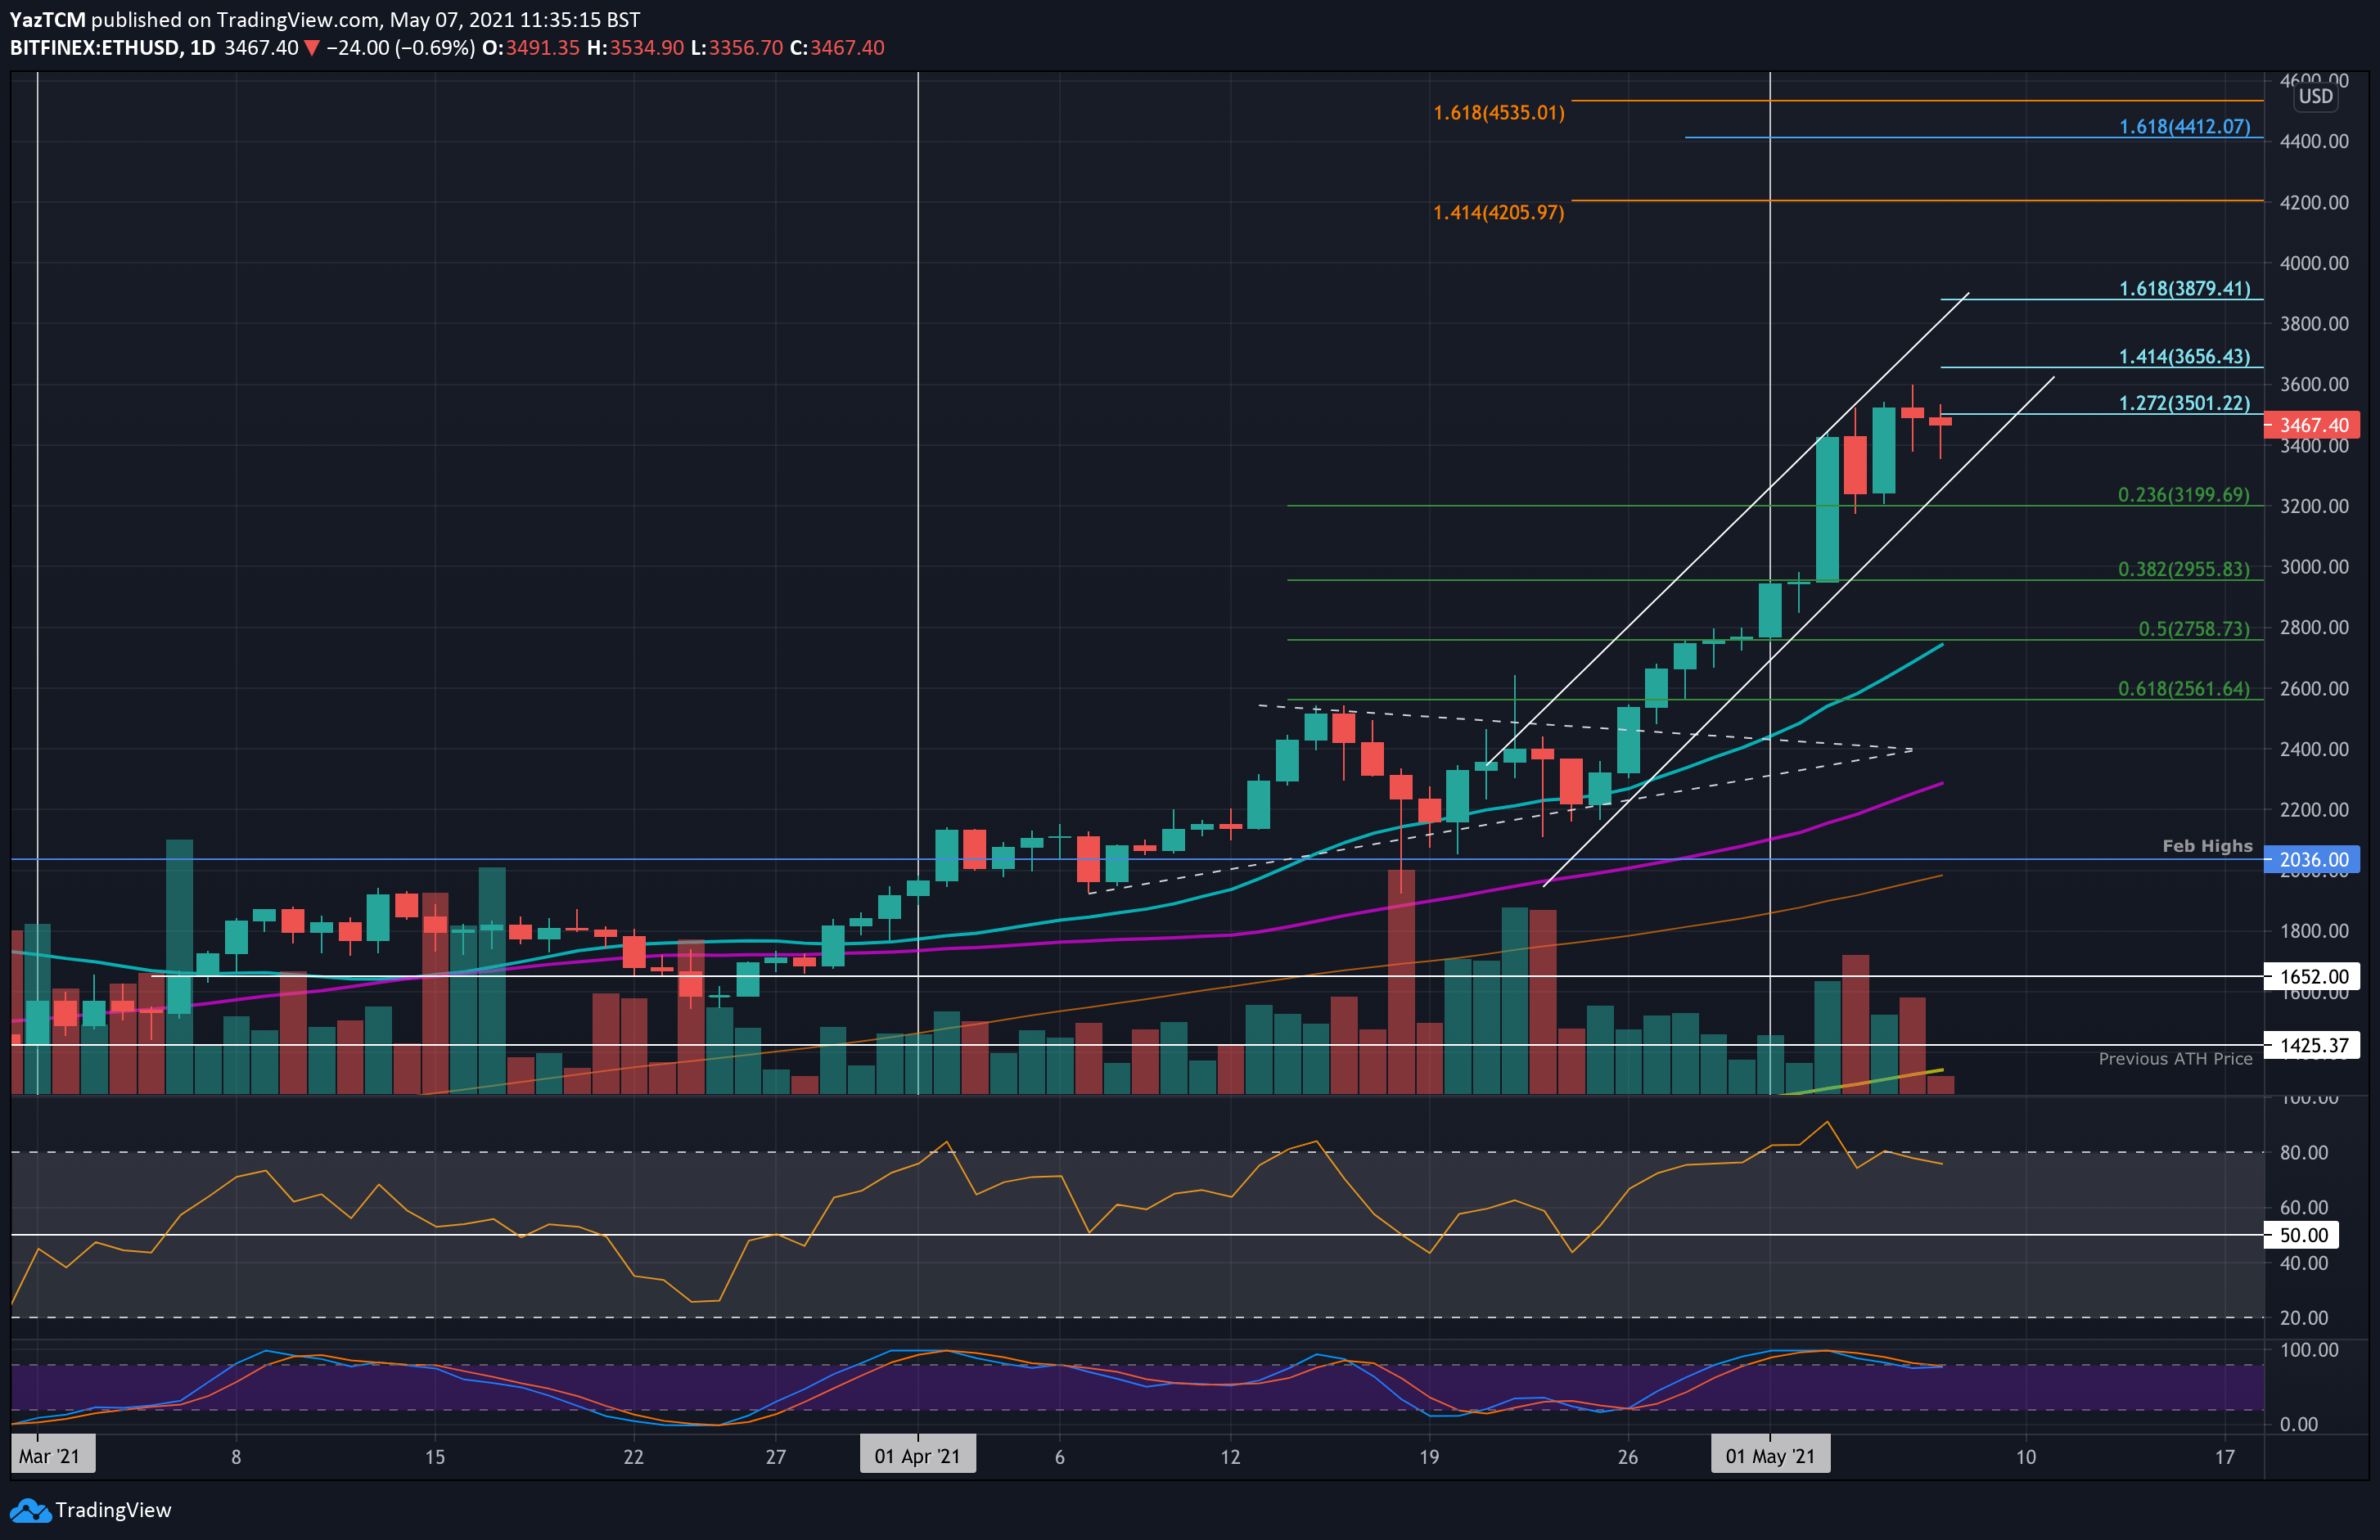
Ethereum witnessed a very strong 25.6% price hike this week as it surged to new ATH prices of $3600. The coin has been trading inside a steeply ascending price channel since breaking out of a symmetrical triangle toward the end of April. Since then, it has consistently been making higher highs.
At the start of the week, ETH was trading around $2750. It continued higher throughout the week until setting the ATH price yesterday at $3600. Since then, it has dropped slightly to trade around $3450.
Moving forward, the first level of strong resistance lies at the ATH price at $3600. This is closely followed by $3656 (1.414 Fib Extension), $3800, $3880 (1.618 Fib Extension), and $4000. Added resistance lies at $4200 and $4412.
On the other side, the first support lies at the lower boundary of the ascending price channel. Beneath this, support lies at $31200 (.236 Fib), $2955 (.382 Fib), and $2760 (.5 Fib & 20-days MA).
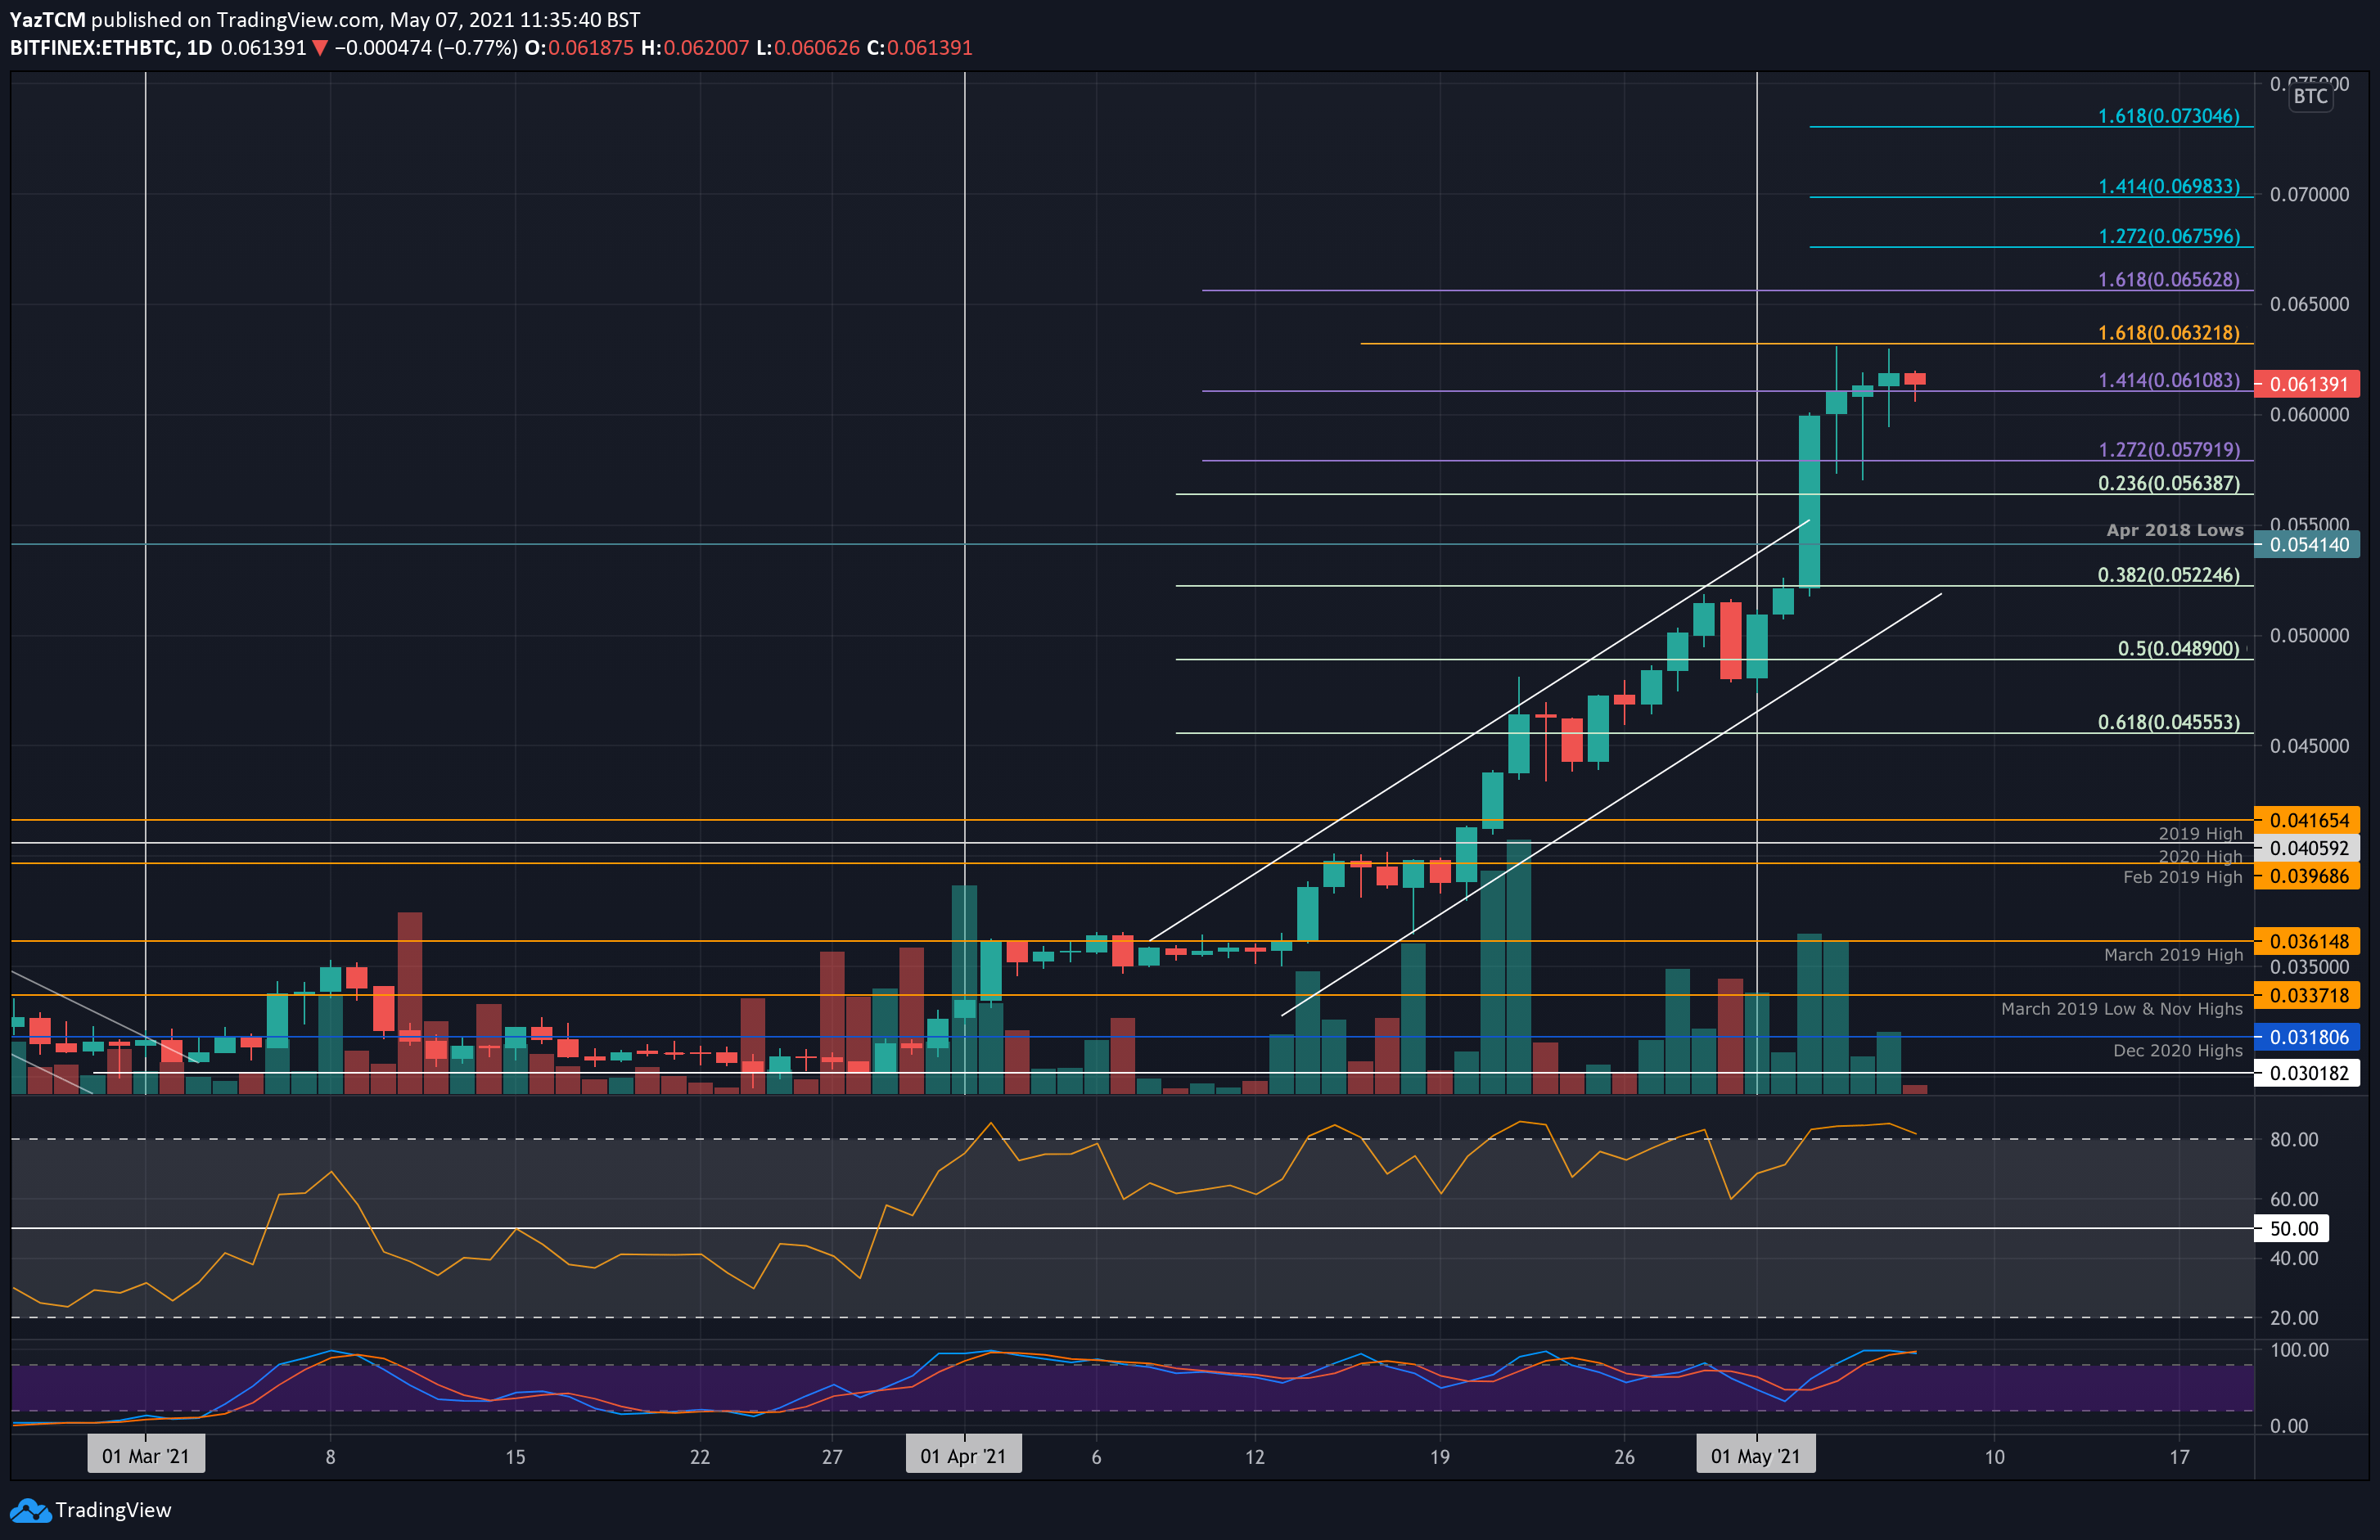
ETH is performing very well against BTC this week as it managed to break the April 2018 lows at 0.054 BTC and reach as high as 0.0632 BTC (1.618 Fib Extension).
It started the month beneath 0.05 BTC but quickly managed to break above the resistance. On Monday, ETH surged above the April 2018 lows and continued to hit the 2021 high at 0.0632 BTC on Tuesday. Since then, it has traded sideways between this high and the support at 0.06 BTC.
Looking ahead, the first support lies at 0.06 BTC. This is followed by 0.0563 BTC (.236 Fib), 0.0541 BTC (April 2018 lows), and 0.0522 BTC (.382 Fib).
On the other side, the first resistance lies at 0.0632 BTC (1.618 Fib Extension – orange). This is followed by 0.0656 BTC (1.618 Fib Extension – purple), 0.0675 BTC (1.272 Fib Extension – blue), and 0.07 BTC (1.414 Fib Extension – blue).
Ripple
XRP also saw a respectable 13.3% price hike this week as the coin currently sits at $1.60. It started the month trading around $1.70 but ended up heading lower from there to hit the support at $1.40 (20-days MA) on Tuesday.
It quickly bounced from there and spiked as high as $1.80 yesterday. However, it looks as if XRP is struggling to produce a daily closing candle beyond $1.60.
Moving forward, if the bulls can crack $1.60, the first resistance lies at $1.74 (bearish .786 Fib). This is followed by $1.98 (April highs), $2.10 (1.618 Fib Extension), and $2.20.
On the other side, the first strong support lies at $1.50 (.236 Fib). This is followed by $1.40 (20-days MA), $1.25 (Feb 2018 Highs), and $1.10 (.5 Fib & 50-days MA).

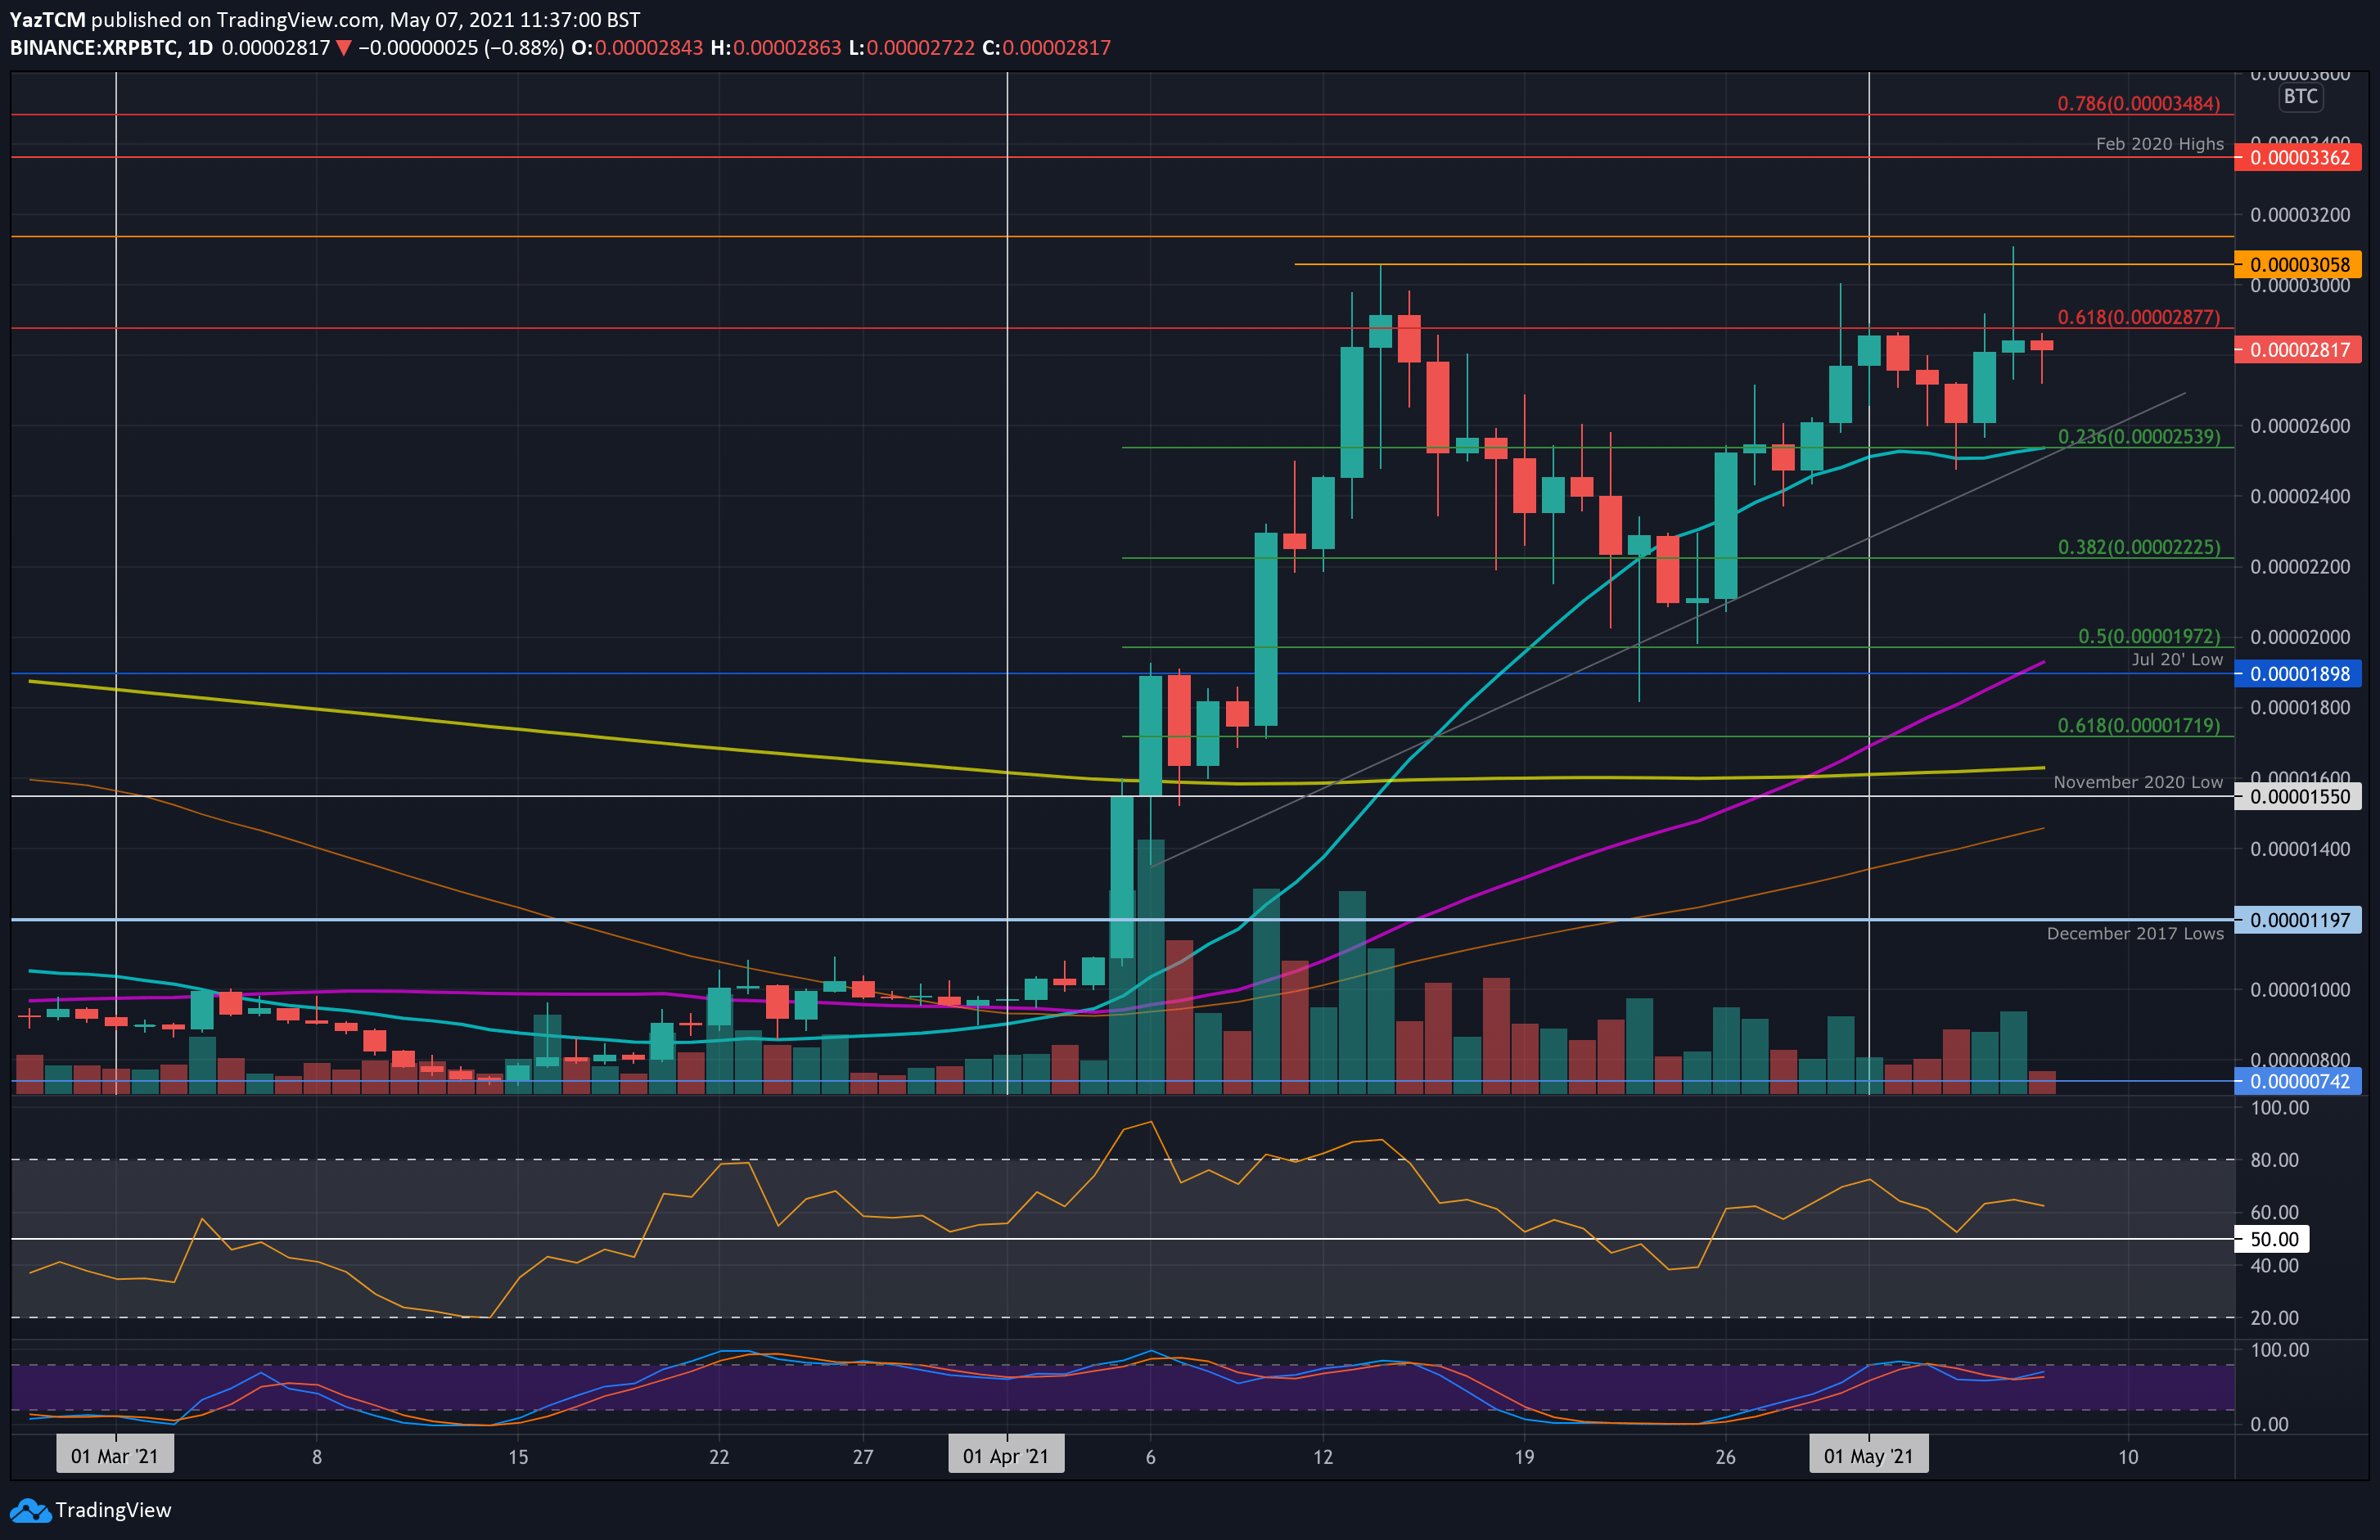
Against bitcoin, XRP Is seeing a similar pattern as it struggles to make any ground above 2877 SAT (bearish .618 Fib). It started the month at this resistance and ended up falling into 2600 SAT support on Tuesday.
It did end up rebounding from here on Webesdayto reach a new 2021 high of 3110 SAT yesterday, however, it still couldn’t close the daily candle above 2877 SAT and has since dropped to 2820 SAT.
Looking ahead, the first resistance lies at 2877 SAT. This is followed by 3110 SAT (2021 High). Added resistance lies at 3362 SAT (Feb 2020 highs) and 3485 SAT (bearish .786 Fib).
On the other side, the first solid support lies at 2600 SAT. This is followed by 2540 SAT (.236 Fib & 20-days MA). Additional support lies at the rising trend line, 2225 SAT (.382 Fib) and 2000 SAT.
Cardano
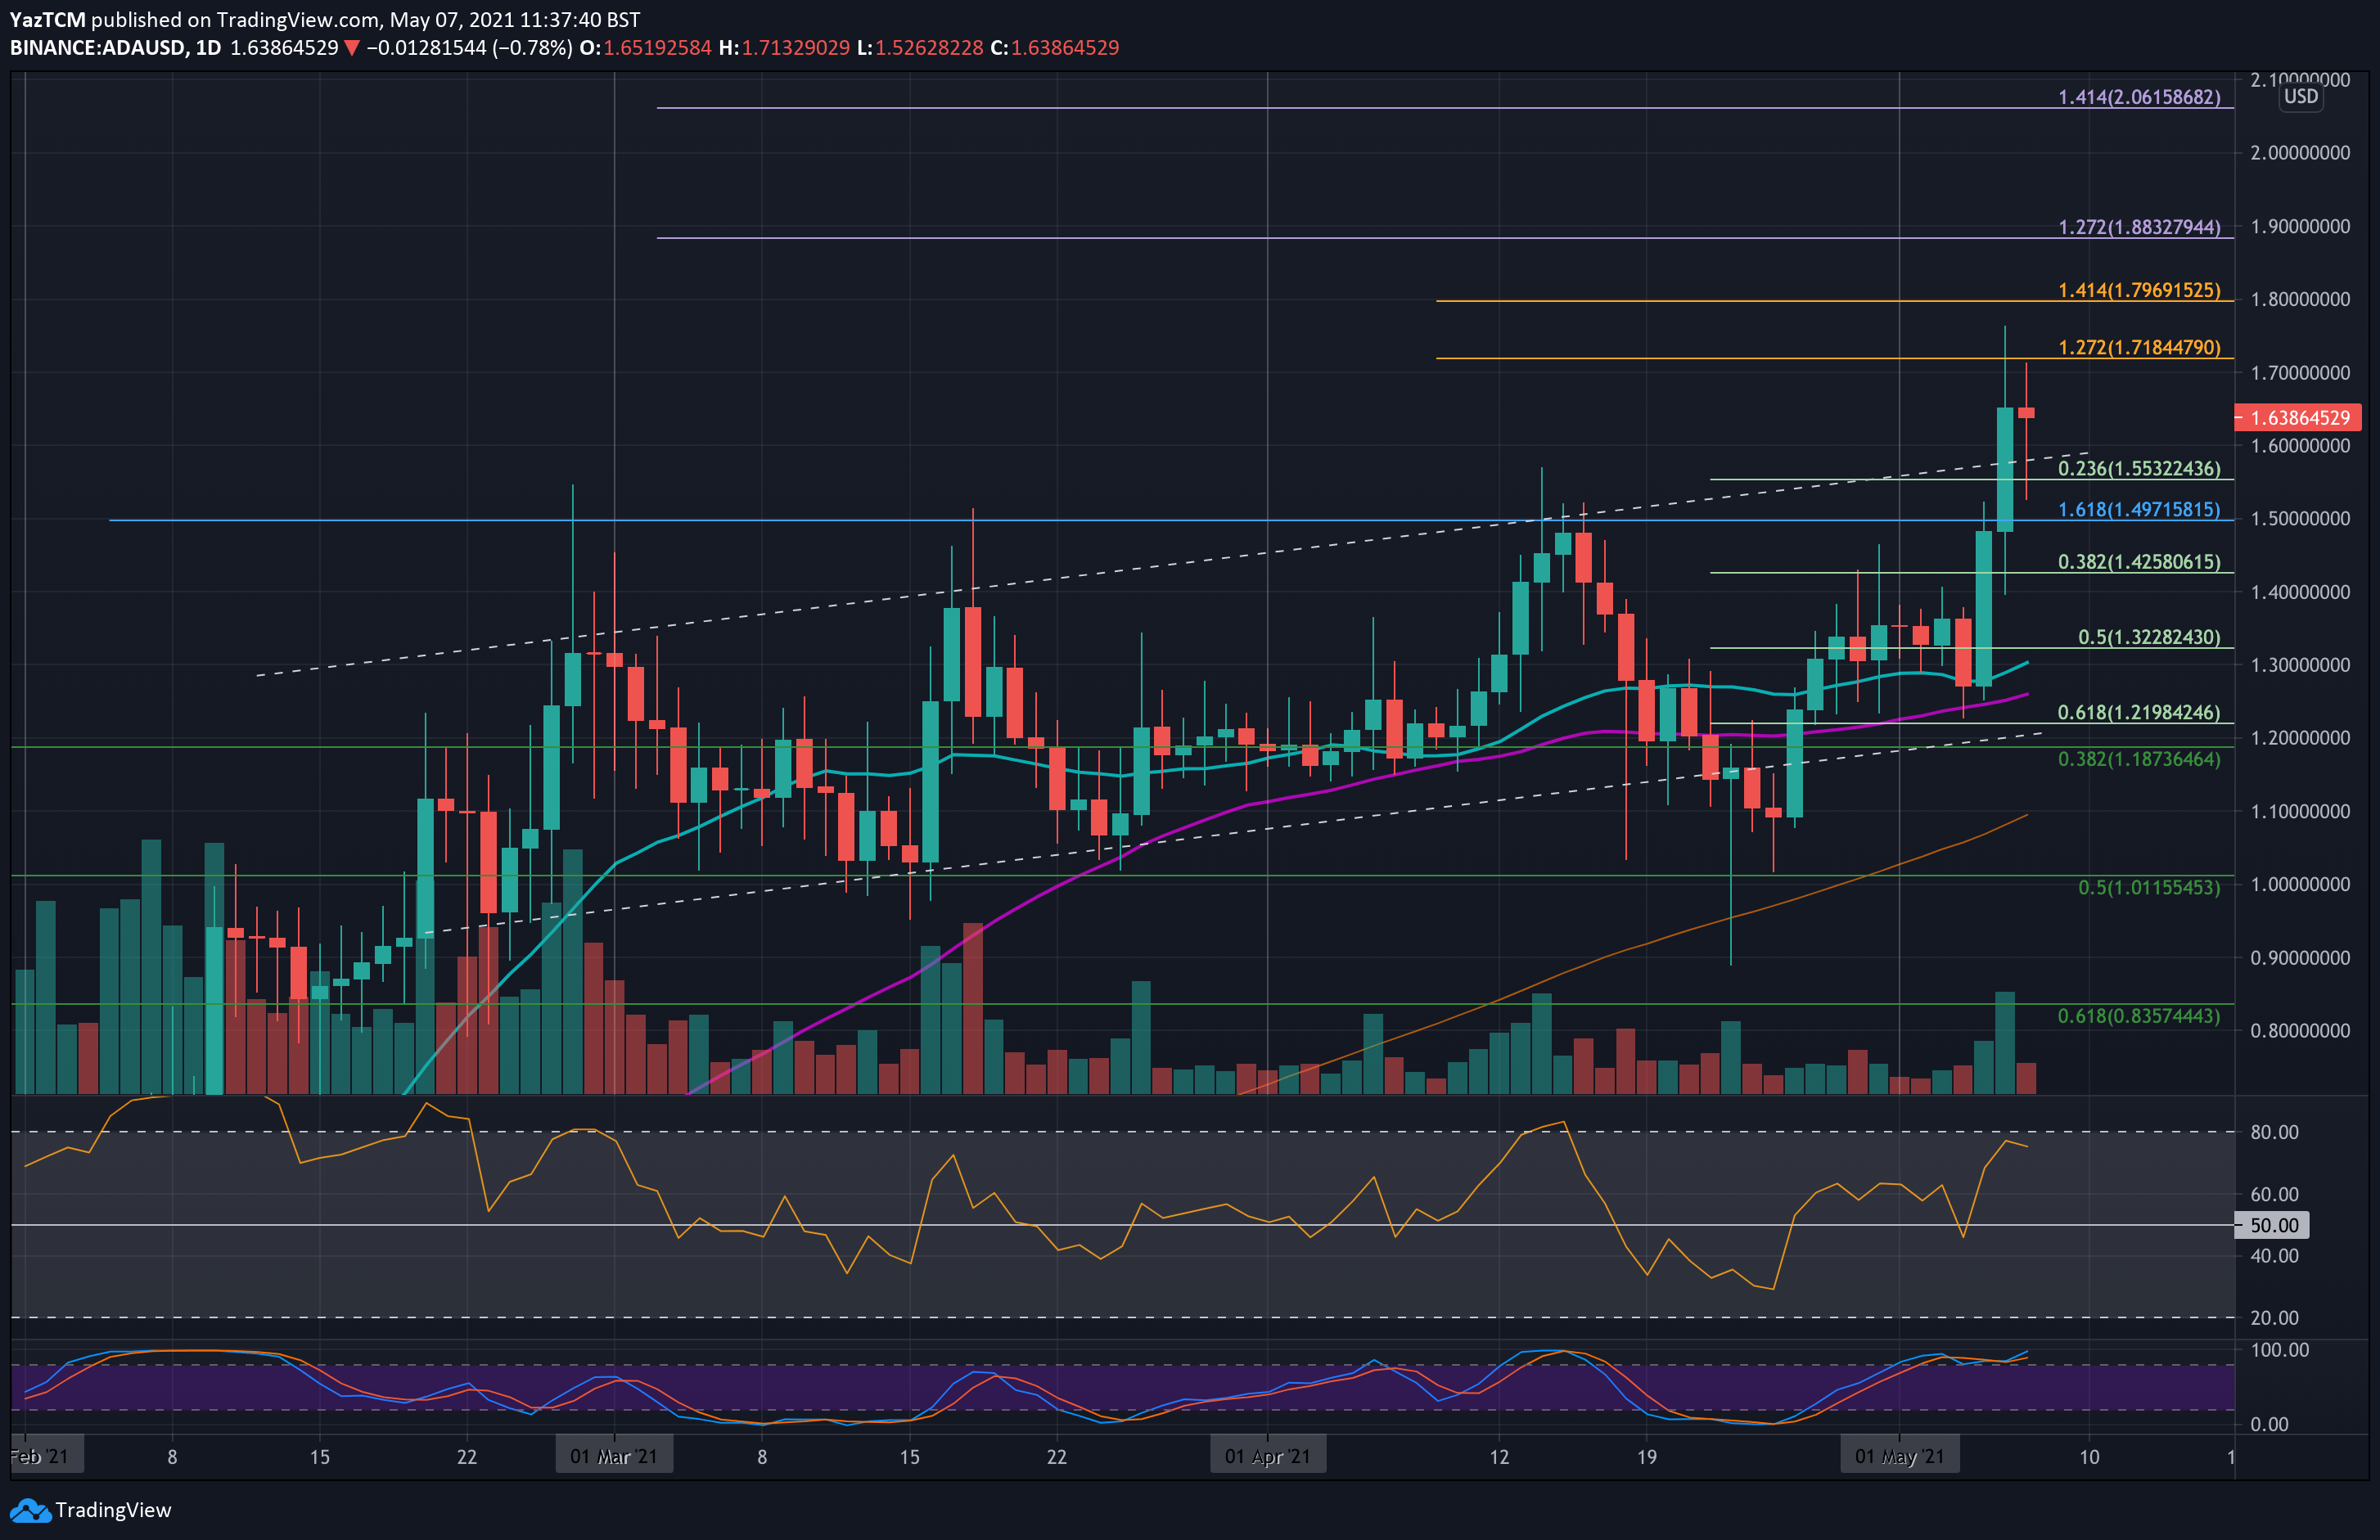
ADA saw a 25% price surge this week as it finally broke above the ascending price channel it was stuck inside throughout the past two months. The cryptocurrency started the month at around $1.35 but slipped lower into the support at the 20-days MA at around $1.25.
From there, it rebounded on Wednesday as it returned to the $1.50 resistance. Yesterday, ADA continued beyond $1.50 and broke to the upside of the ascending price channel to set a new ATH price at $1.76. It has since dropped slightly as it trades at $1.63.
Moving forward, the first resistance lies at $1.72 (1.272 Fib Extension). This is followed by $1.78 (ATH), $1.88 (1.272 Fib Extension – purple), and $2.00.
On the other side, the first stong support lies at $1.60. This is followed by $1.55 (.236 Fib), $1.50, $1.42 (.382 Fib), and $1.32 (.5 Fib).
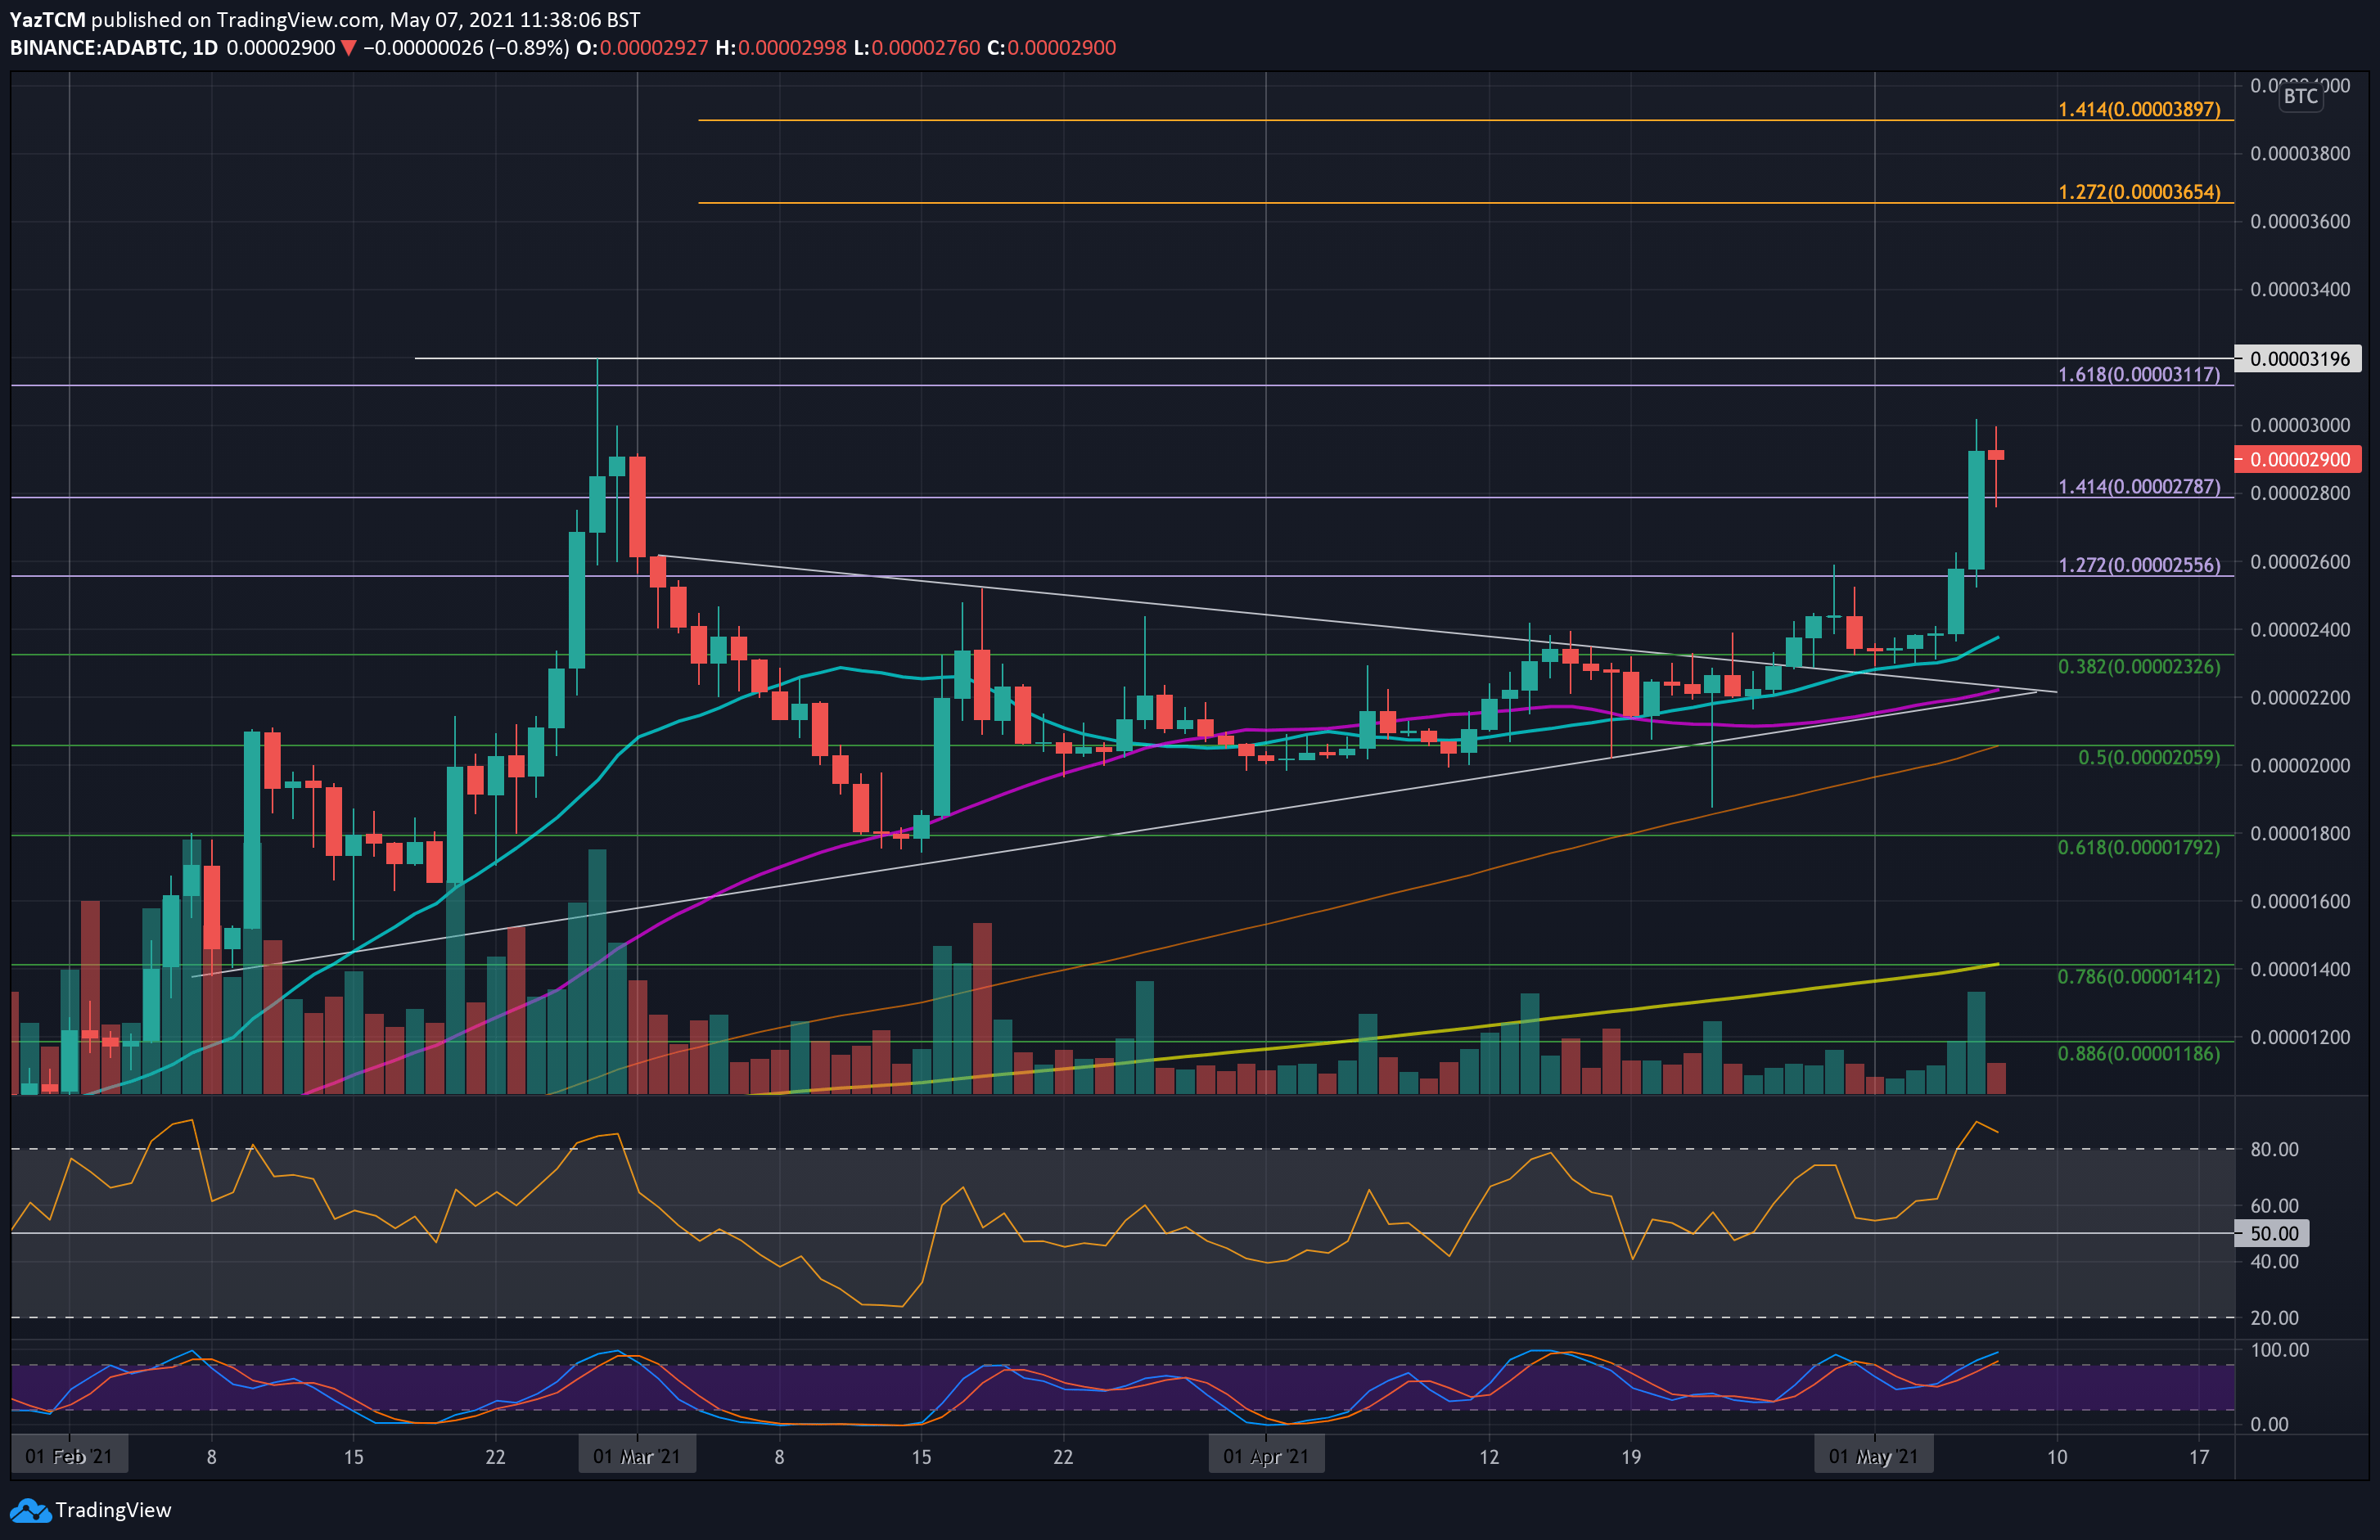
ADA witnessed a strong week against bitcoin. The cryptocurrency started the month at around 2325 SAT and started to push higher from there. Yesterday, it managed to penetrate resistance at 2600 SAT and reach as high as 3000 SAT.
It has since dropped slightly from there as it trades around 2900 SAT.
Looking ahead, the first support lies at 2800 SAT. this is followed by 2600 SAT, 2400 SAT (20-days MA), and 2200 SAT (50-days MA).
On the other side, the first resistance lies at 3000 SAT. This is followed by 3117 SAT (1.618 Fib Extension), 3196 SAT (2021 highs), and 3400 SAT.
Litecoin
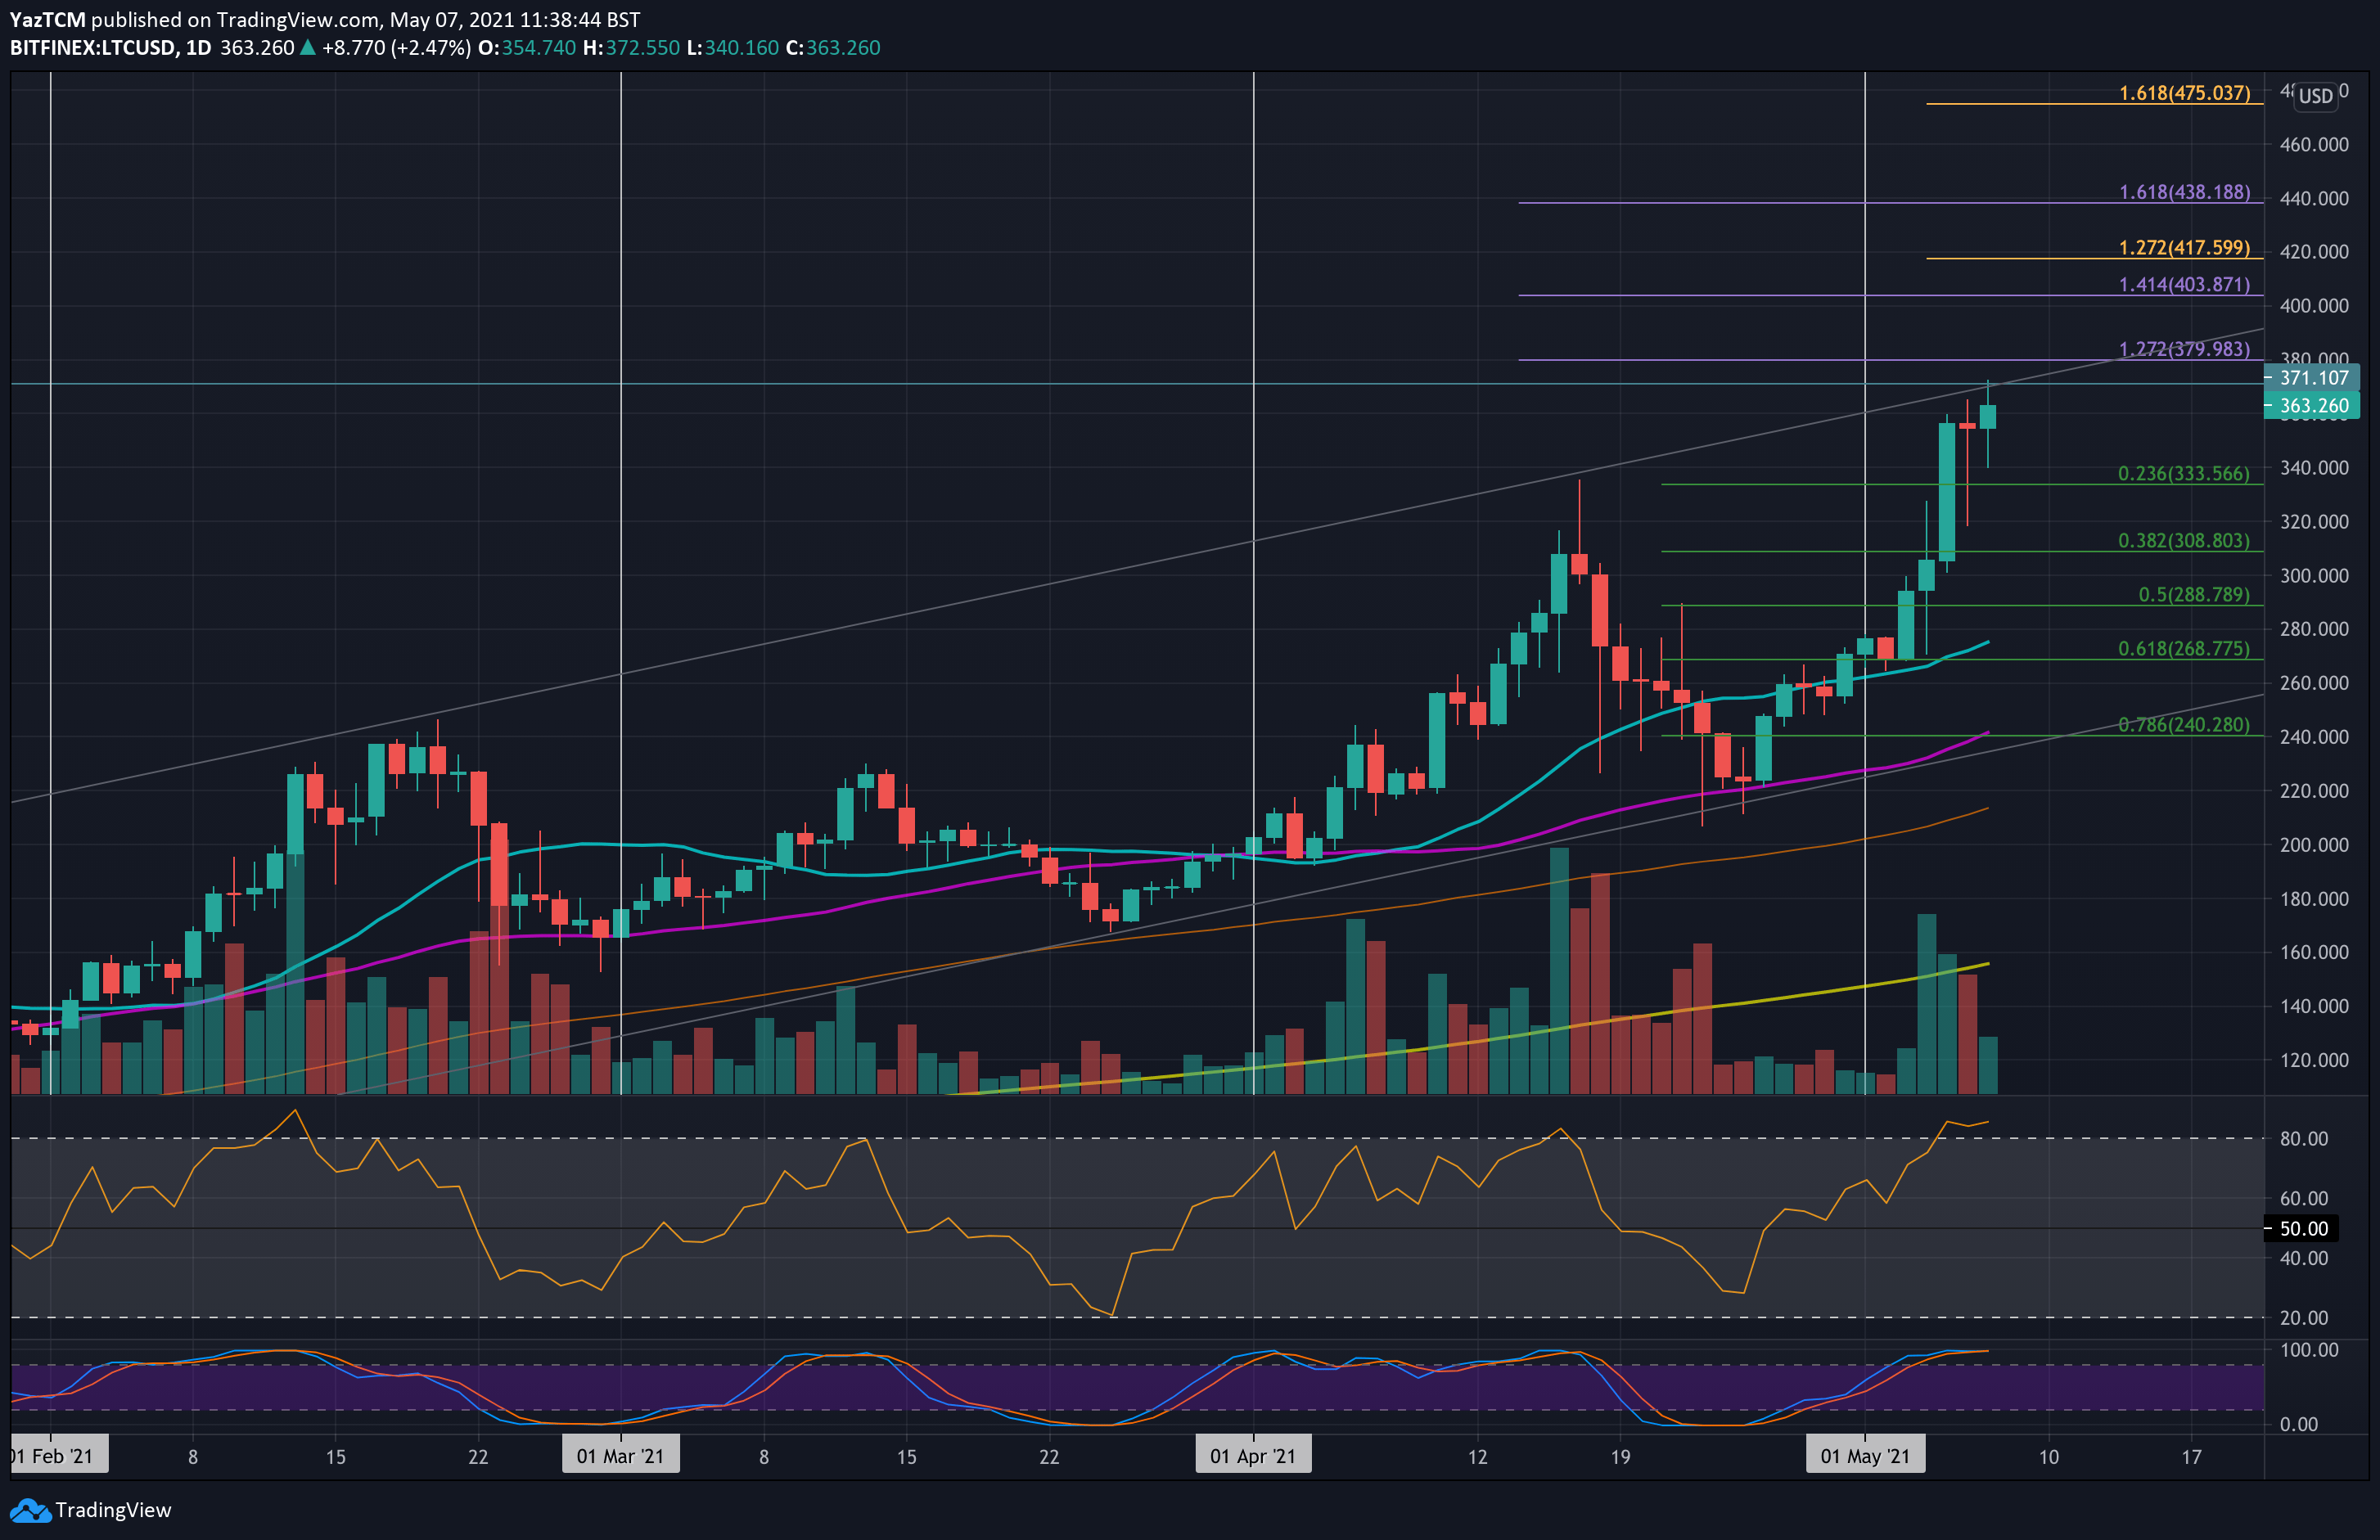
Litecoin is the strongest performer on this list after surging by a solid 41.7% over the past week. The cryptocurrency managed to set a new ATH after breaking $370 and hitting $372.55 today.
The cryptocurrency started the month by trading at around $268 (20-days MA). From there, it started to push higher each day until setting the new ATH price today. We can see that Litecoin is trading inside an ascending price channel and is now testing the resistance at the upper boundary.
Moving forward, if the bulls can break the upper boundary of the price channel, the first resistance lies at $380 (1.272 Fib Extension). This is followed by $400 (1.414 Fib Extension), $417.60 (short term 1.272 Fib Extension), and $440 (1.618 Fib Extension).
On the other side, the first strong support lies at $333.50 (.236 Fib). This is followed by $320, $308.80 (.382 Fib), $300, and $288.80 (.5 Fib).
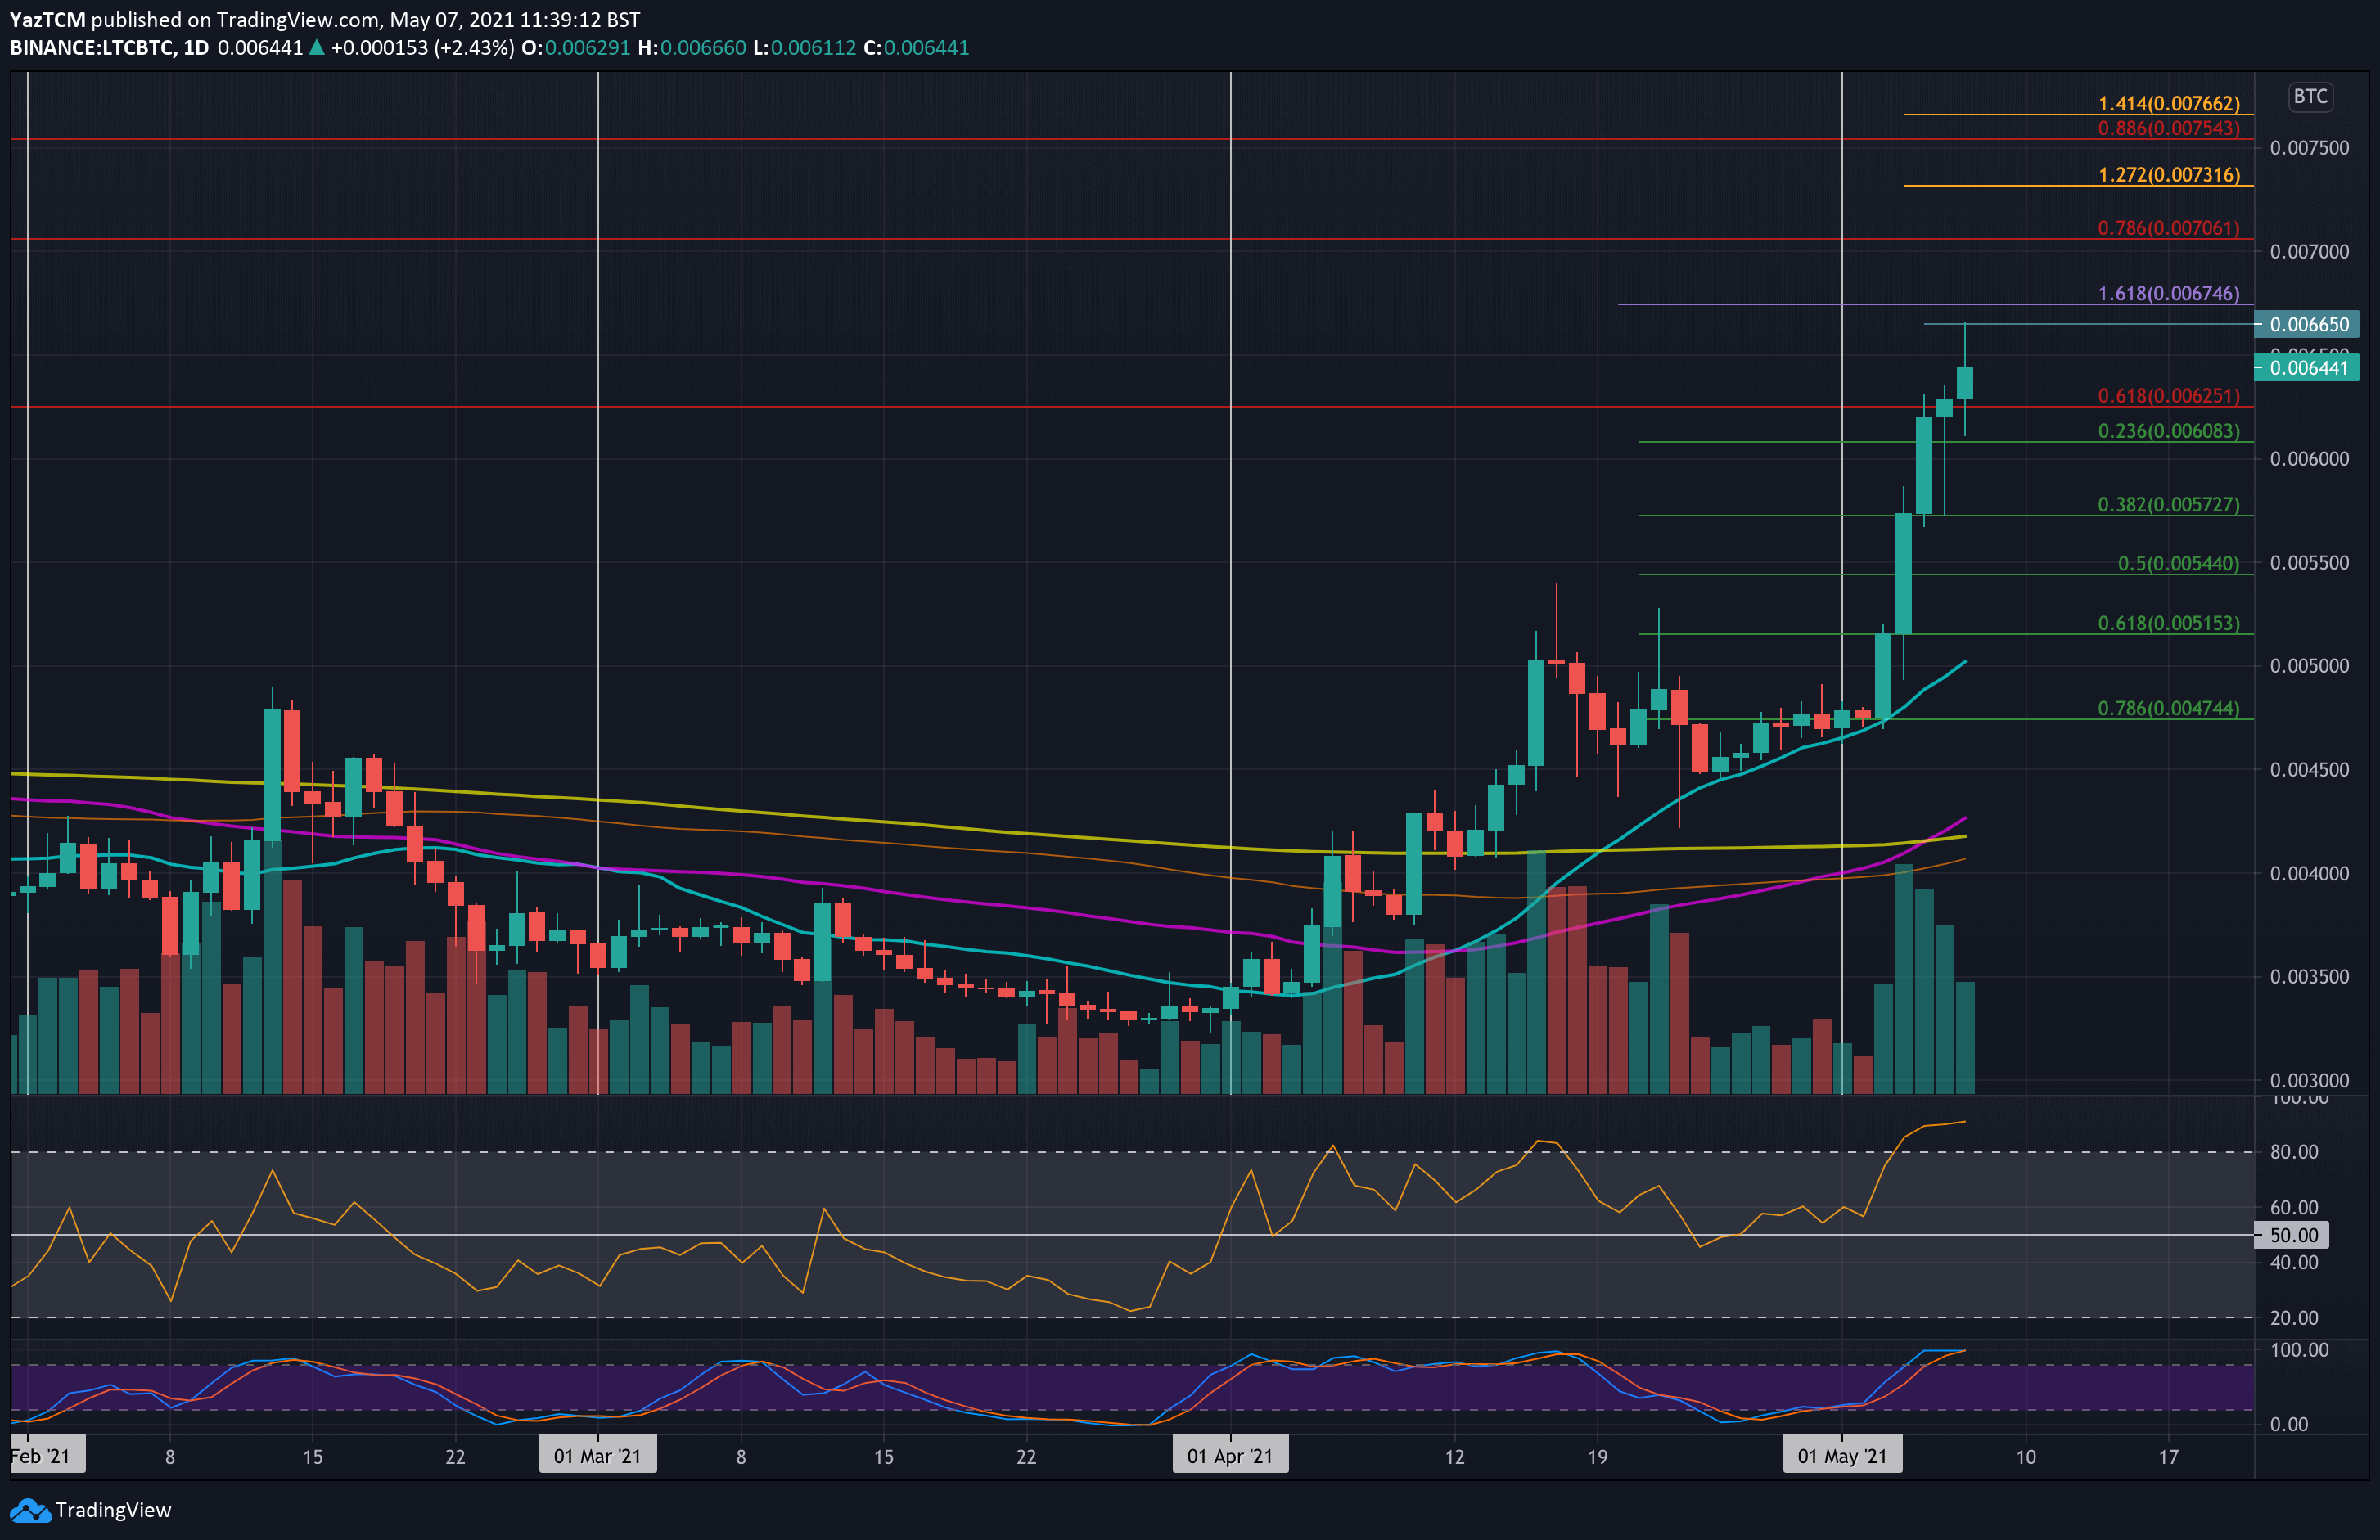
LTC is also doing well against BTC after setting a new 2021 high at 0.00665 BTC today. The coin started the month at around 0.00475 BTC and started to surge higher. Yesterday, it managed to break above resistance at 0.00625 BTC (bearish .618 Fib).
It continued further higher today to set the new 2021 high at 0.00665 BTC but has since dropped slightly to hit 0.00644 BTC.
Looking ahead, the first resistance above 0.00665 BTC lies at 0.00675 BTC (1.618 Fib Extension). This is followed by 0.007 BTC (bearish .786 Fib), 0.00731 BTC (1.272 Fib Extension), and 0.00754 BTC (bearish .886 Fib).
On the other side, the first support lies at 0.00625 BTC. This is followed by 0.006 BTC, 0.00572 BTC (.382 Fib), 0.00544 BTC (.5 Fib), and 0.005 BTC (20-days MA).
