Crypto Price Analysis & Overview May 28th: Bitcoin, Ethereum, Ripple, Cardano, & Polygon (MATIC)
It was another tough week in the cryptocurrency market where almost everything is trading in the red. Here’s how some of the major coins performed over the past seven days:
Bitcoin
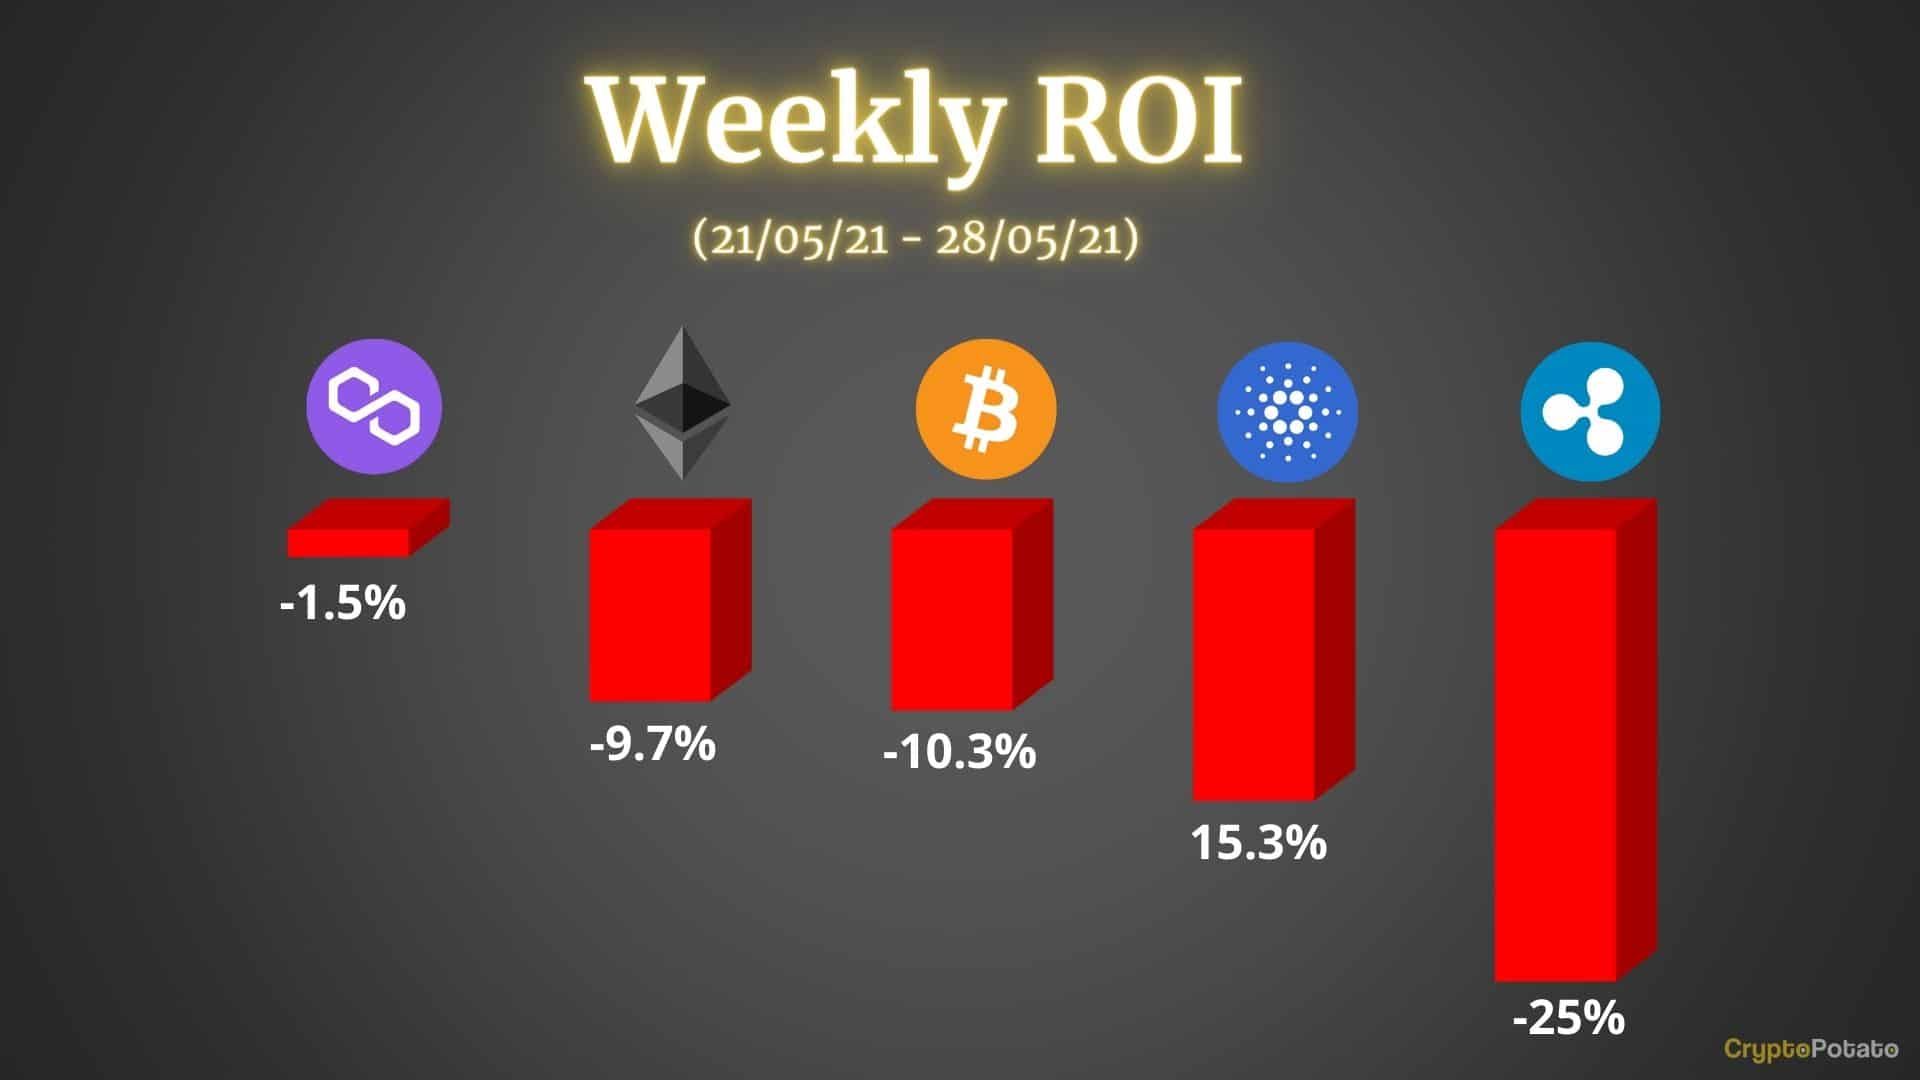
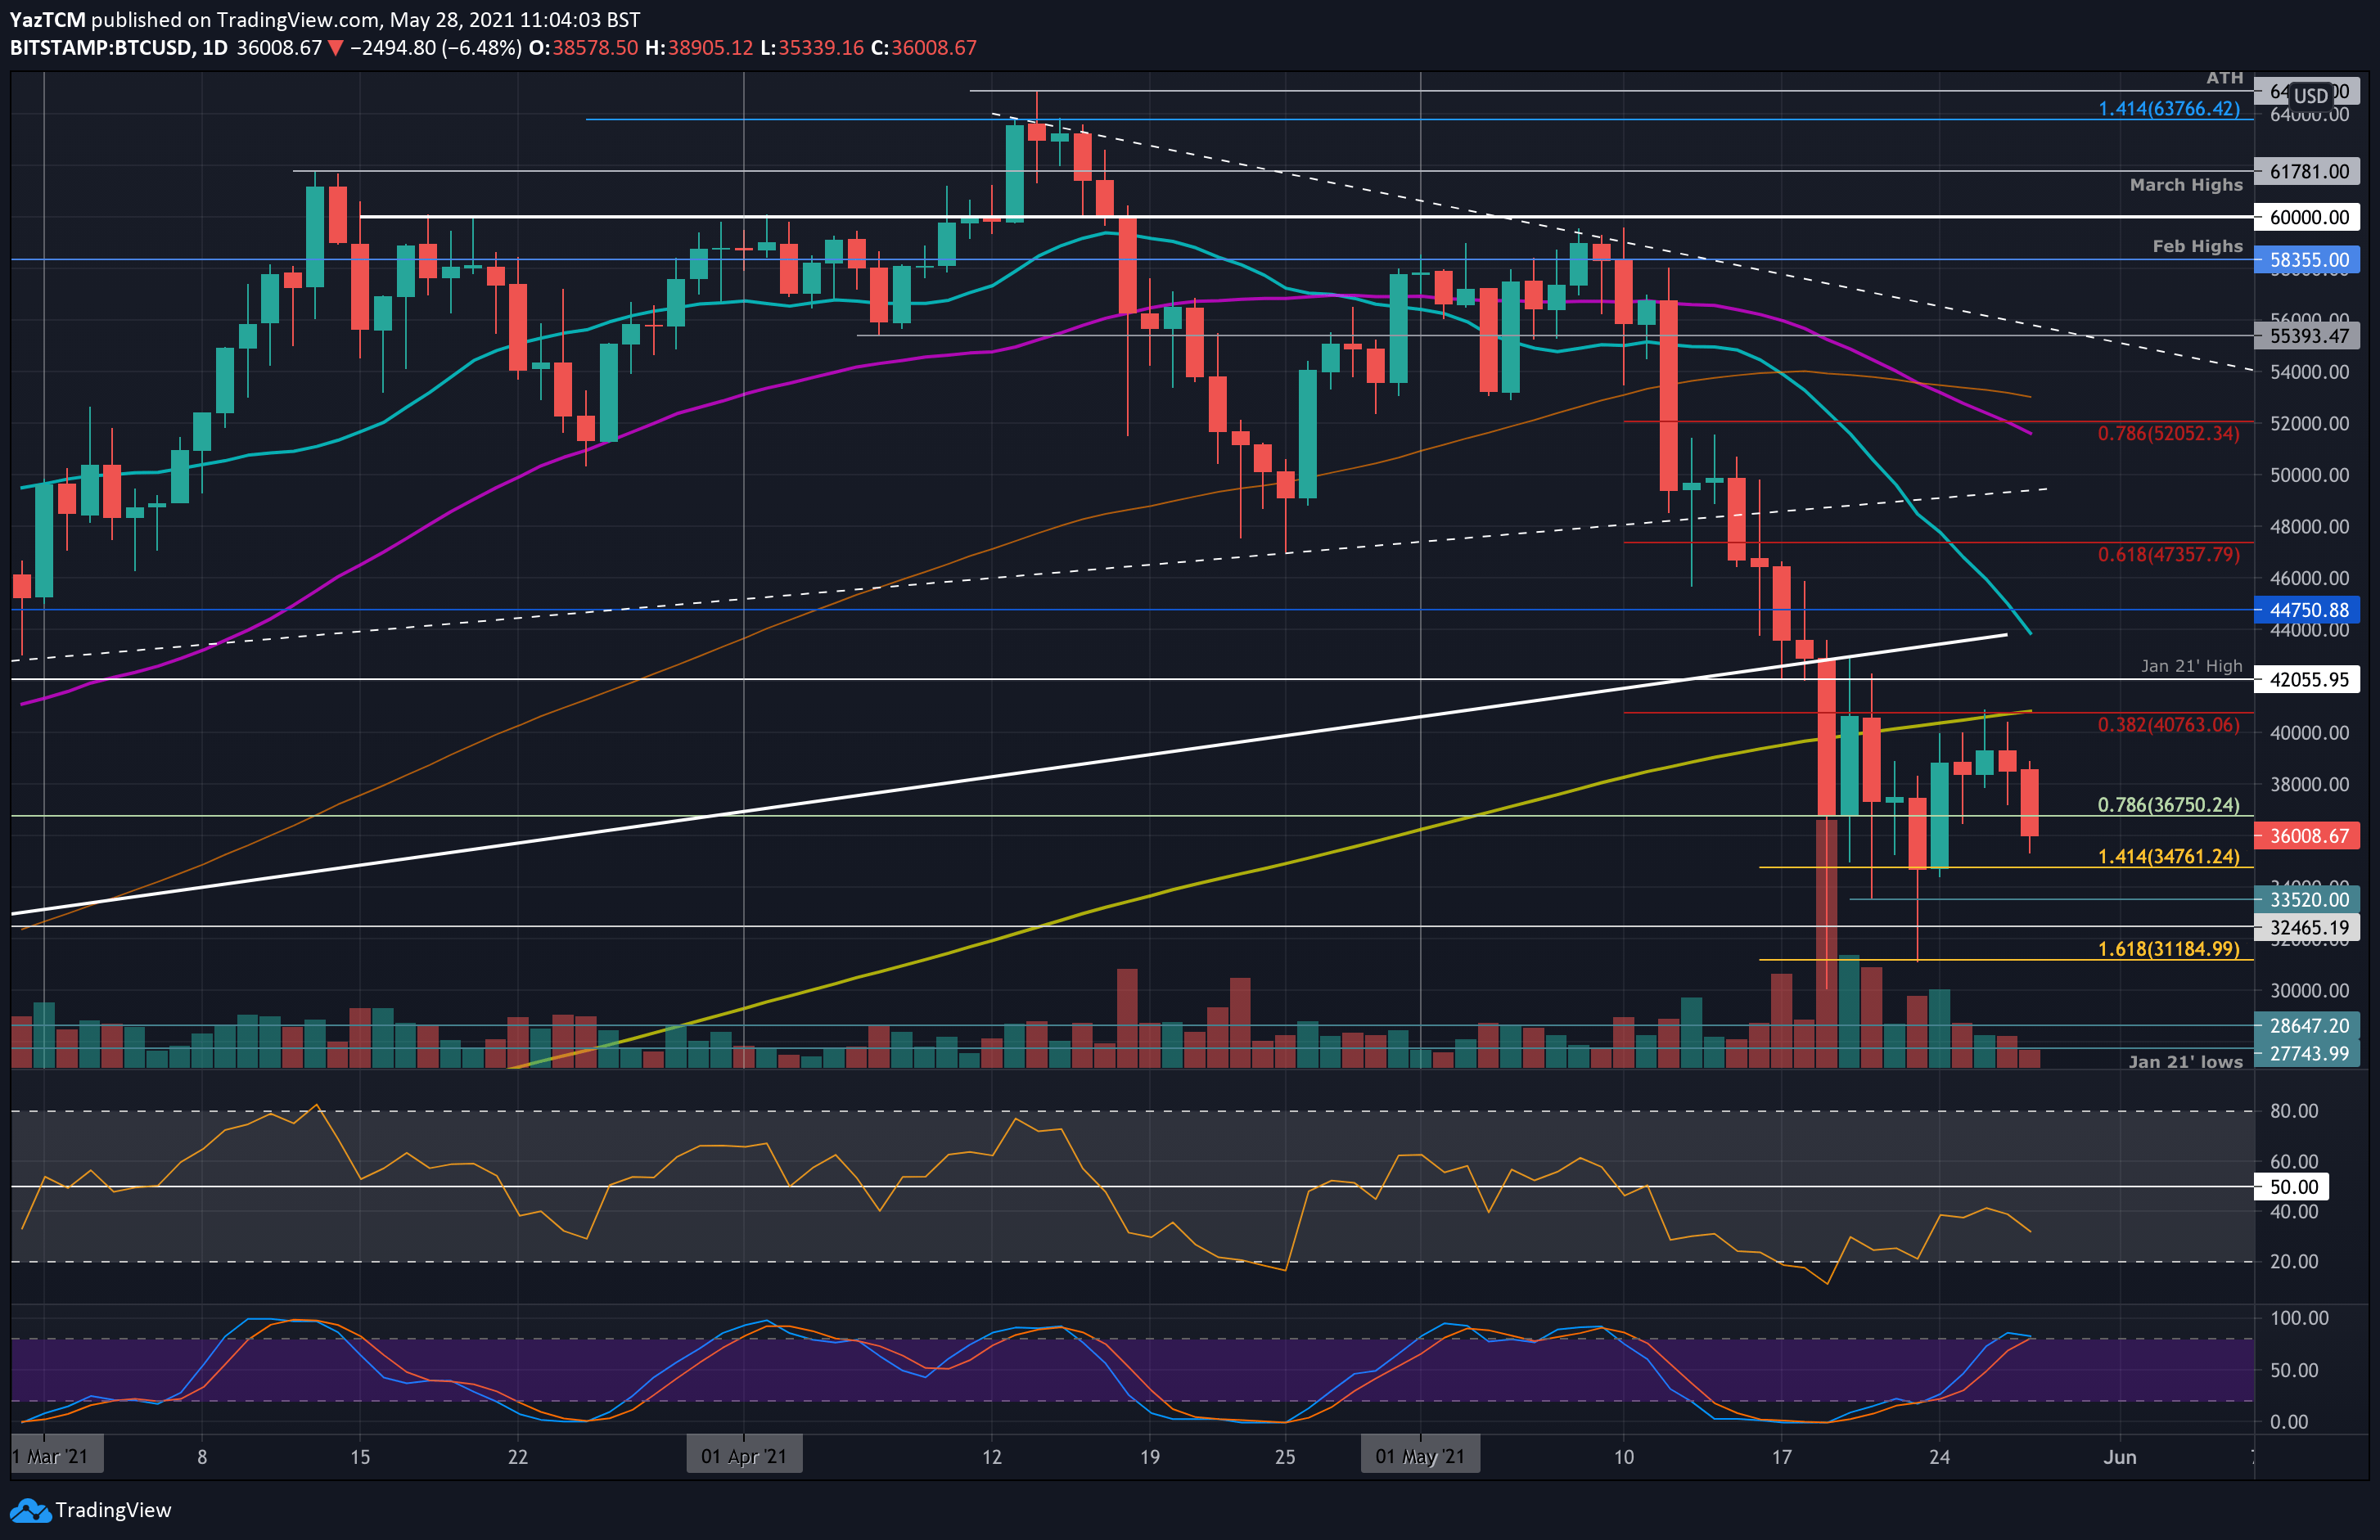
Bitcoin is down by a total of 10.3% over the past seven days of trading as it currently sits around $36,000. The cryptocurrency had spiked as low as $31,185 (downside 1.618 Fib Extension) on Sunday, but the buyers managed to close the daily candle at $34,760 (downside 1.414 Fib Extension).
From there, BTC attempted to rebound throughout the week to reach $40,765 on Wednesday. Unfortunately, the buyers could not overcome this resistance provided by the 200-day MA and a bearish .382 Fib Retracement and rolled over from there yesterday.
Today, BTC dropped another 8% which saw it sliding beneath $38,000 to reach the current $36,000 level.
Looking ahead, if the bears continue beneath $38,000, the first support lies at $34,760 (downside 1.414 Fib Extension & Sunday’s closing price). Beneaht this, support lies at $33,520, $32,465, and $41,185 (downside 1.618 Fib Extension). Additional support is expected at $30,000 and $28,650.
On the other side, the first resistance now lies at $38,000. This is followed by $40,000, $40,765 (bearish .382 Fib & 200-day MA), $42,055 (Jan 21’ highs), and $44,000 (100-day MA).
Ethereum
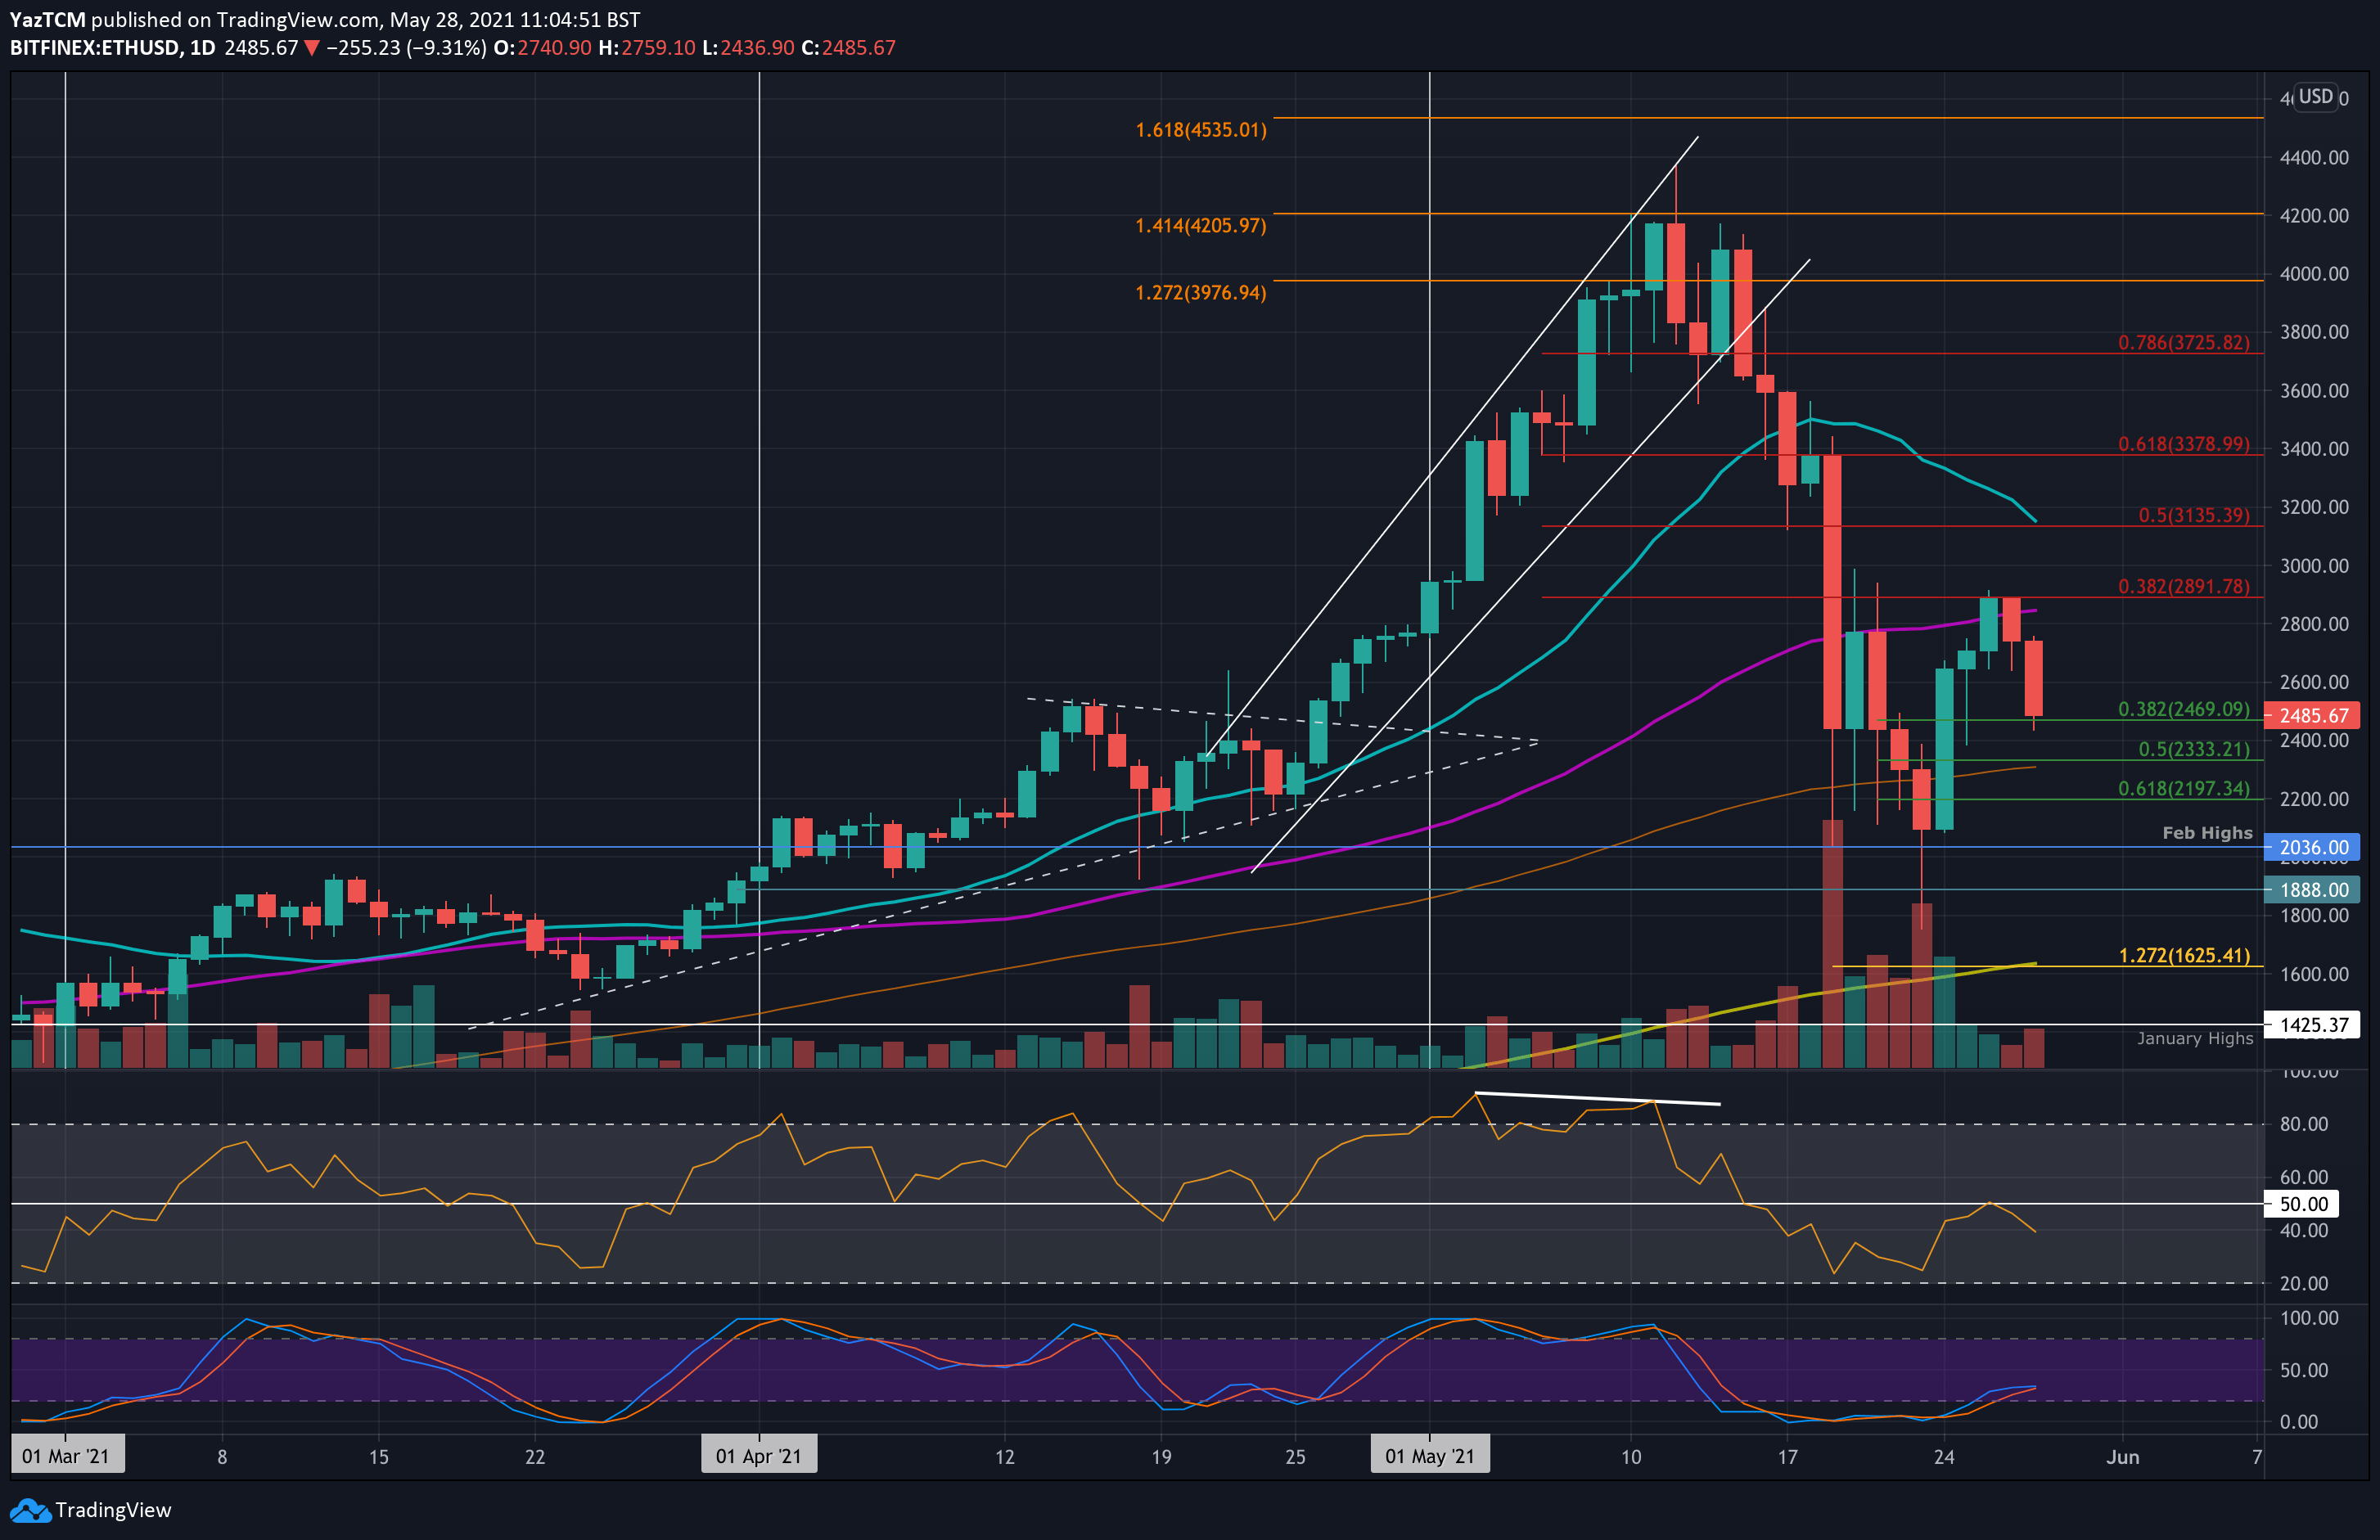
Ethereum is also down by a total of 9.7% this week as the coin now trades around $2470. ETH briefly spiked beneath $1800 on Sunday but managed to close the daily candle above $2100. From there, it started to attempt a recovery throughout the week.
By Wednesday, ETH managed to break resistance at the 50-day MA and reach as high as $2891 (bearish .382 Fib). It was unable to close above this resistance and has since rolled over. It is currently sitting at the support provided by a short-term .382 Fib at $2470.
Moving forward, if the bears break the $2470 support, added support lies at $2333 (.5 Fib & 100-day MA), $2200 (.618 Fib), and $2036. Beneath $2000, added support is found at $1888 (April lows) and $1800.
On the other side, the first resistance lies at $2600. This is followed by $2850 (50-day MA), $2891 (bearish .382 Fib), $3000, and $3135 (bearish .5 Fib & 20-day MA).
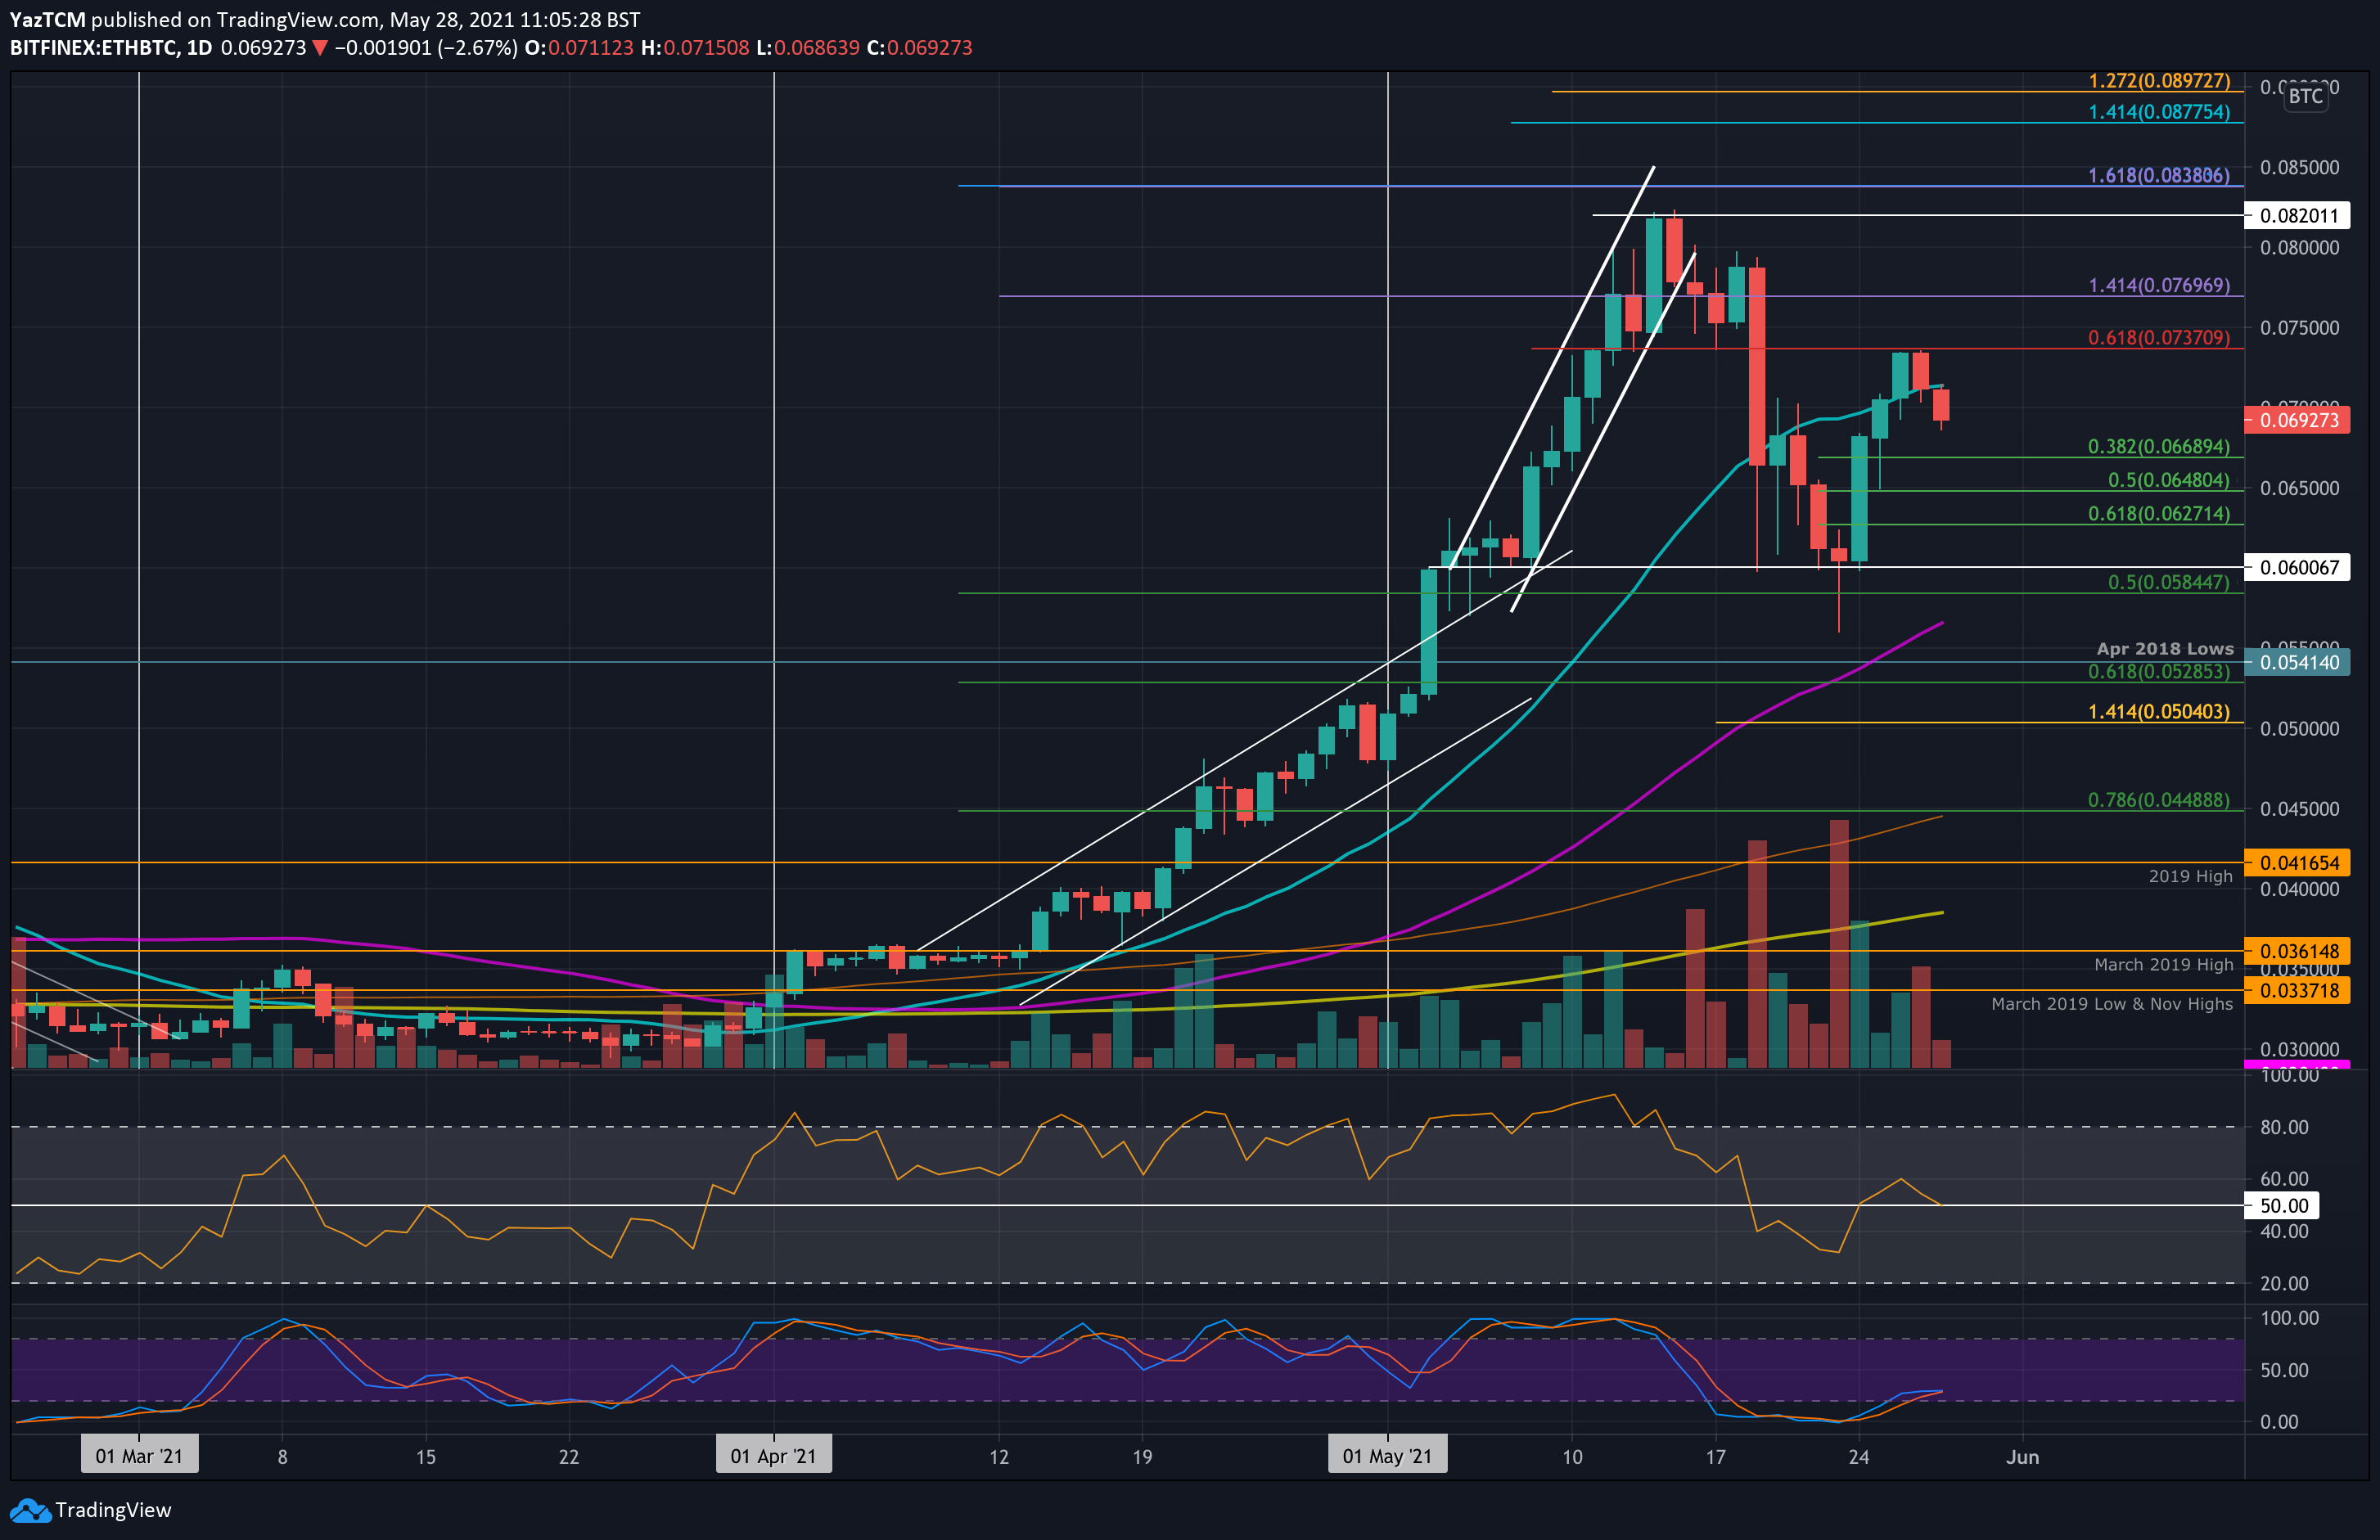
ETH is experiencing a similar trading week against BTC itself. The coin bounced from support at 0.06 BTC on Sunday and started to recover toward the May highs at 0.082 BTC.
By Wednesday, ETH had penetrated the 20-day MA at around 0.07 BTC but failed to overcome resistance at 0.0737 BTC (bearish .618 Fib). It has since rolled over from there and dropped beneath 0.07 BTC today to trade at 0.0692 BTC.
Looking ahead, the first support lies at 0.0668 BTC (.382 Fib). This is followed by 0.0648 BTC (.5 Fib), 0.0627 BTC (.618 Fib), and 0.06 BTC.
On the other side, the first resistance lies at 0.0737 BTC (bearish .618 Fib), 0.075 BTC, 0.0769 BTC (1.414 Fib Extension), and 0.08 BTC.
Ripple
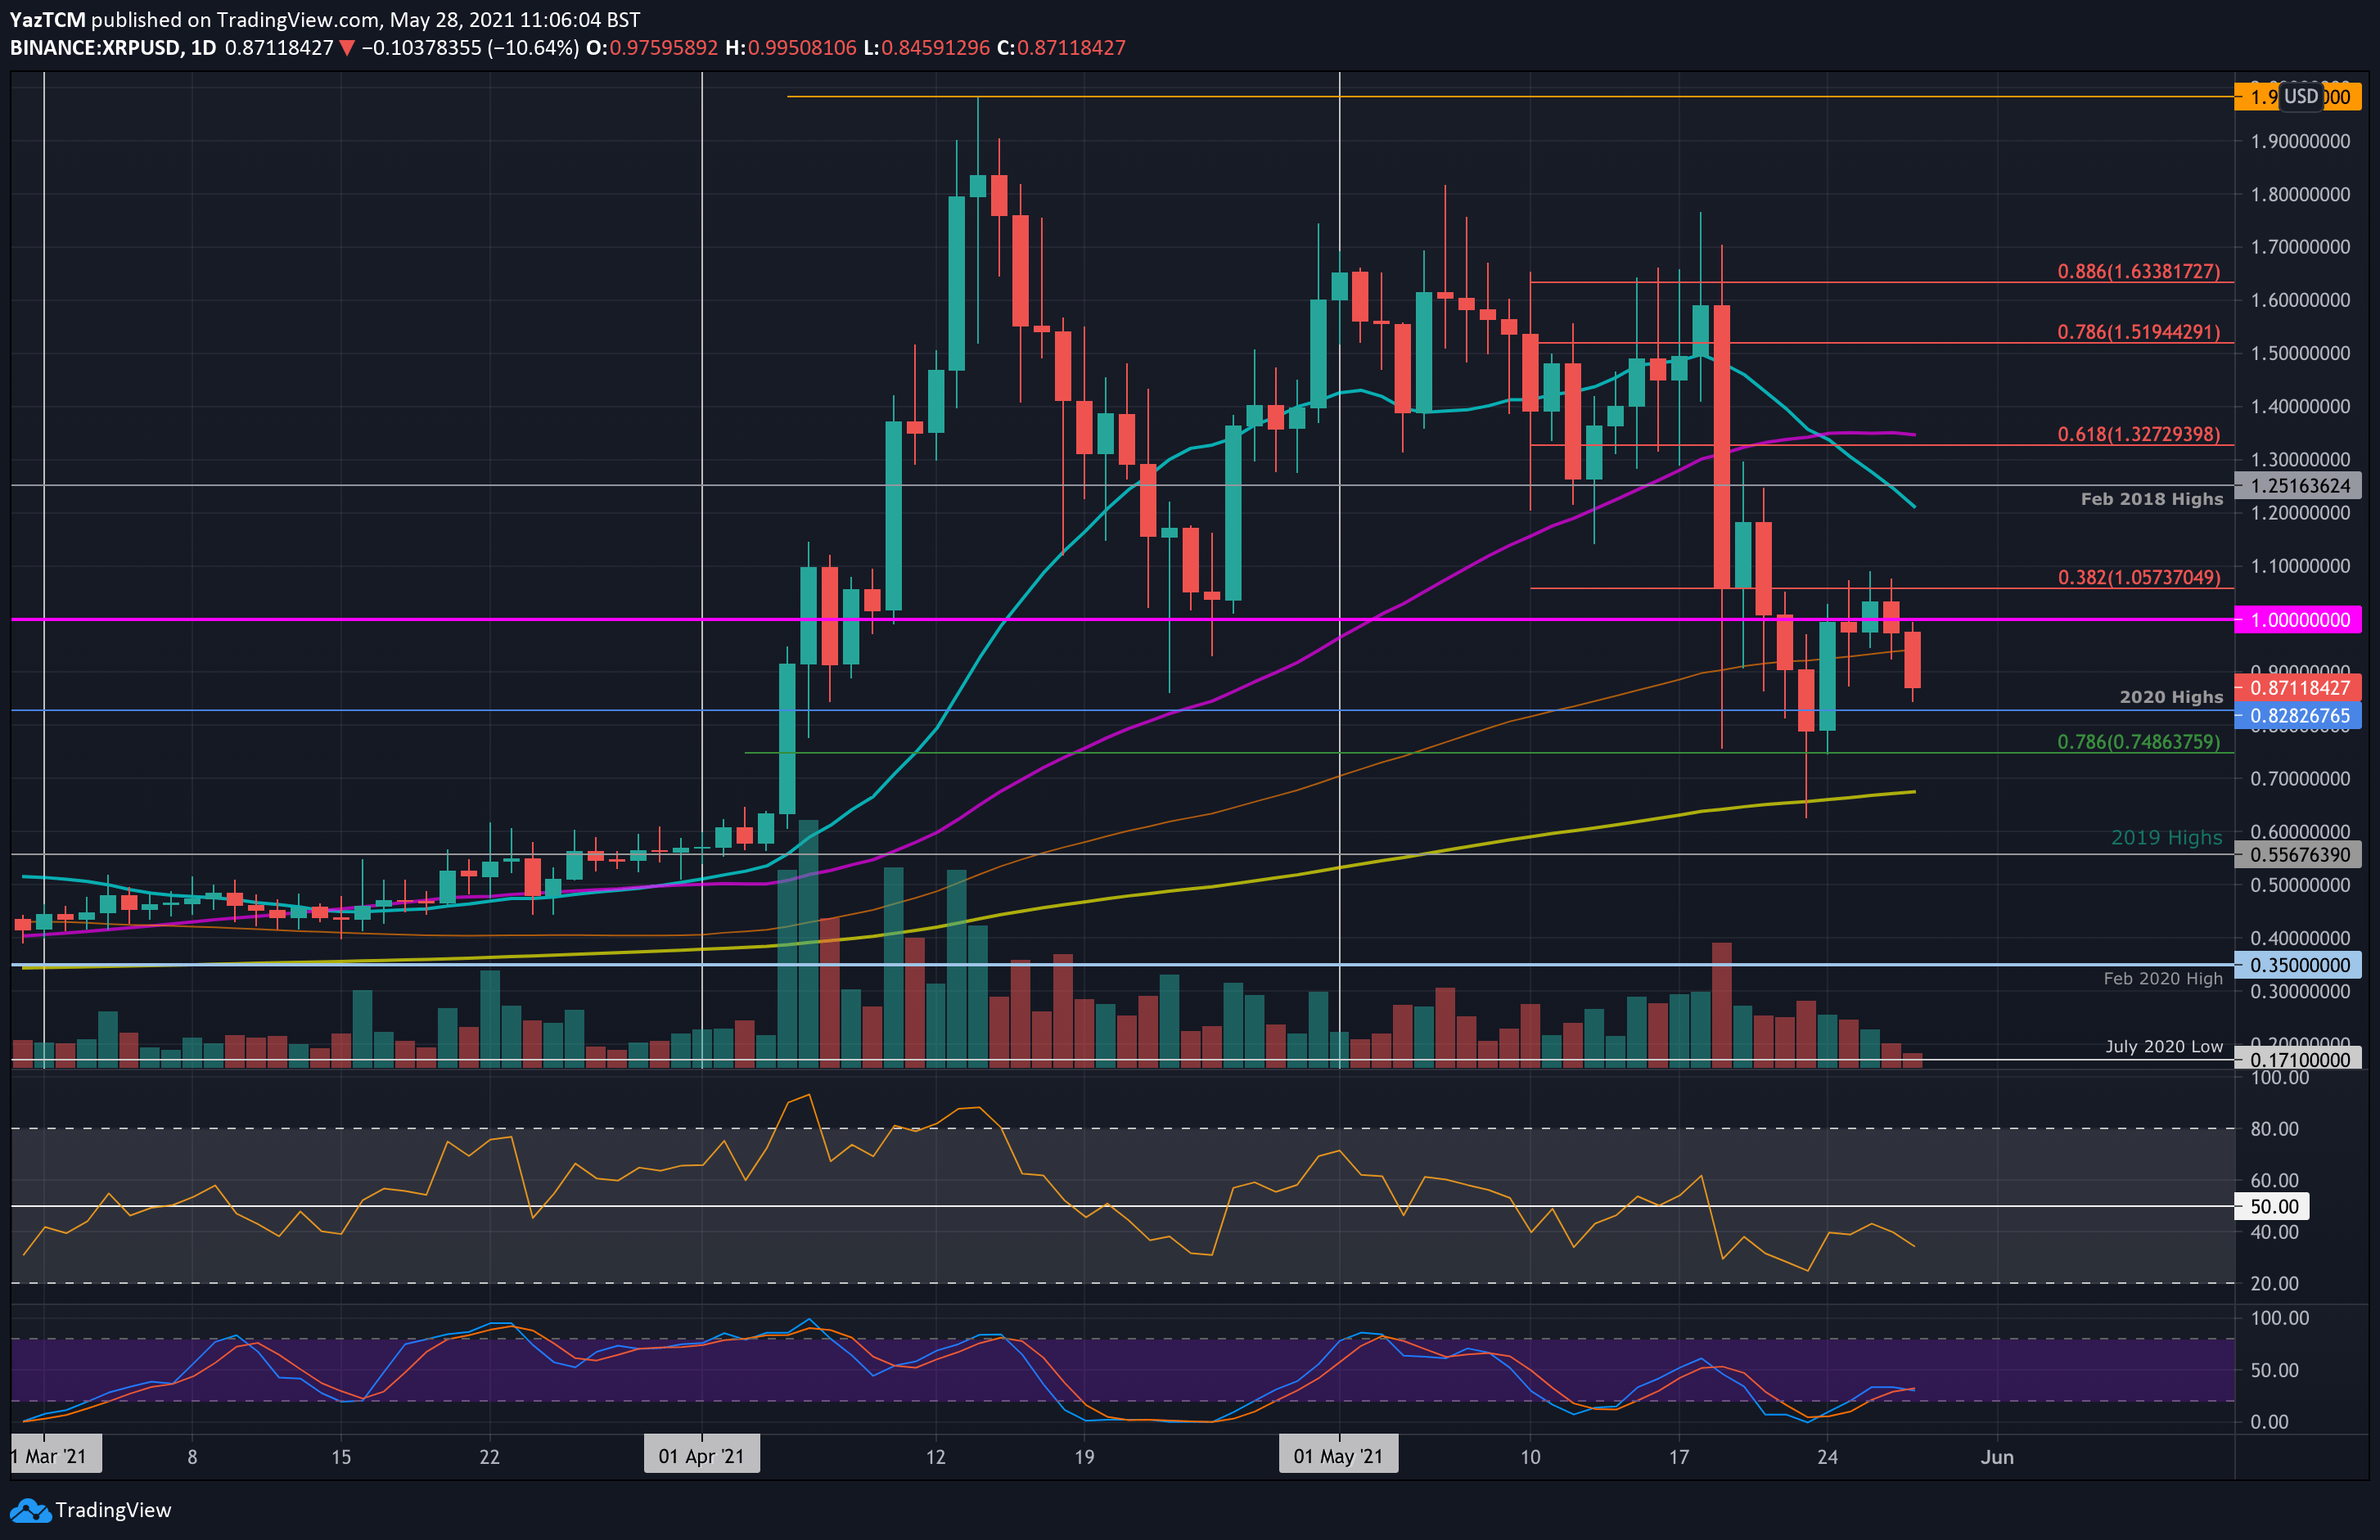
XRP is down by a sharp 25% over the past week of trading as it falls beneath $1 to the current $0.871 level. XRP rebounded from support at $0.748 (.786 Fib) on Monday and proceeded to climb back above $1.
Unfortunately, it could not overcome resistance at $1.05 (bearish .382 Fib) during the week and rolled over beneath $1 yesterday. Today, XRP continued beneath the 100-day MA at $0.92 to reach the current $0.871 level.
Moving forward, the first support lies at $0.8282 (2020 highs). This is followed by $0.748 (.786 Fib), $0.69 (200-day MA), $0.6, and $0.556 (2019 highs).
On the other side, the first resistance lies at $0.92 (100-day MA). This is followed by $1, $1.05 (bearish. 382 Fib), $1.20 (20-day MA), and $1.25 (Feb 2018 highs).
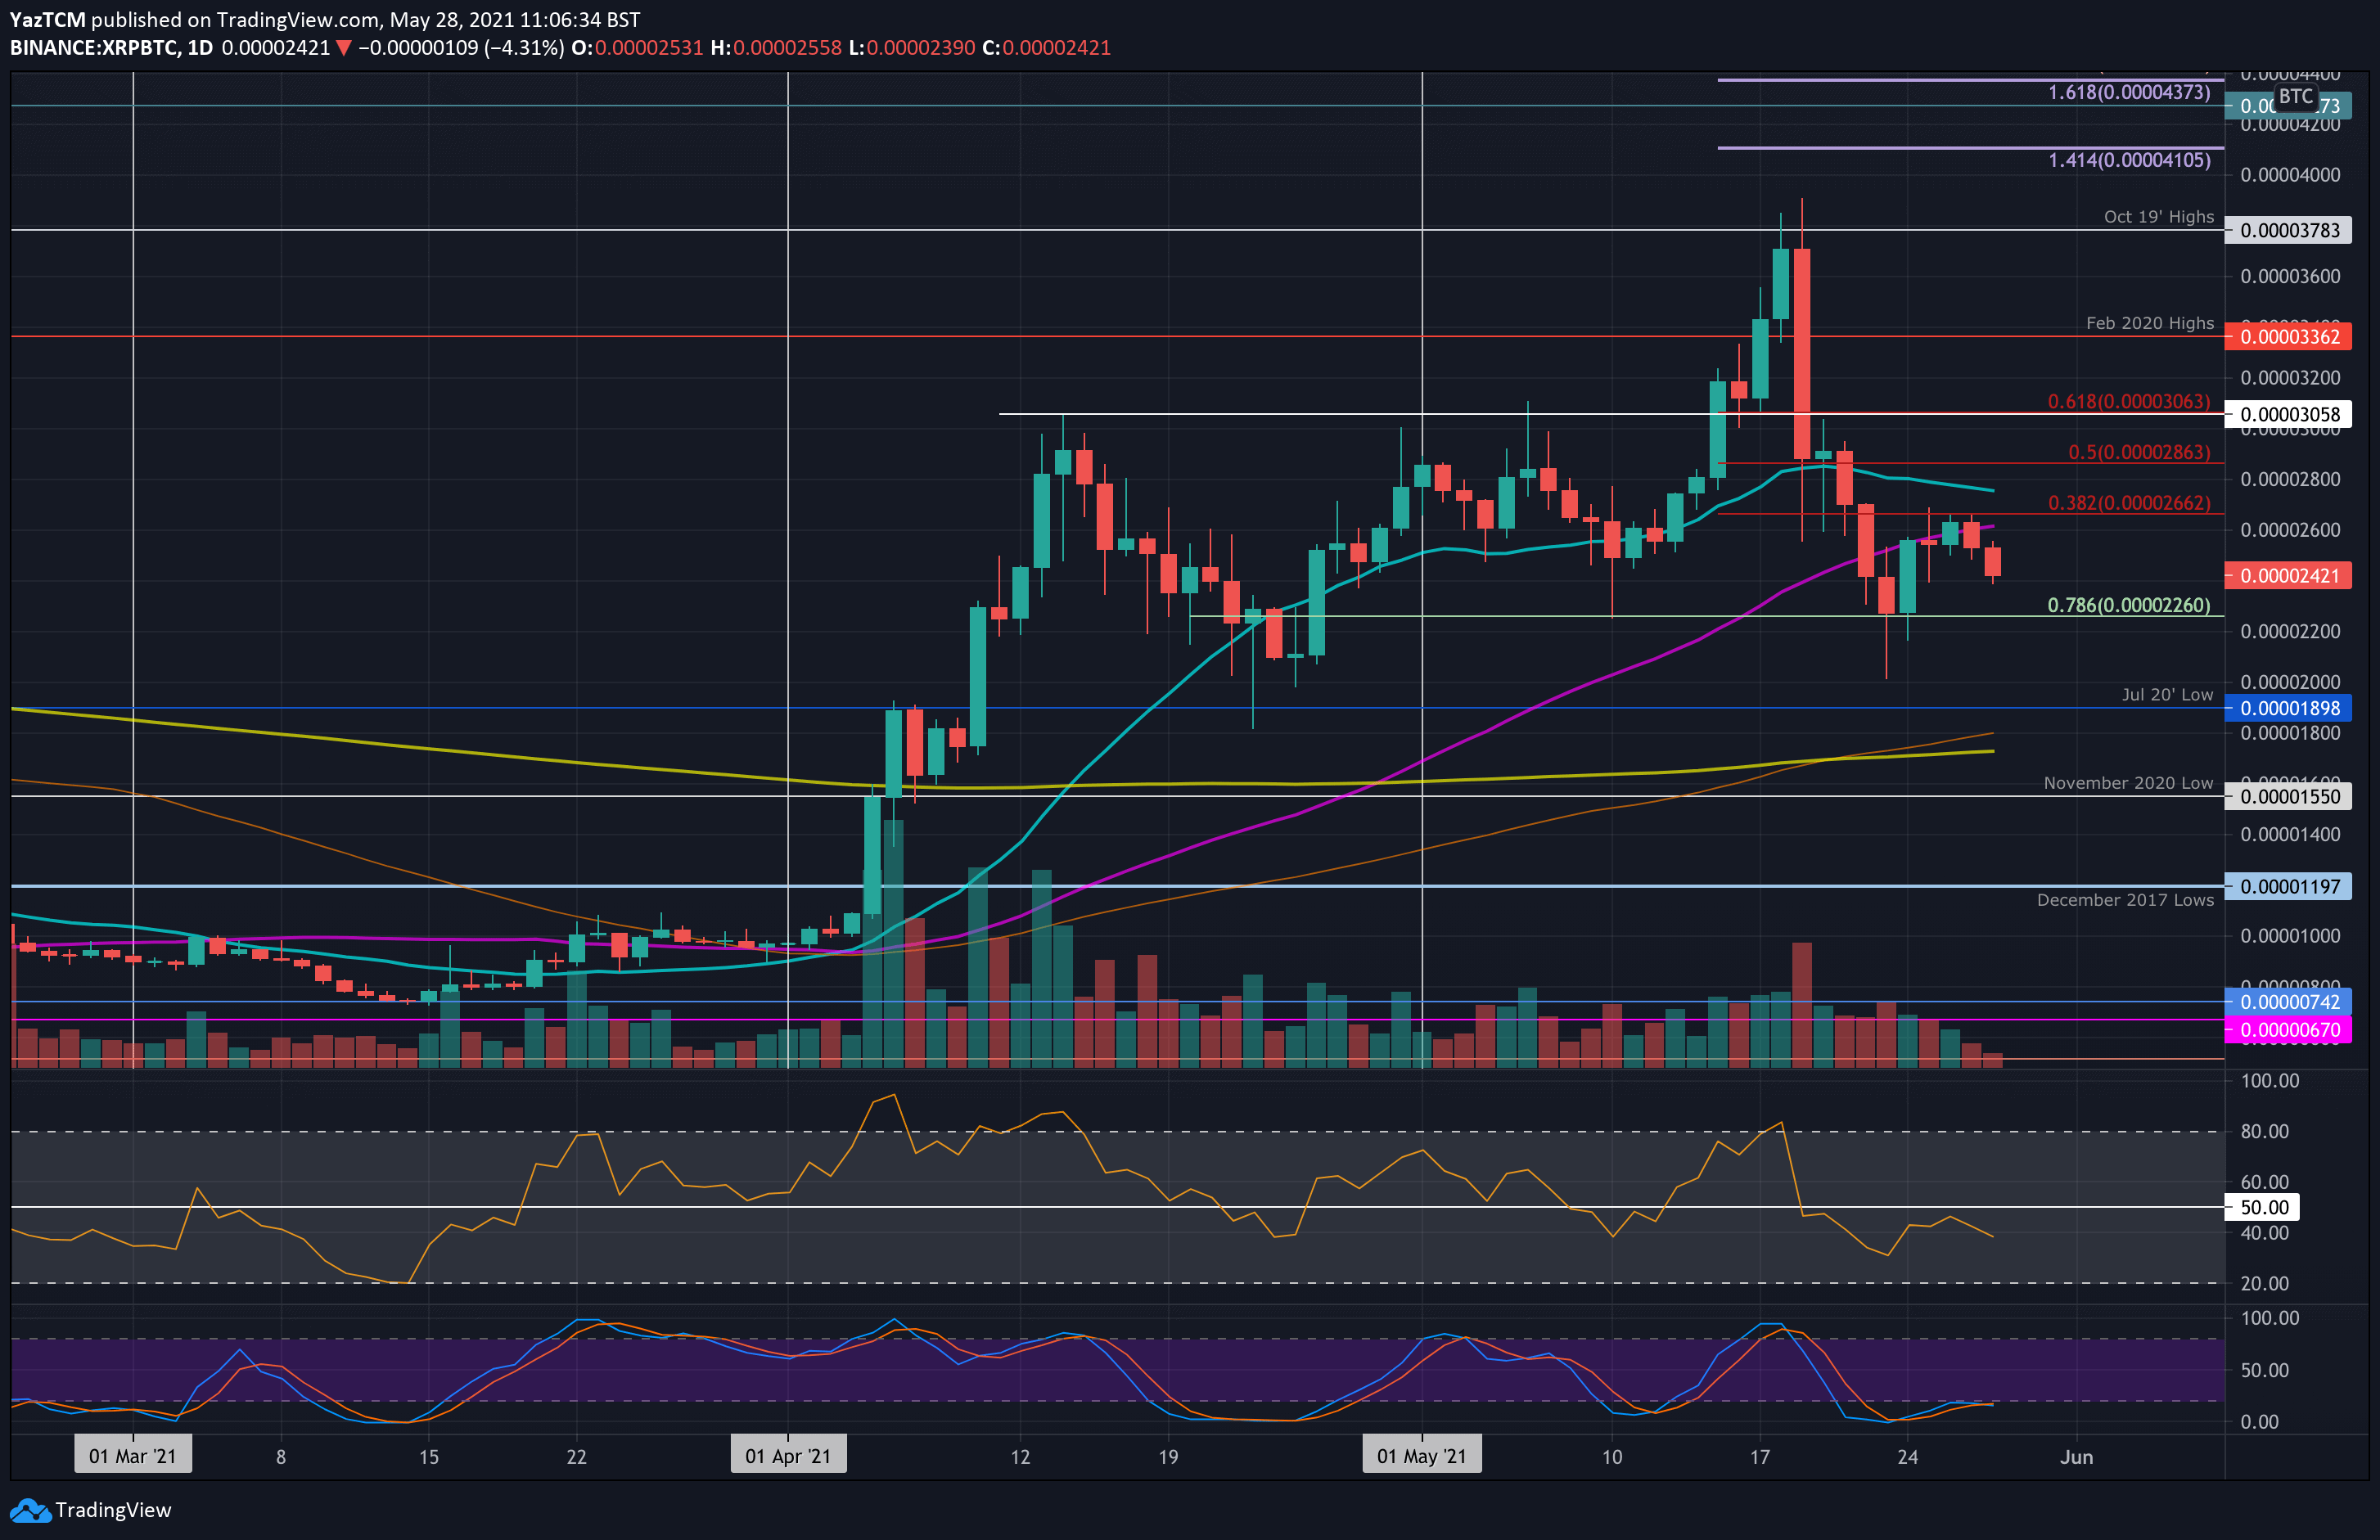
Against bitcoin, XRP found support at 2260 SAT (.786 Fib) after spiking as low as 2000 SAT on Sunday. It rebounded from this level on Monday as it started to climb higher.
It found resistance at 2662 SAT (bearish .382 Fib) on Wednesday and could not overcome the level. It has reversed and now trades at the current 2420 SAT level.
Looking ahead, the first strong support lies at 2260 SAT (.786 Fib). This is followed by 2000 SAT (May lows), 1900 SAT (July 2020 low), and 1800 SAT (100-day MA).
On the other side, the first strong resistance lies around 2600 SAT (50-day MA & bearish .382 Fib). This is followed by 2750 SAT (20-day MA), 2863 SAT (bearish .5 Fib), and 3000 SAT (bearish .618 Fib).
Cardano
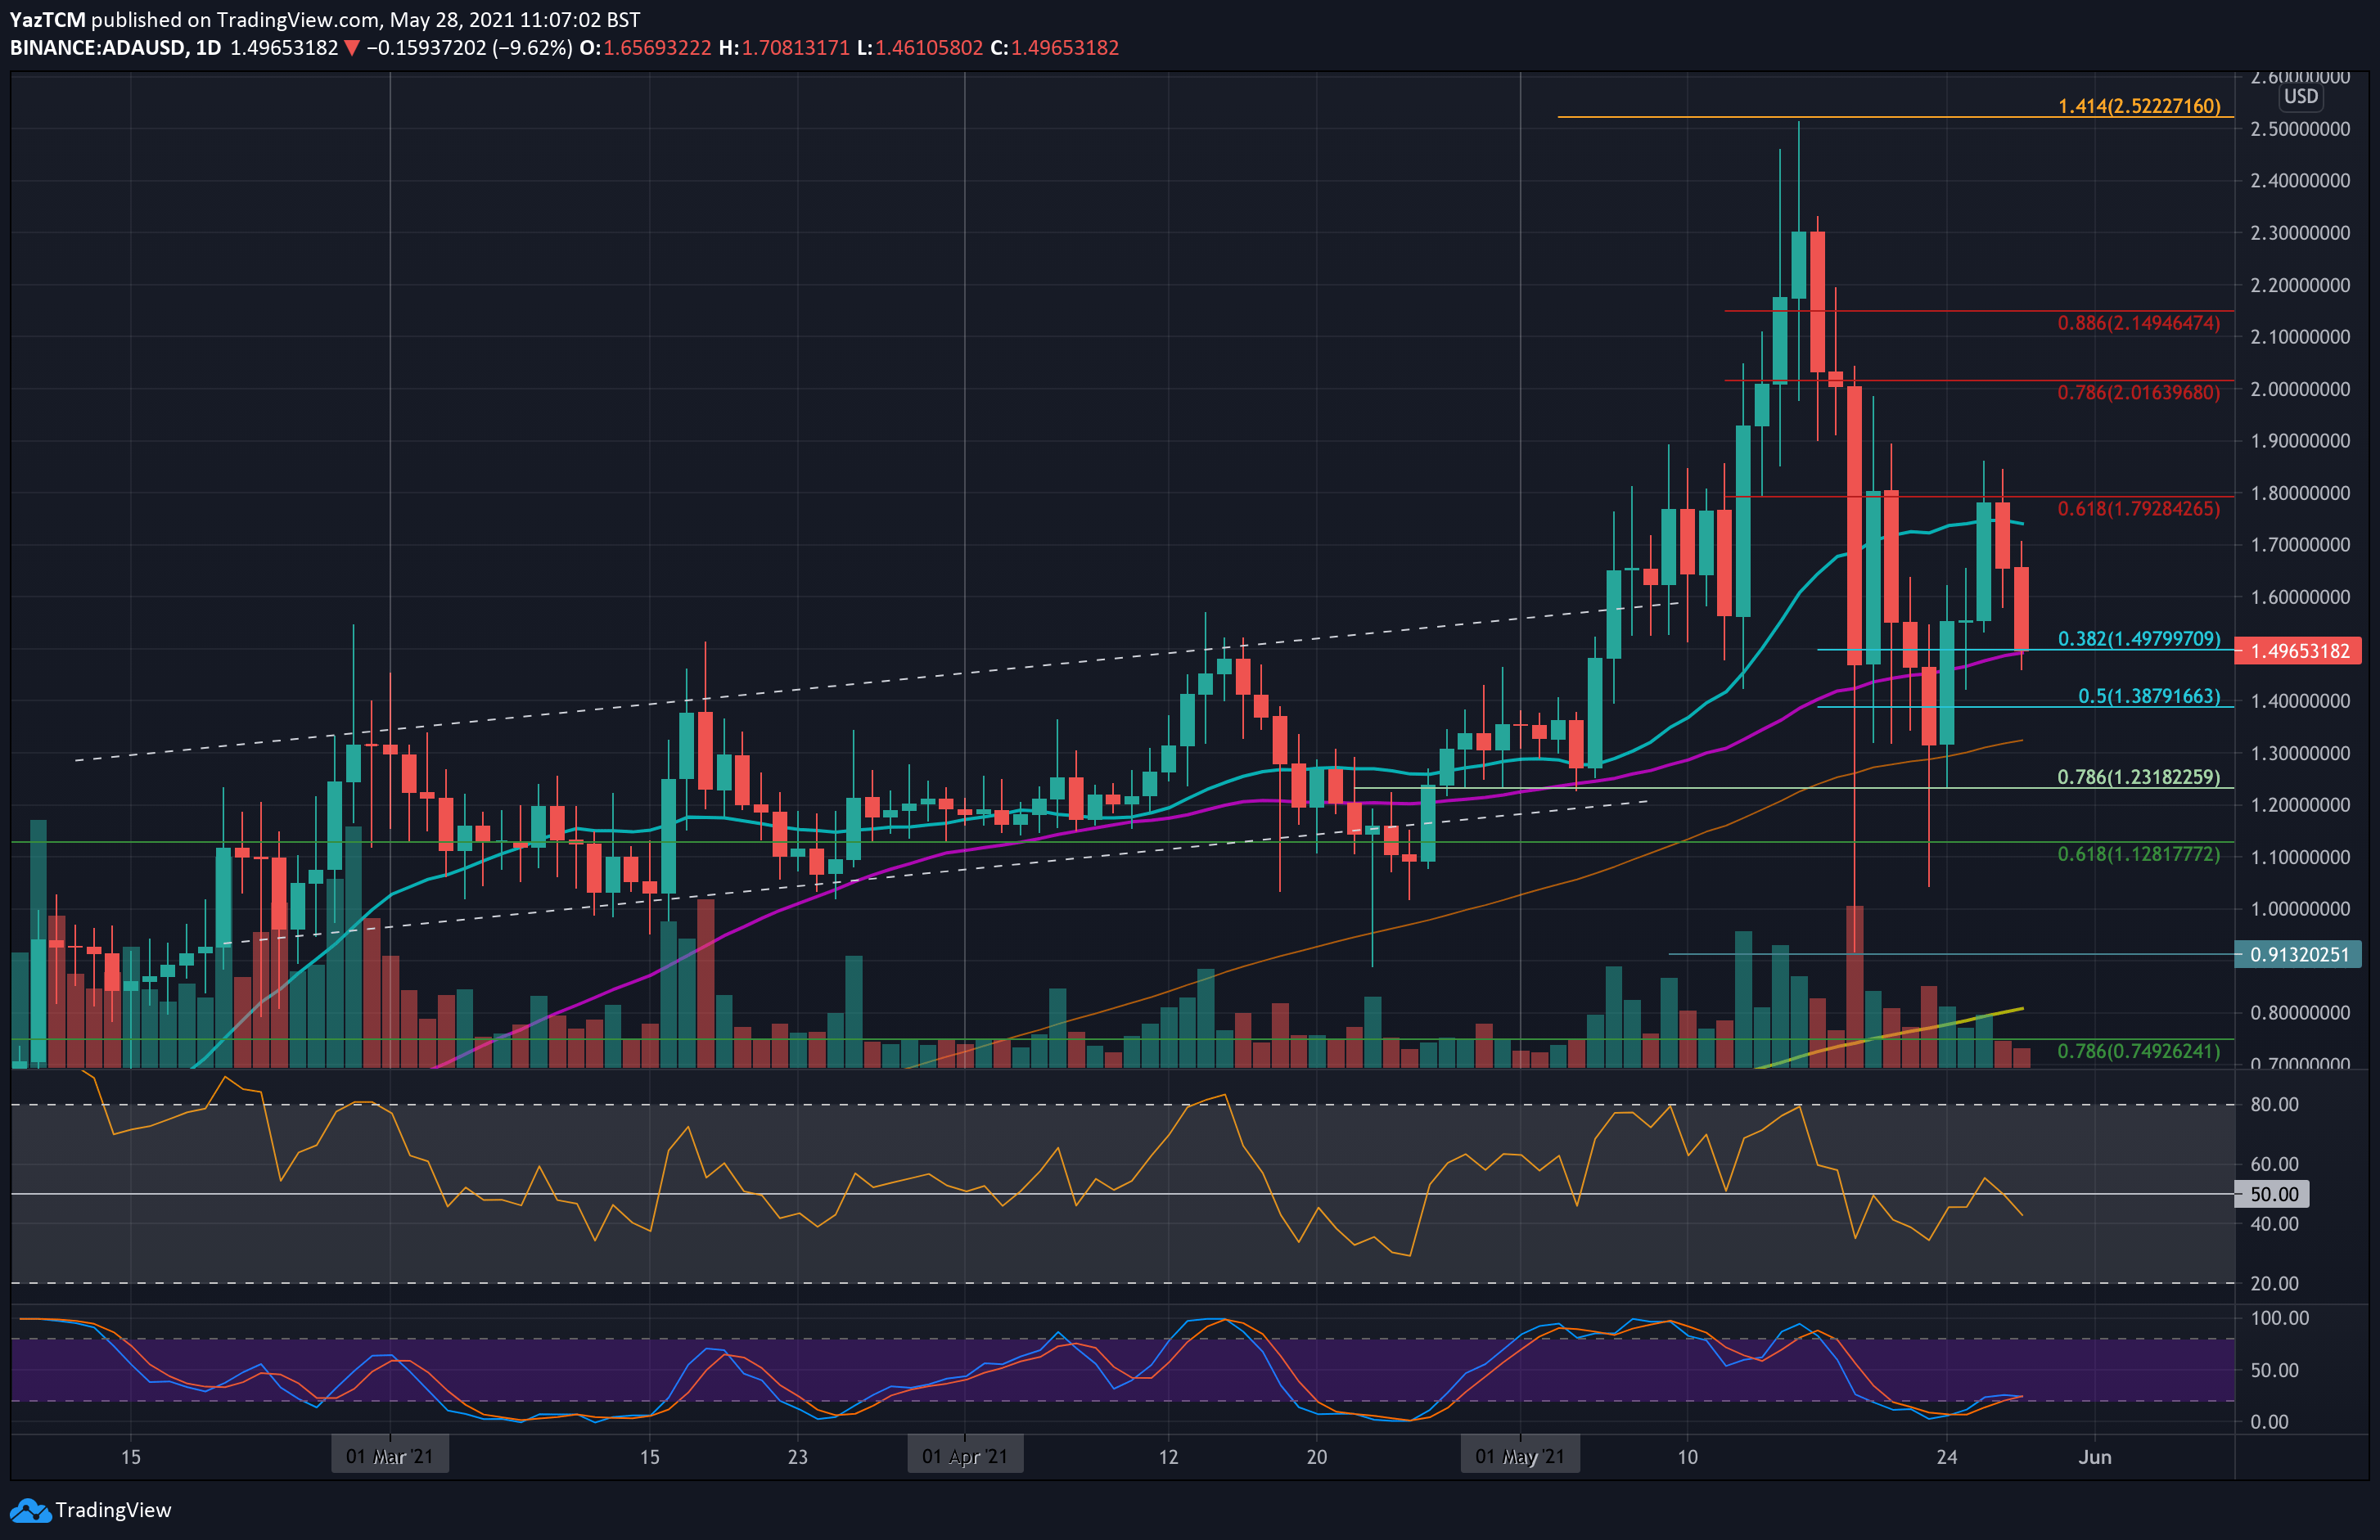
ADA saw a 15.3% price fall over the previous week as it currently trades at $1.50. The coin rebounded from the support at $1.23 (.786 Fib) on Monday. More specifically, it opened Monday’s daily candle at $1.30, which is supported by the 100-day MA.
From there, ADA started to surge throughout the week until resistance was found at $1.80 (bearish .618 Fib) on Wednesday. It rolled over from there to meet $1.50 today, which is supported by the 50-day MA and a .382 Fib.
Looking ahead, if the bears break $1.50, the first support lies at $1.39 (.5 Fib). This is followed by $1.31 (100-day MA), $1.23 (.786 Fib), $1.10, and $1.00.
On the other side, the first resistance lies at $1.60. This is followed by $1.80 (bearish .618 Fib), $2.00 (bearish .786 Fib), and $2.15 (bearish .886 Fib).
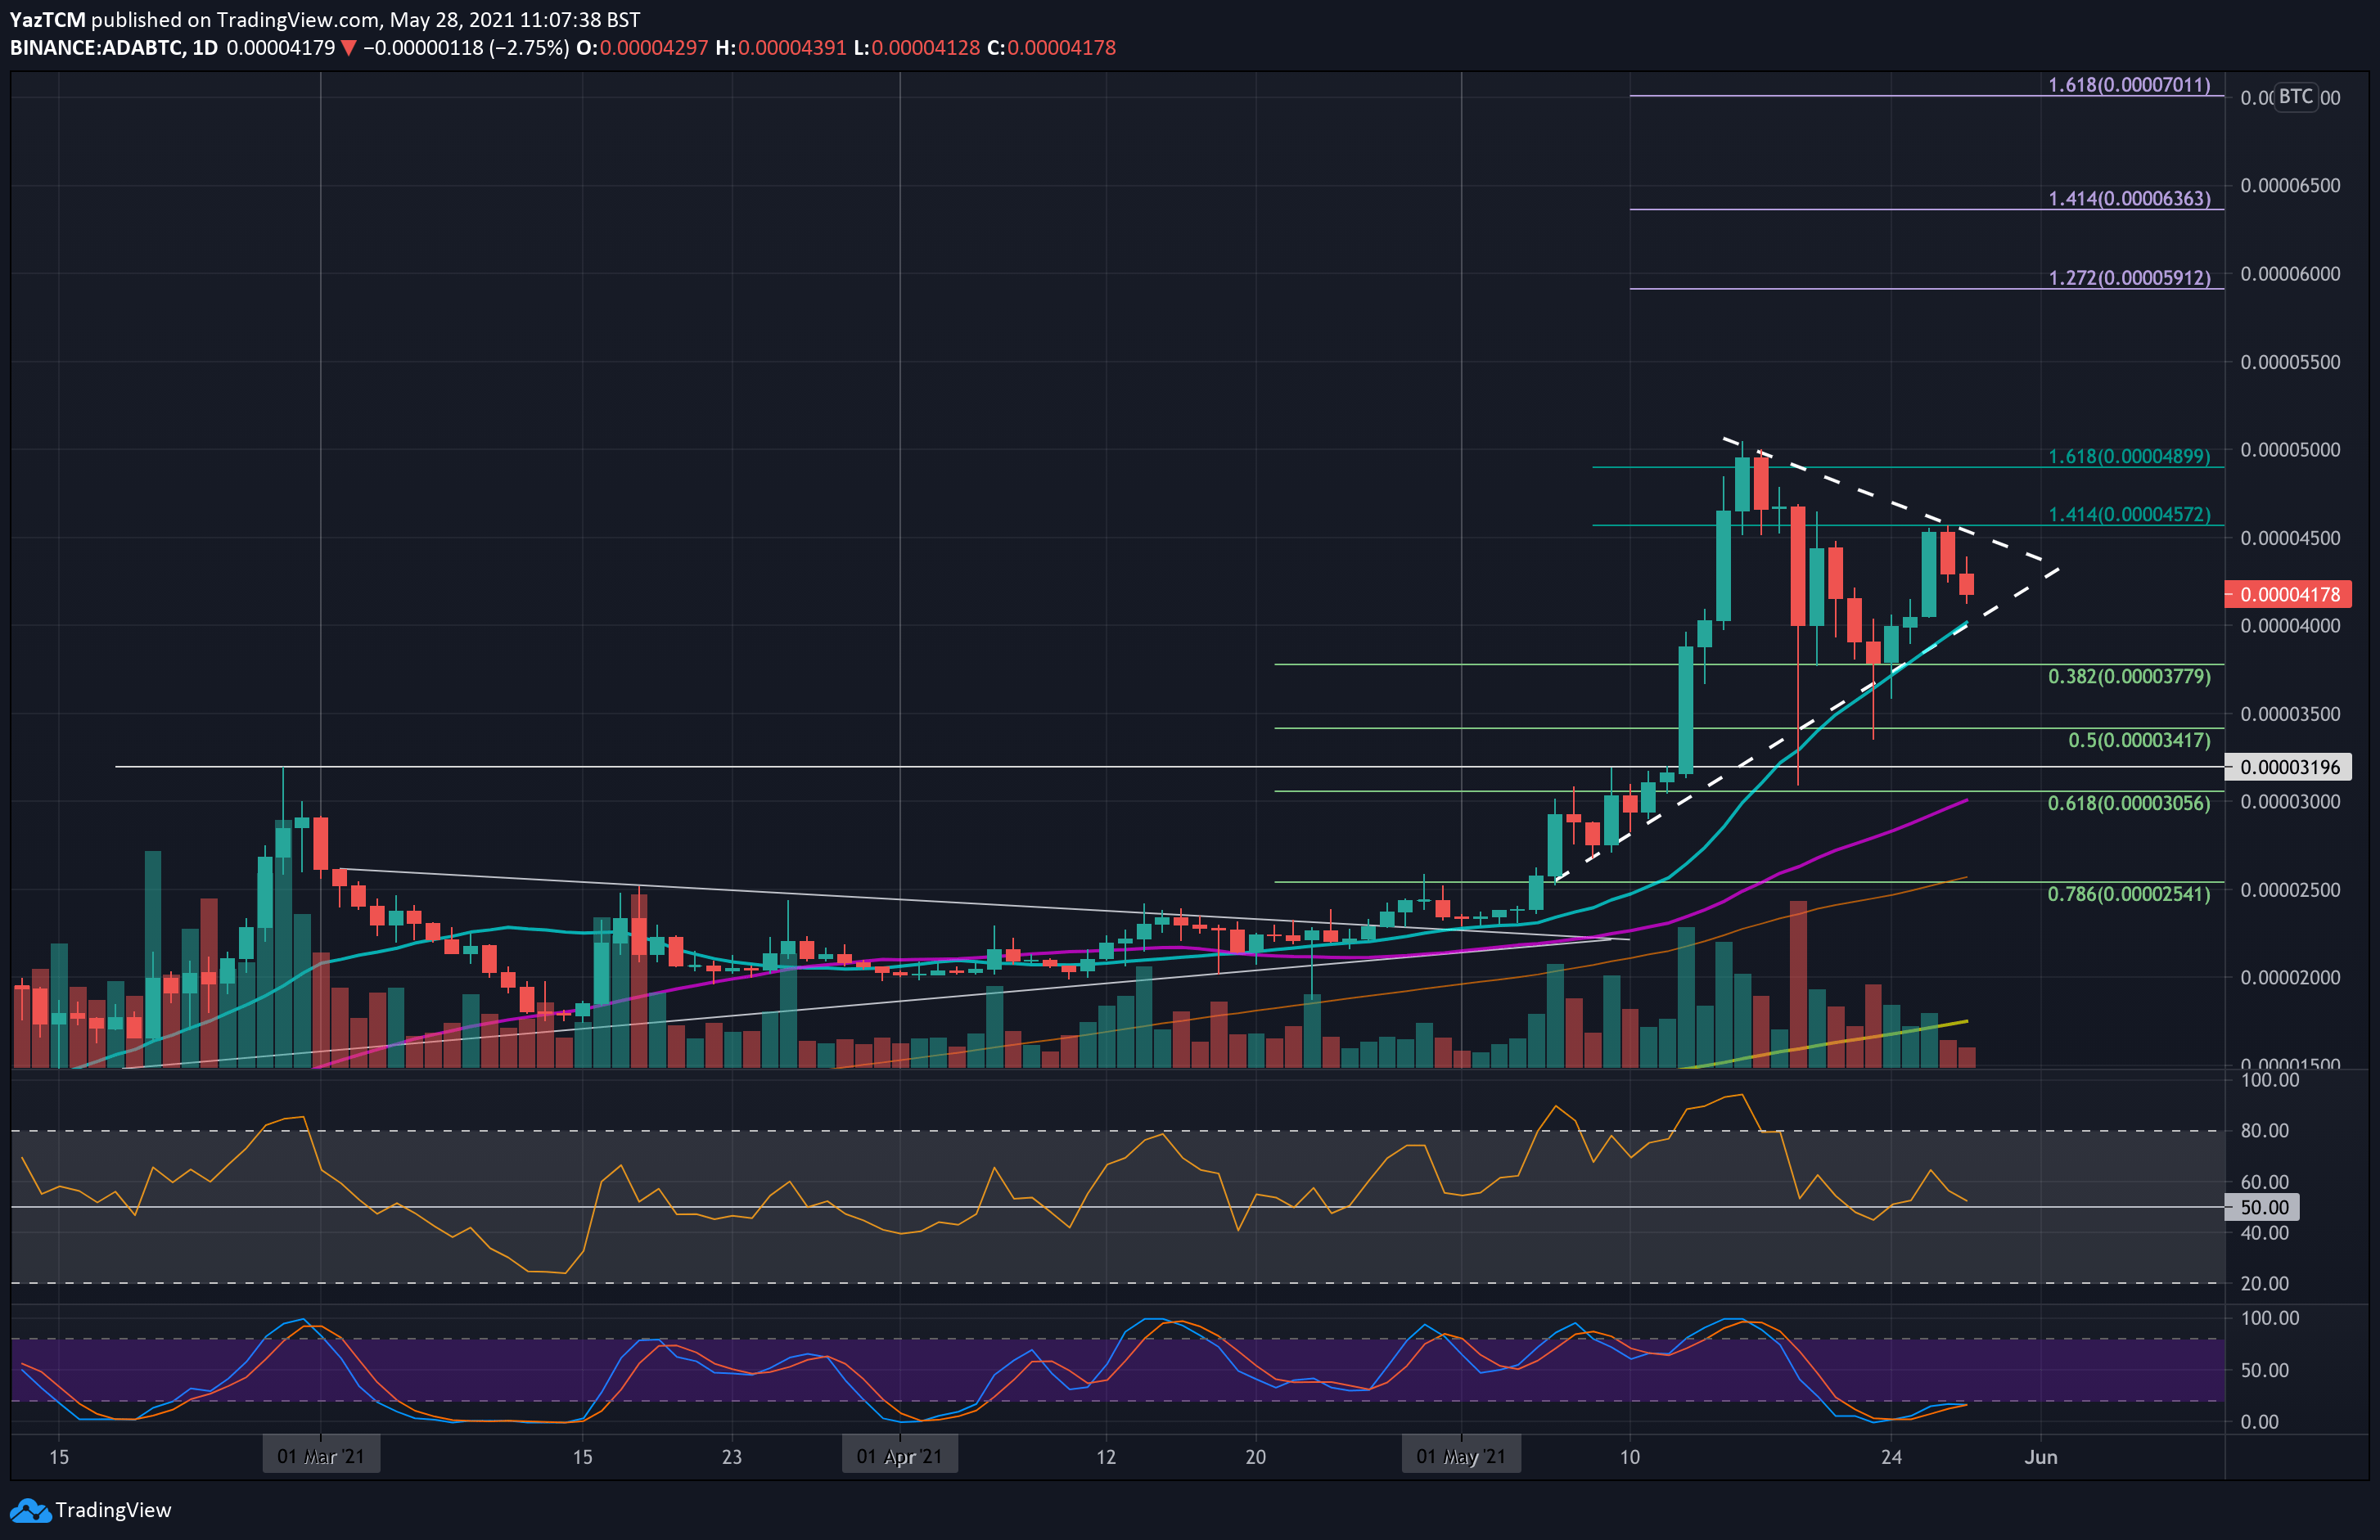
Cardano is trading inside a tight symmetrical triangle against BTC. The coin found support at 3780 SAT (.382 Fib) on Sunday and started to rebound. By Wednesday, ADA reached as high as 4570 SAT (1.414 Fib Extension & upper angle of the triangle).
It was unable to overcome this resistance and has since dropped to 4178 SAT.
Moving forward, the first support lies at 4000 SAT (lower boundary of the triangle). This is followed by 3780 SAT (.382 Fib), 3420 SAT(.5 Fib), 3200 SAT, and 3056 SAT(.618 Fib & 50-day MA).
On the other side, the first resistance lies at 4572 SAT (1.414 Fib Extension & upper angle of triangle). This is followed by 4900 SAT (1.618 Fib Extension), 5000 SAT, 5500 SAT, and 5900 SAT (1.272 Fib Extension).
Polygon
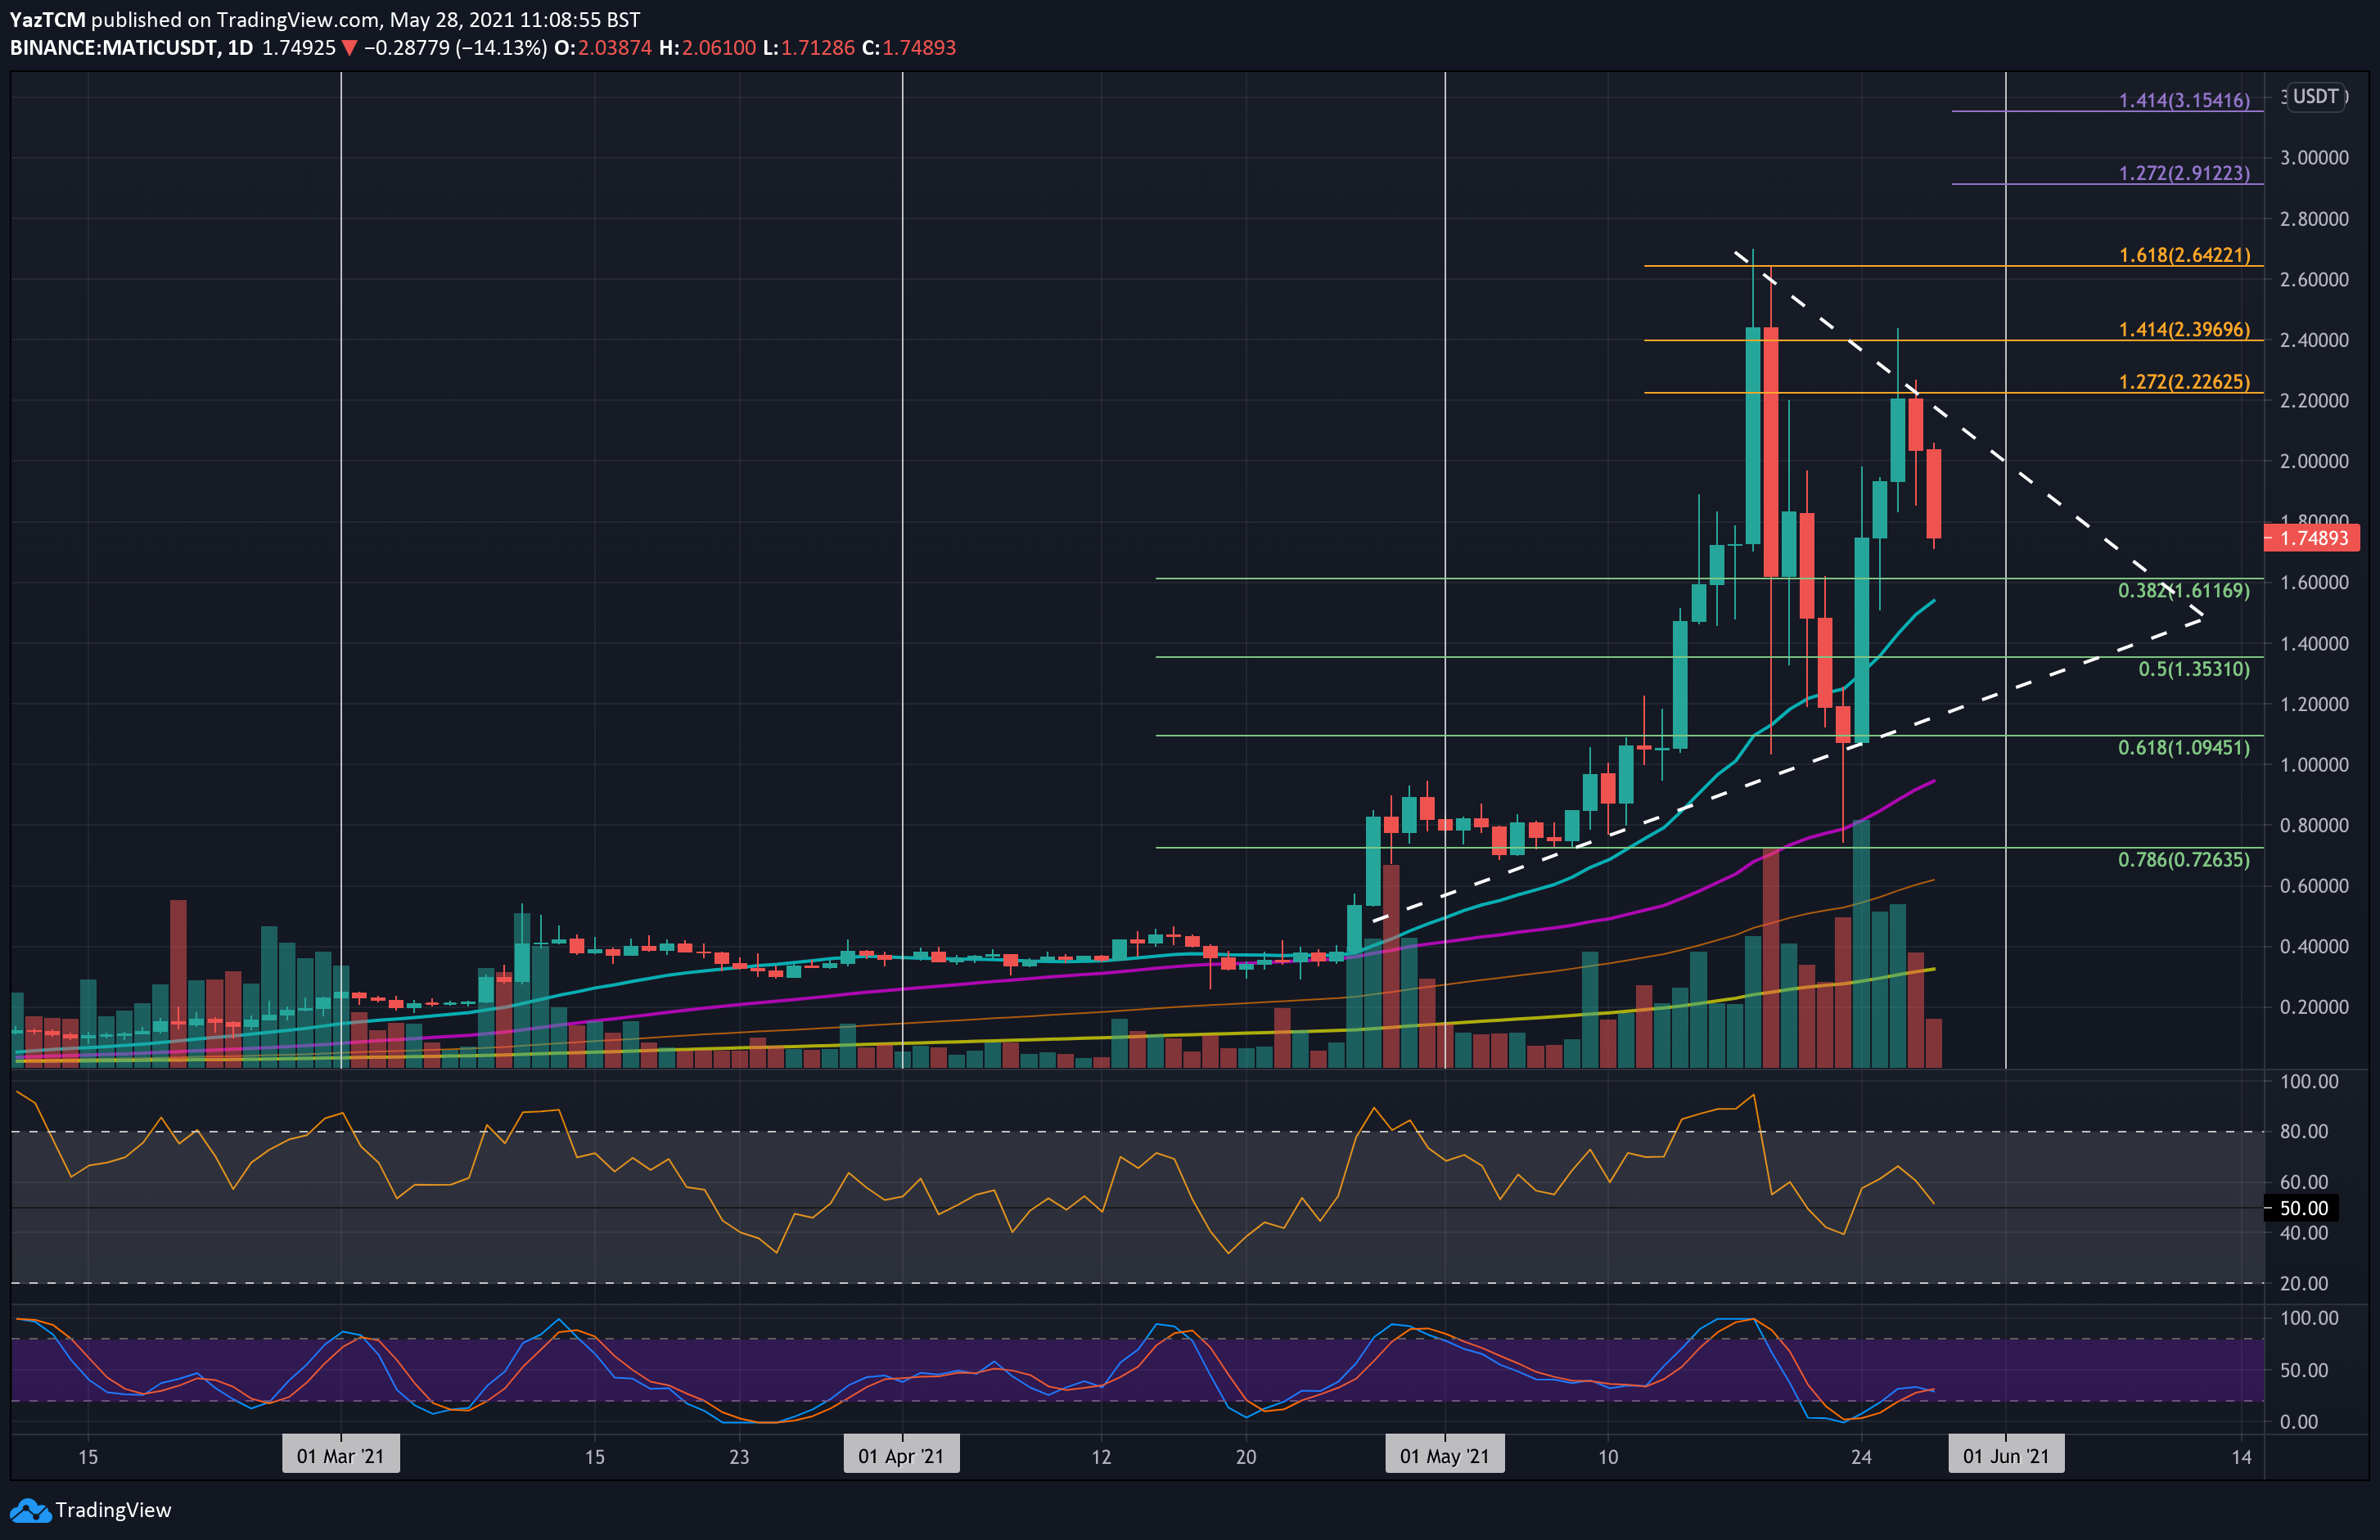
MATIC is only down by a small 1.5% over the week but saw a sharp 18% price fall today as it trades at $1.75. The cryptocurrency has performed well in a bearish market during May as it trades inside a short-term triangle.
The coin found support at $1.10 (lower boundary of the triangle) on Sunday and started to rebound. By Wednesday, MATIC reached resistance at $2.22 (1.272 Fib Extension & upper angle of triangle) and could not break above the resistance. It has since rolled over from there and is now trading at $1.75.
Looking ahead, the first support lies at $1.61 (.382 Fib). This is followed by $1.35 (.5 Fib), $1.20 (lower boundary of triangle), $1.10 (.618 Fib), and $1.00.
On the other side, the first strong resistance lies at $2.00 (upper boundary of the triangle). This is followed by $2.22 (1.272 Fib Extension), $2.40 (1.414 Fib Extension), $2.65 (1.618 Fib Extension), and $2.80.
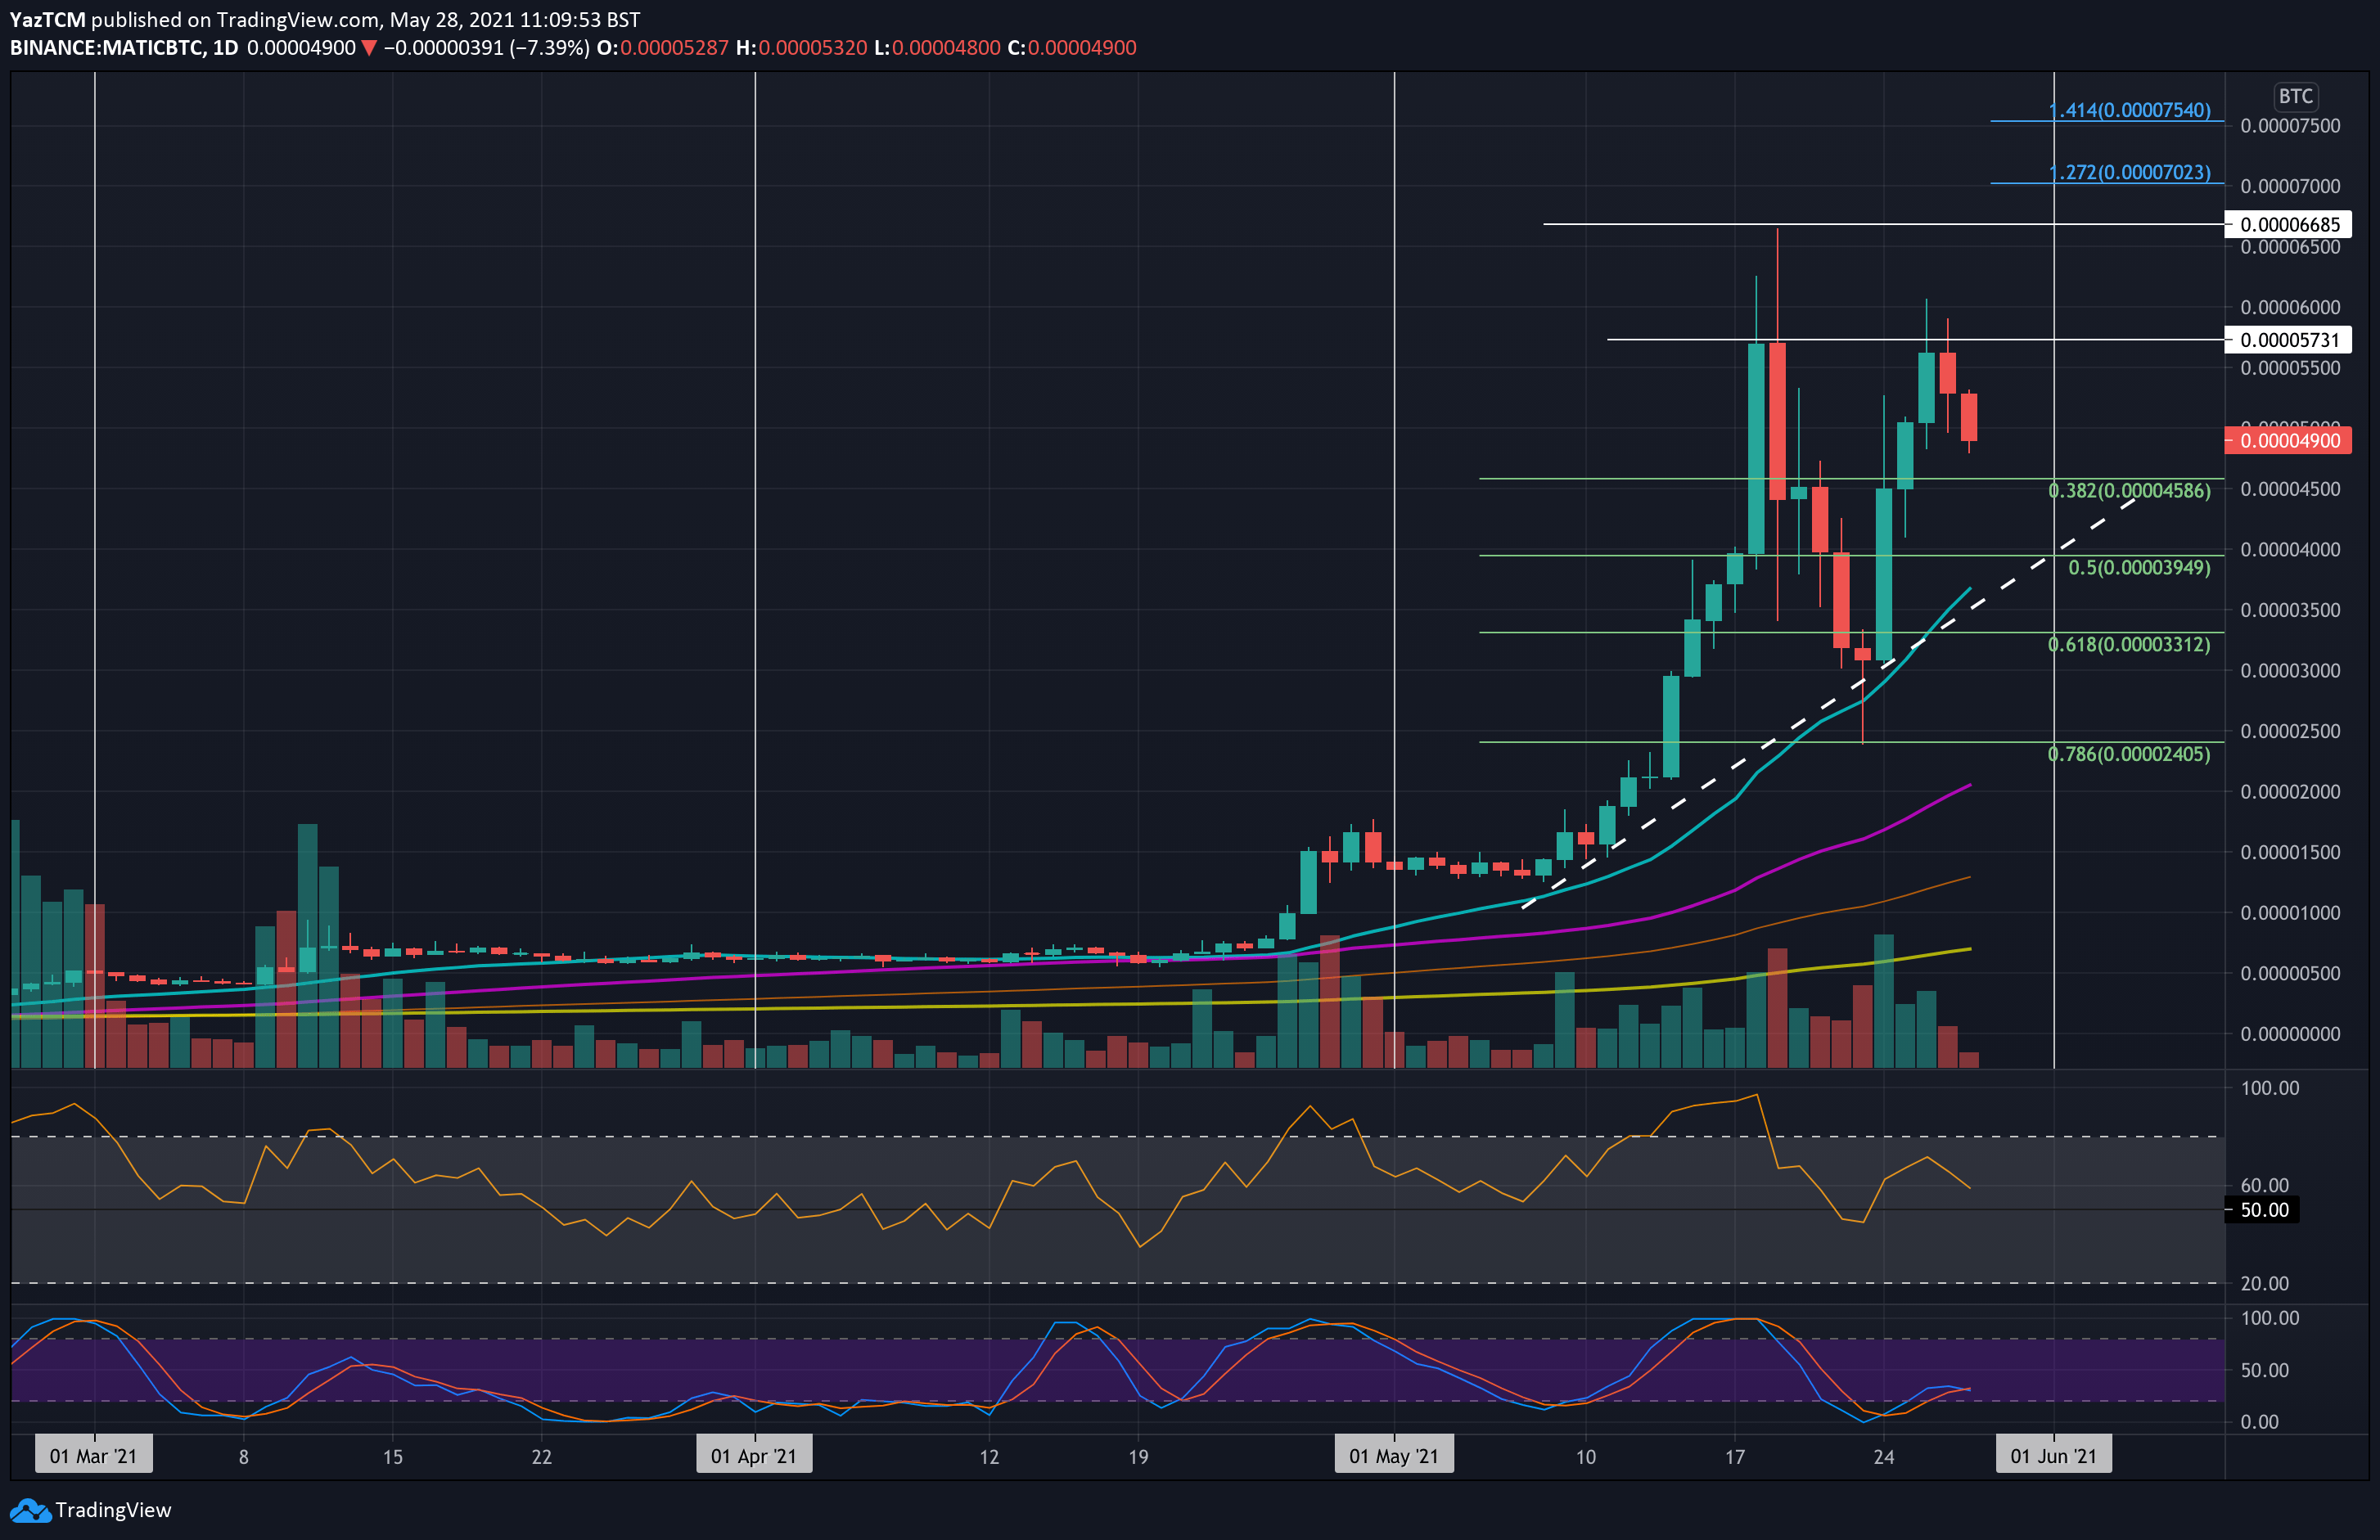
MATIC is also performing very well against BTC this week as it currently trades at 4900 SAT. The coin rebounded from the support at 3000 SAT on Sunday. It had spiked as low as 2400 SAT (.786 Fib) but managed to close the daily candle above 3000 SAT.
Fro, there, MATIC surged during the week to meet resistance at 5730 SAT on Wednesday, which is the high-day closing price for MATIC. It has since rolled over from there to trade at the current 4900 SAT level.
Moving forward, the first level of support lies at 4585 SAT (.382 Fib). This is followed by 4000 SAT (.5 Fib), 3500 SAT, 3312 SAT (.618 Fib), and 3000 SAT.
On the other side, the first resistance lies at 5000 SAT. This is followed by 5730 SAT (high-day closing price), 6000 SAT, 6685 SAT, and 7000 SAT (1.272 Fib Extension).
