Crypto Price Analysis & Overview May 21st: Bitcoin, Ethereum, Ripple, Binance Coin, and Polkadot
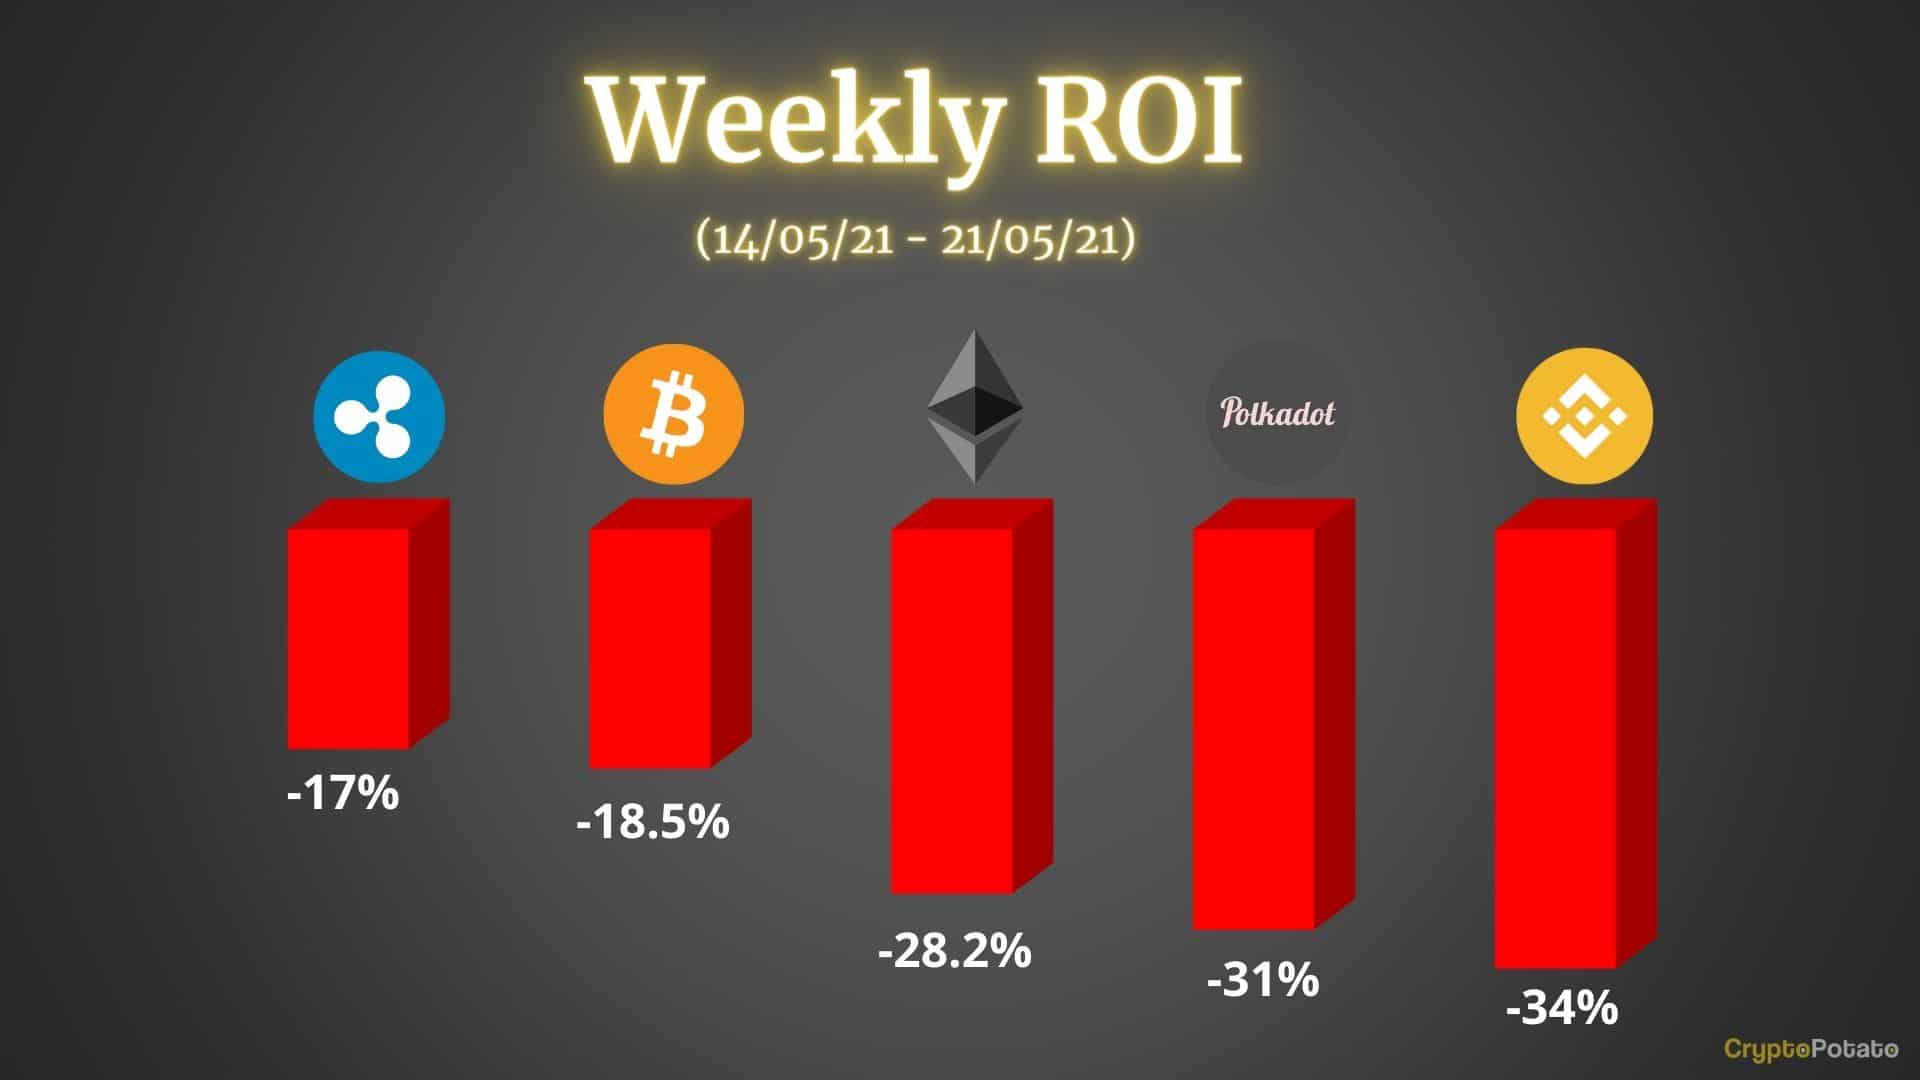
The past seven days were particularly volatile and, unfortunately for many, bears had the upper hand. Bitcoin dropped to a price not seen since January, while the rest of the market followed.
Bitcoin
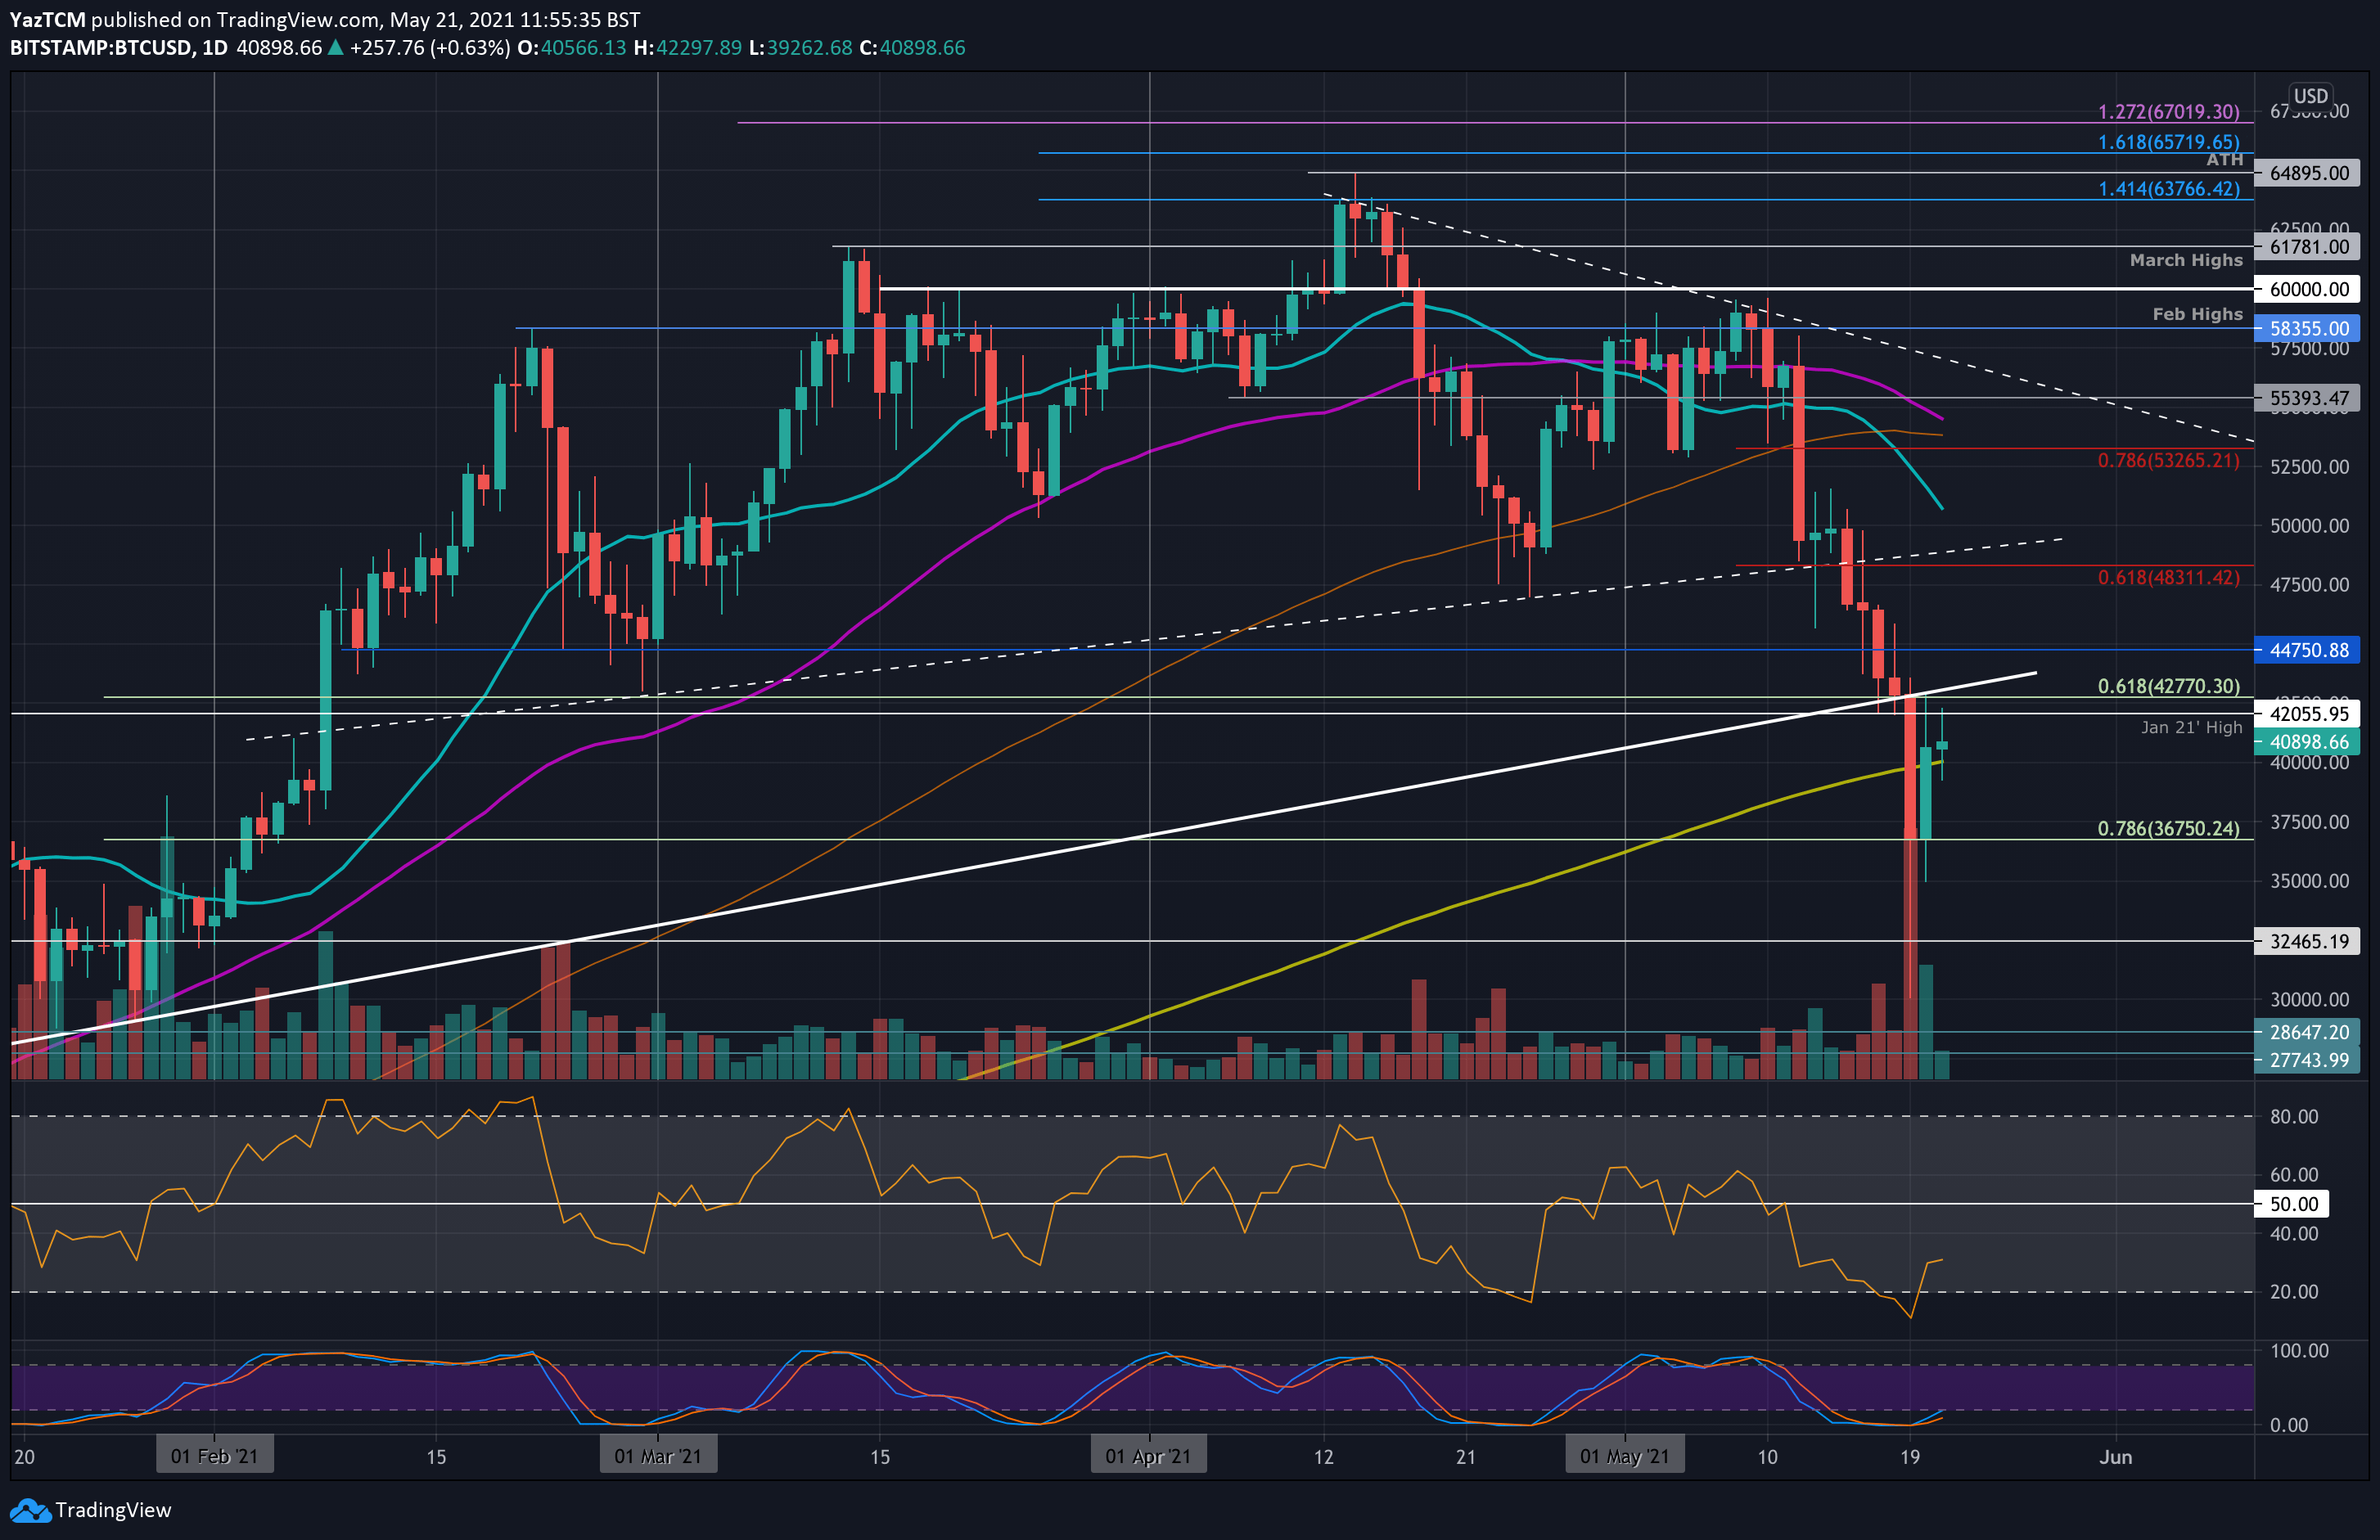
Bitcoin is down another 18.5% this week as it trades near $40,900. The cryptocurrency is now down by a total of around 35% from the $64,895 all-time high set in April. BTC saw an extremely volatile week in which prices dropped as low as $30,000 on Wednesday – hitting levels not seen since January 2021.
The coin had slipped beneath $50,000 last week and continued lower over the weekend. By Tuesday, BTC had dropped as low as $42,770 – where it found support at a .618 Fib. On Wednesday, the market saw a huge sell-off as BTC plummetted as low as $30,000. By the end of the day, the candle closed at $36,750 (.786 Fib).
It has since bounced higher from there and pushed back above the 200-day MA yesterday as it now tackled resistance at $42,000 (Jan 21 highs).
Looking ahead, if the bulls can break $42,000, the first strong resistance lies at $4,750. This is followed by $48,310 (bearish .618 Fib), $50,000, and $53,265 (bearish .786 Fib).
On the other side, the first support lies at $40,000 (200-day MA). This is followed by $36,750 (.786 Fib), $35,000, $32,465, and $30,000.
Ethereum
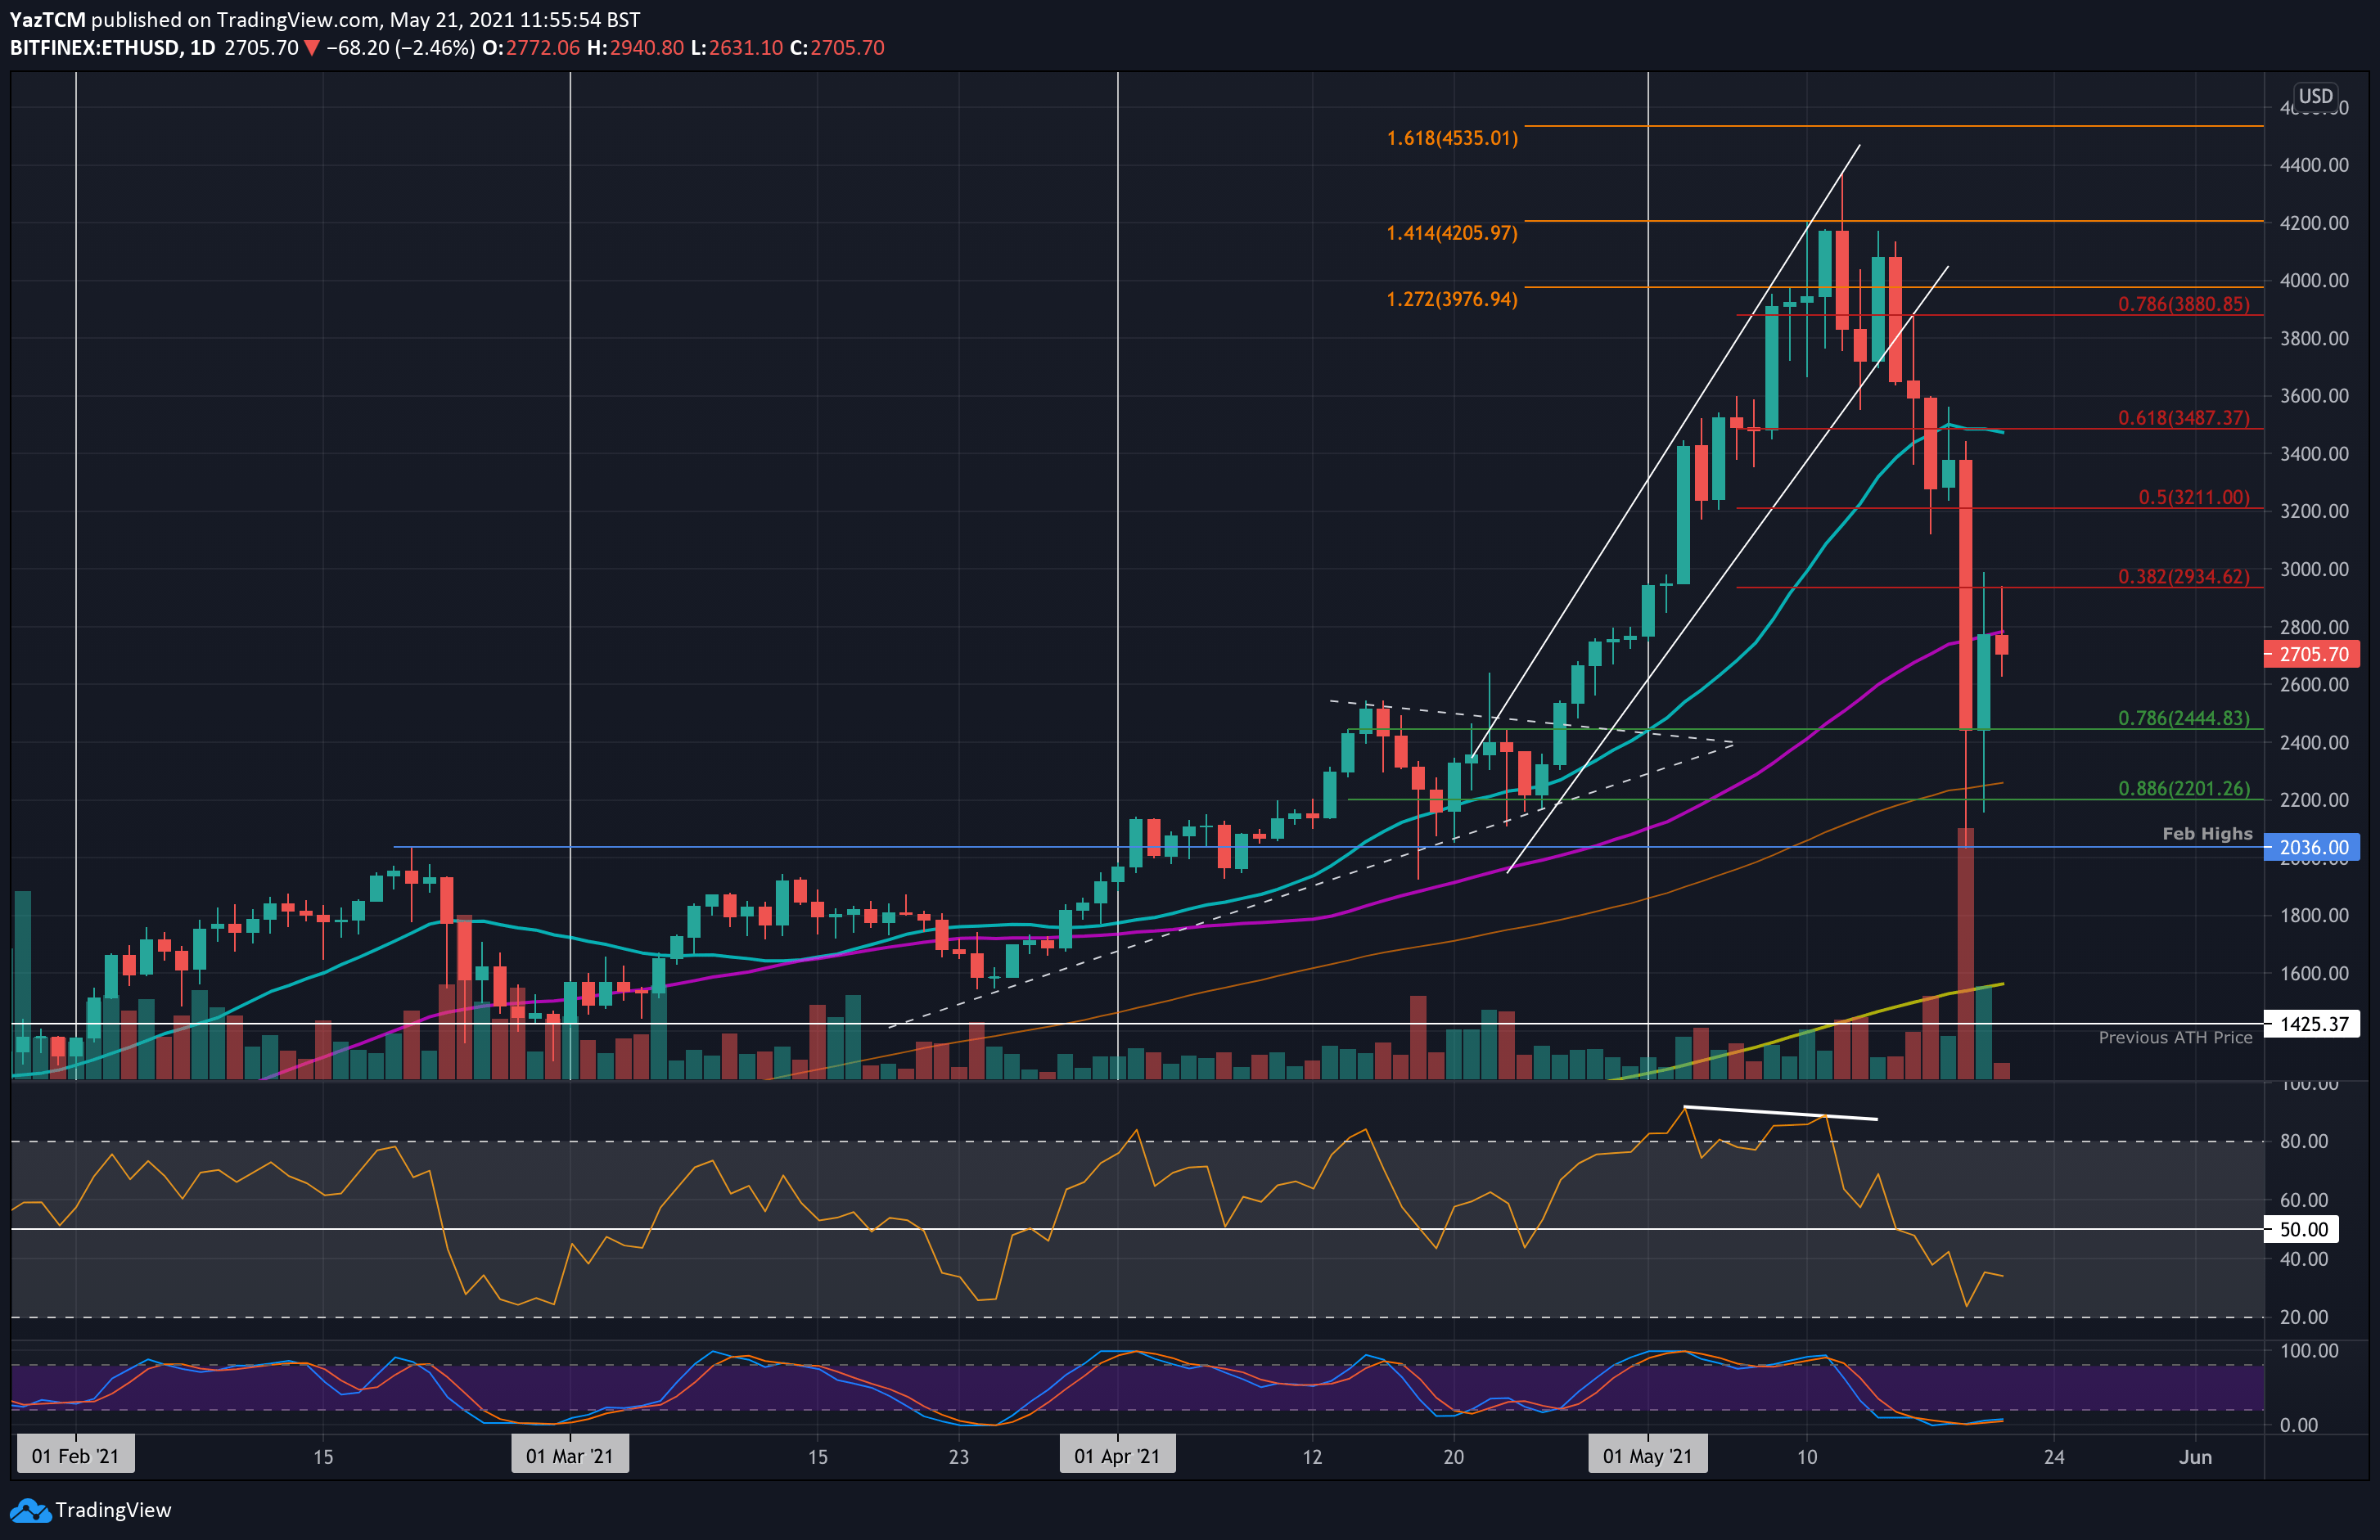
Ethereum dropped by a further 28.2% this week as the coin currently sits at around $2700. It had set a new ATH above $4200 earlier in the month but started to head lower from there.
Over the weekend, ETH fell beneath a rising price channel that it was trading within and continued beneath the 20-day EMA at the start of the week. During the market capitulation on Wednesday, ETH fell from $3400 to drop as low as $2035 (Feb 2021 highs). It bounced from there to close the daily candle at the $2445 (.786 Fib support).
ETH has since pushed higher over the past two days but is struggling to break resistance at $3000. More specifically, it is currently in a battle to climb above resistance at $2800, provided by the 50-day MA.
Looking ahead, if the bulls can break the resistance at the 50-day MA, the first obstacle lies at $3000 (bearish .382 Fib). This is followed by $3210 (bearish .5 Fib), $3487 (bearish .618 Fib & 20-day MA), and $3800.
On the other side, the first support lies at $2445 (.786 Fib). Beneath this, support lies at $2200 (.886 Fib & 100-day MA), $2036 (Feb 2021 highs), and $1800.
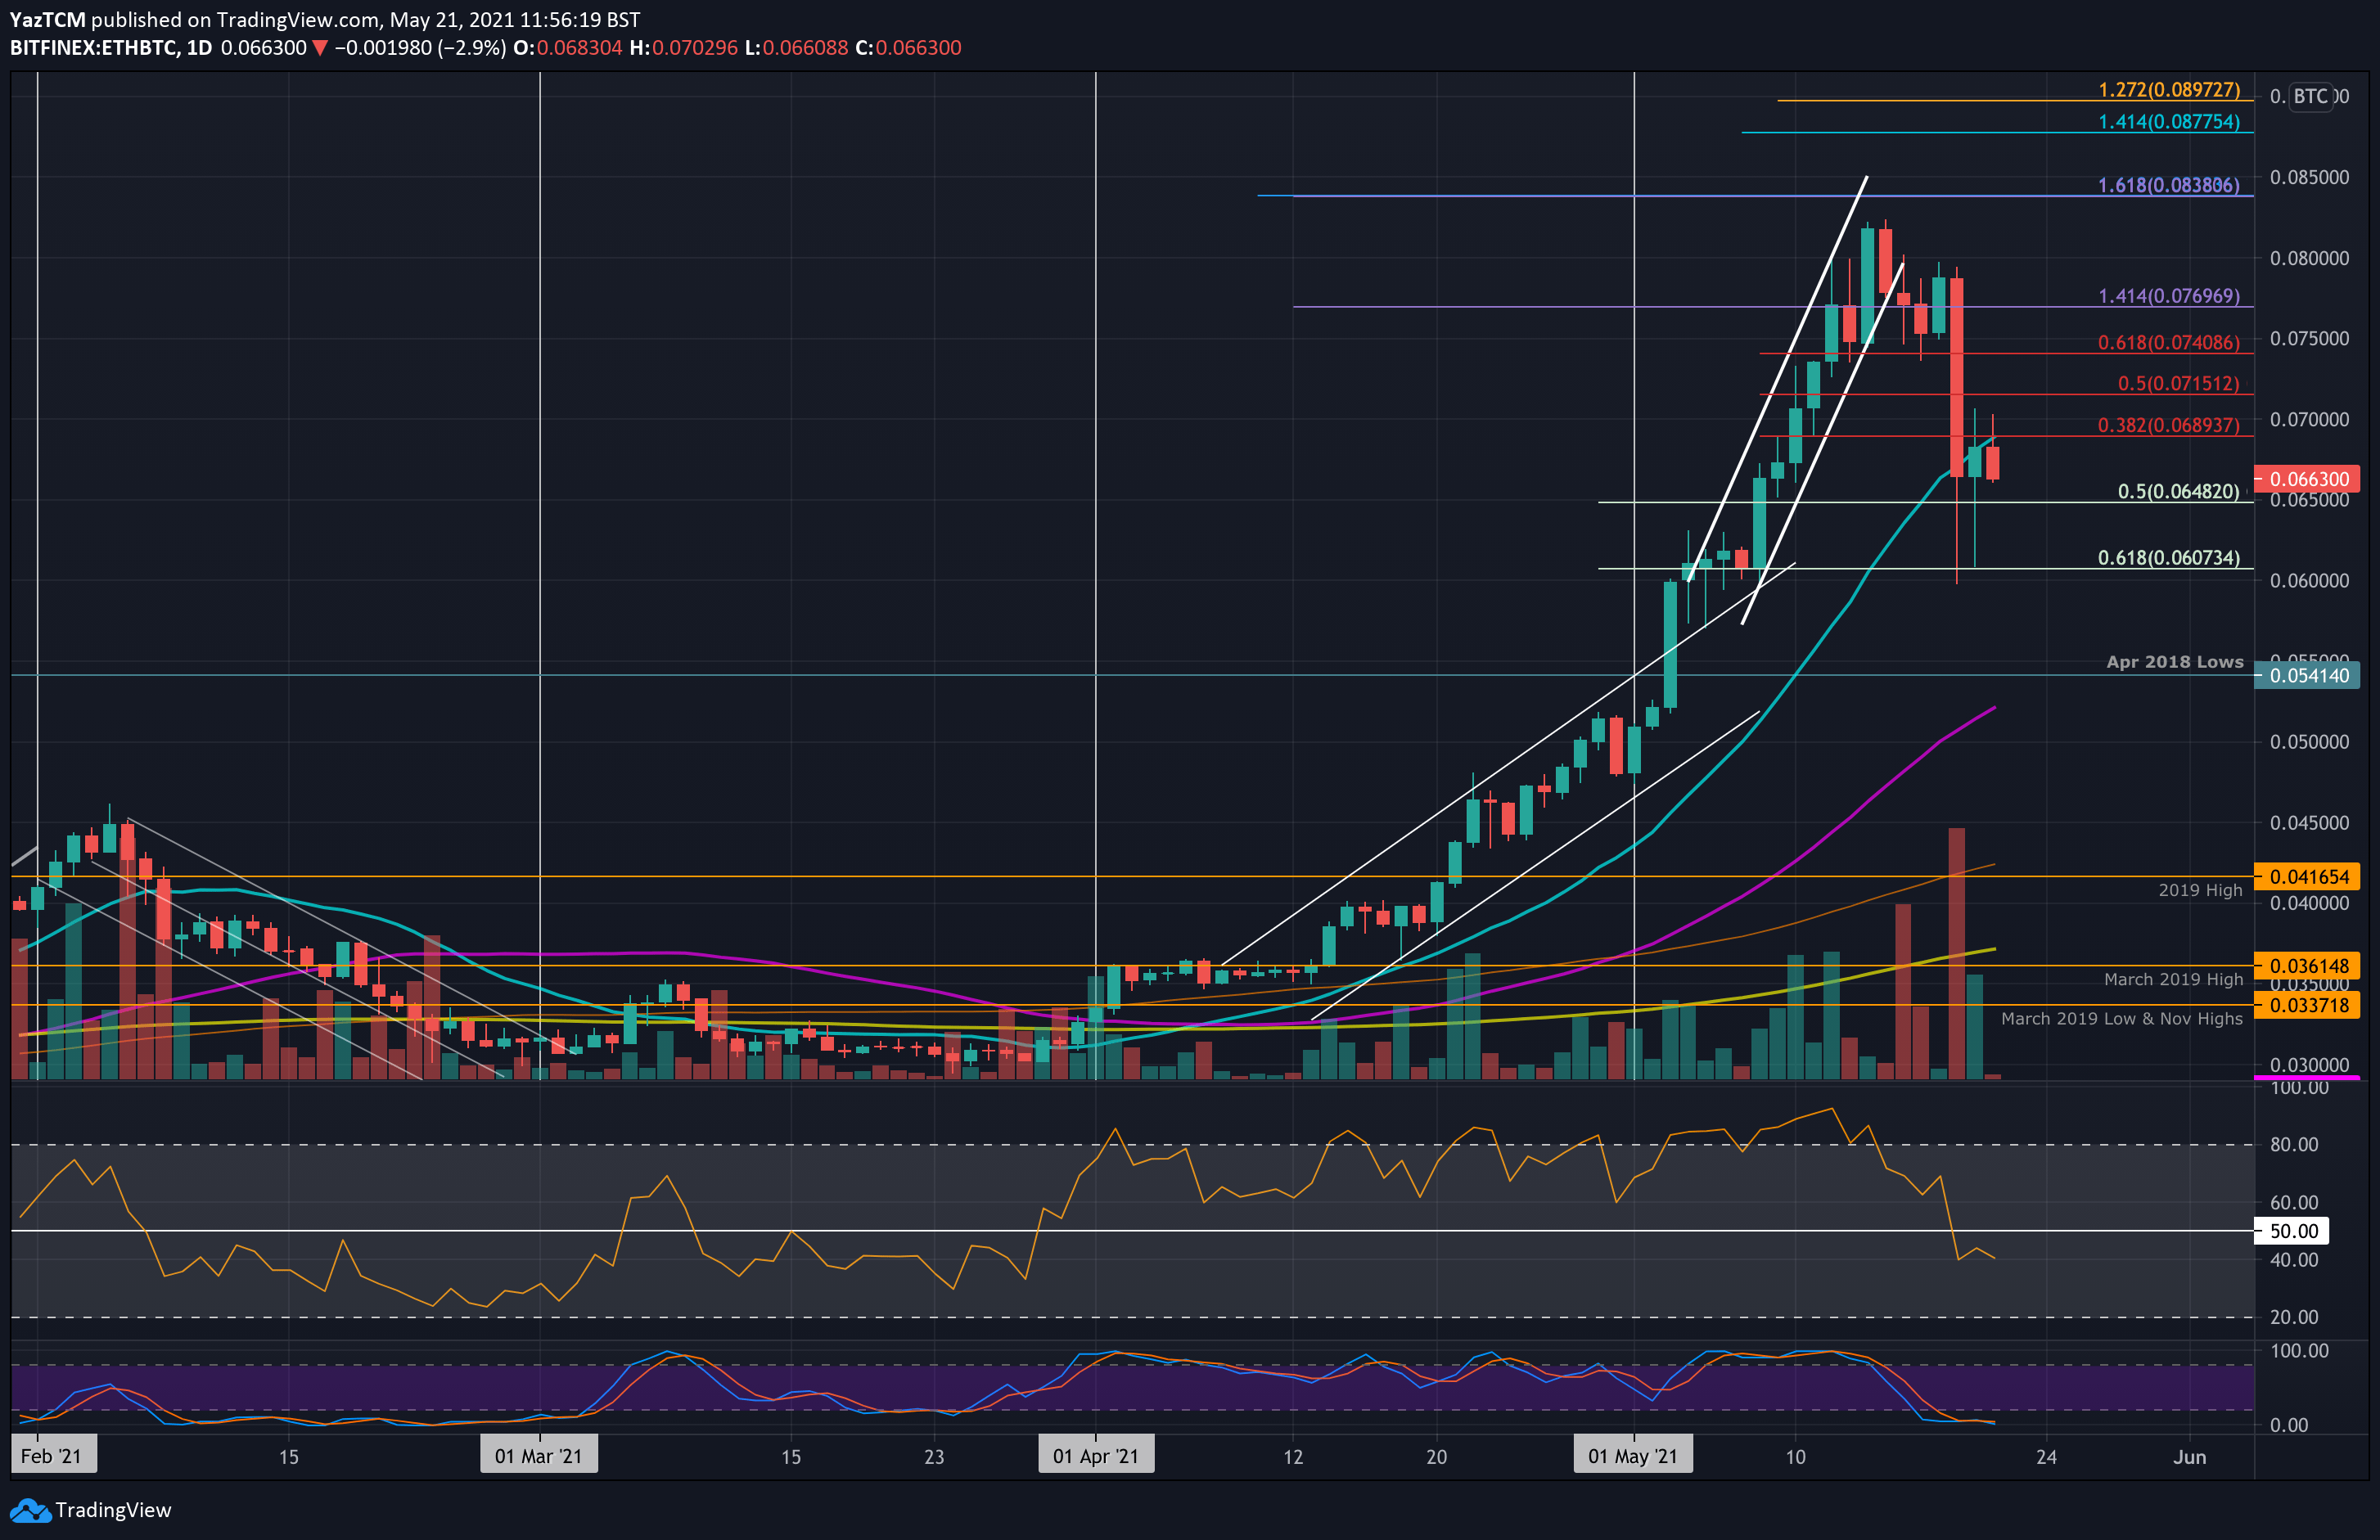
ETH is performing slightly better against BTC but is still looking very bearish. The coin dropped from just beneath 0.08 BTC on Wednesday to reach as low as 0.06 BTC during the day. It did recover to close the daily candle around 0.067 BTC.
Since then, ETH has struggled to gain ground above 0.069 BTC, where lies the 20-day MA. It has since dropped back to 0.0663 BTC.
Moving forward, if the sellers push lower again, the first support lies at 0.0648 BTC (.5 Fib). This is followed by 0.06 BTC (.618 Fib), 0.0541 BTC (April 2018 Lows), 0.052 BTC (50-day MA), and 0.05 BTC.
On the other side, the first strong resistance lies at 0.0689 BTC (bearish .382 Fib & 20-day MA). This is followed by 0.07 BTC, 0.0715 BTC (bearish .5 Fib), 0.074 BTC (bearish .618 Fib), and 0.077 BTC.
Ripple
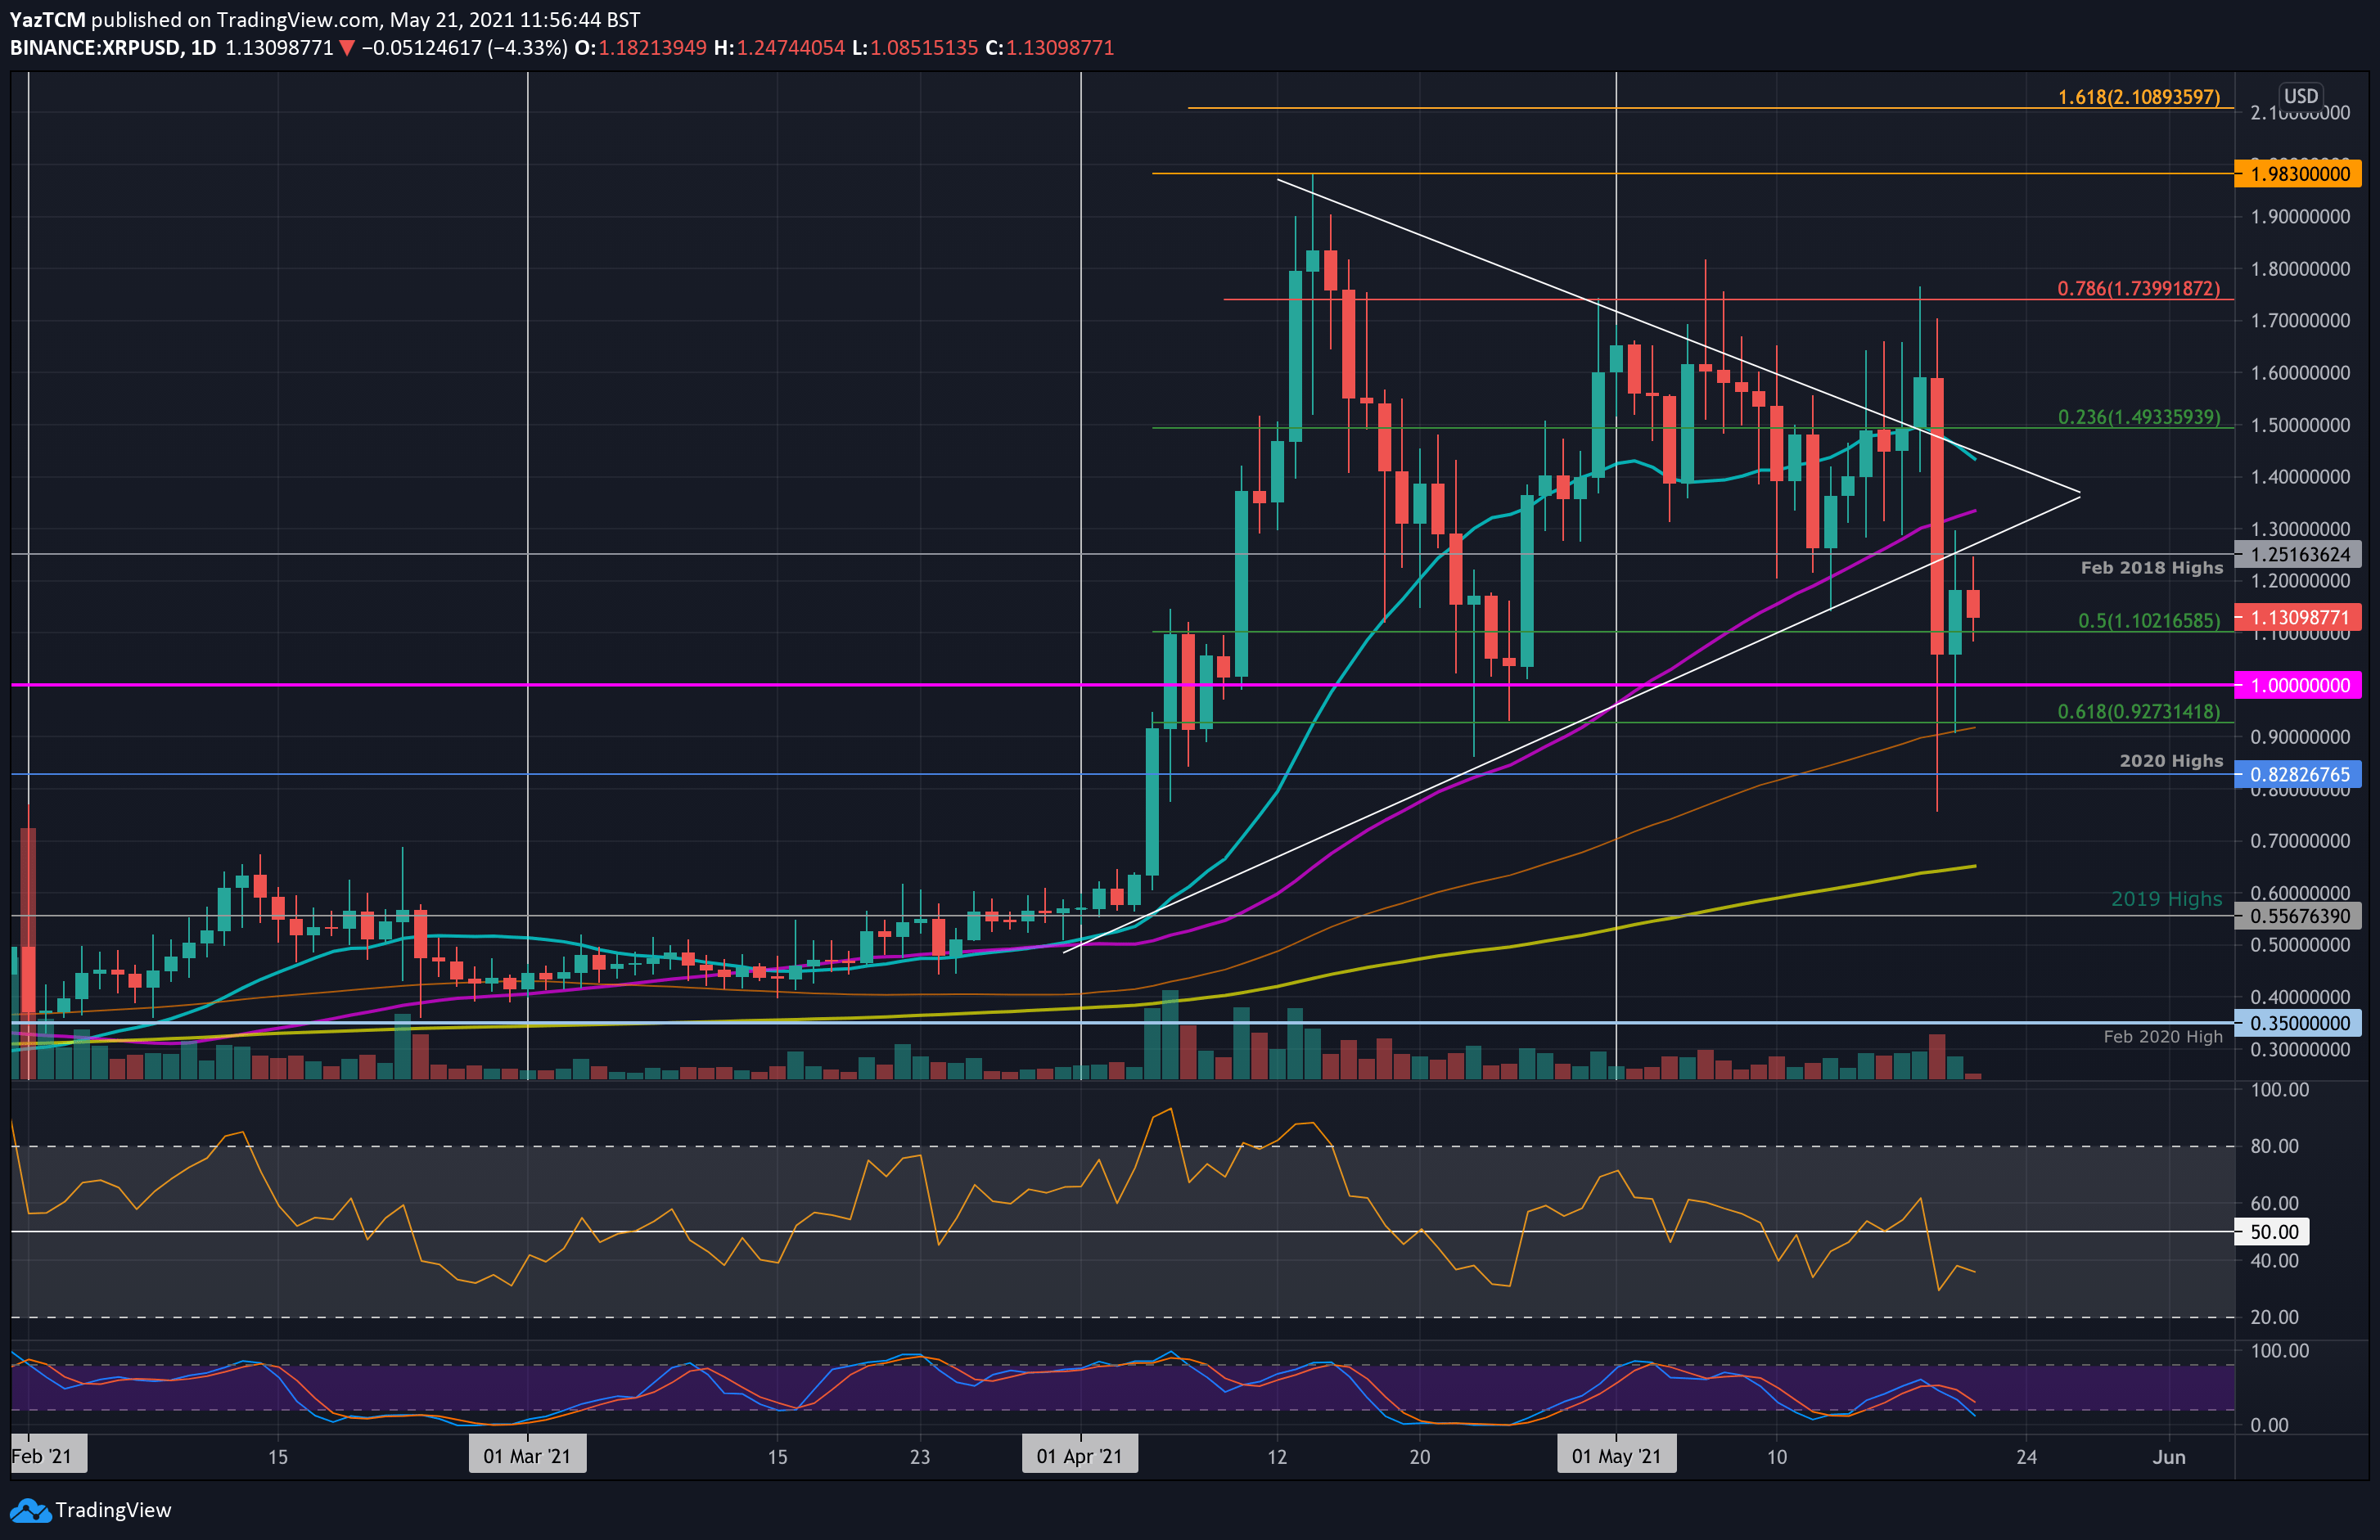
XRP is down a sharp 17% over the past week as the coin now sits at $1.13. The coin broke resistance at $1.50 at the start of the week and pushed higher toward $1.75 as it broke above a symmetrical triangle pattern it was trading within since April.
However, the market capitulation caused XRP to quickly reverse as it collapsed beneath the triangle and reached as low as $0.76. The daily candle on Wednesday did manage to close above $1.00 but XRP has struggled to break resistance at $1.25 (Feb 18 highs) since.
Looking ahead, the first resistance lies at $1.25. This is followed by $1.35 (50-day MA), $1.40 (20-day MA), $1.50, and $1.74 (bearish .786 Fib).
On the other side, the first support lies at $1.10 (.5 Fib). This is followed by $1.00, $0.92 (.618 Fib & 100-day MA), $0.82 (2020 highs), and $0.75 (weekly low).
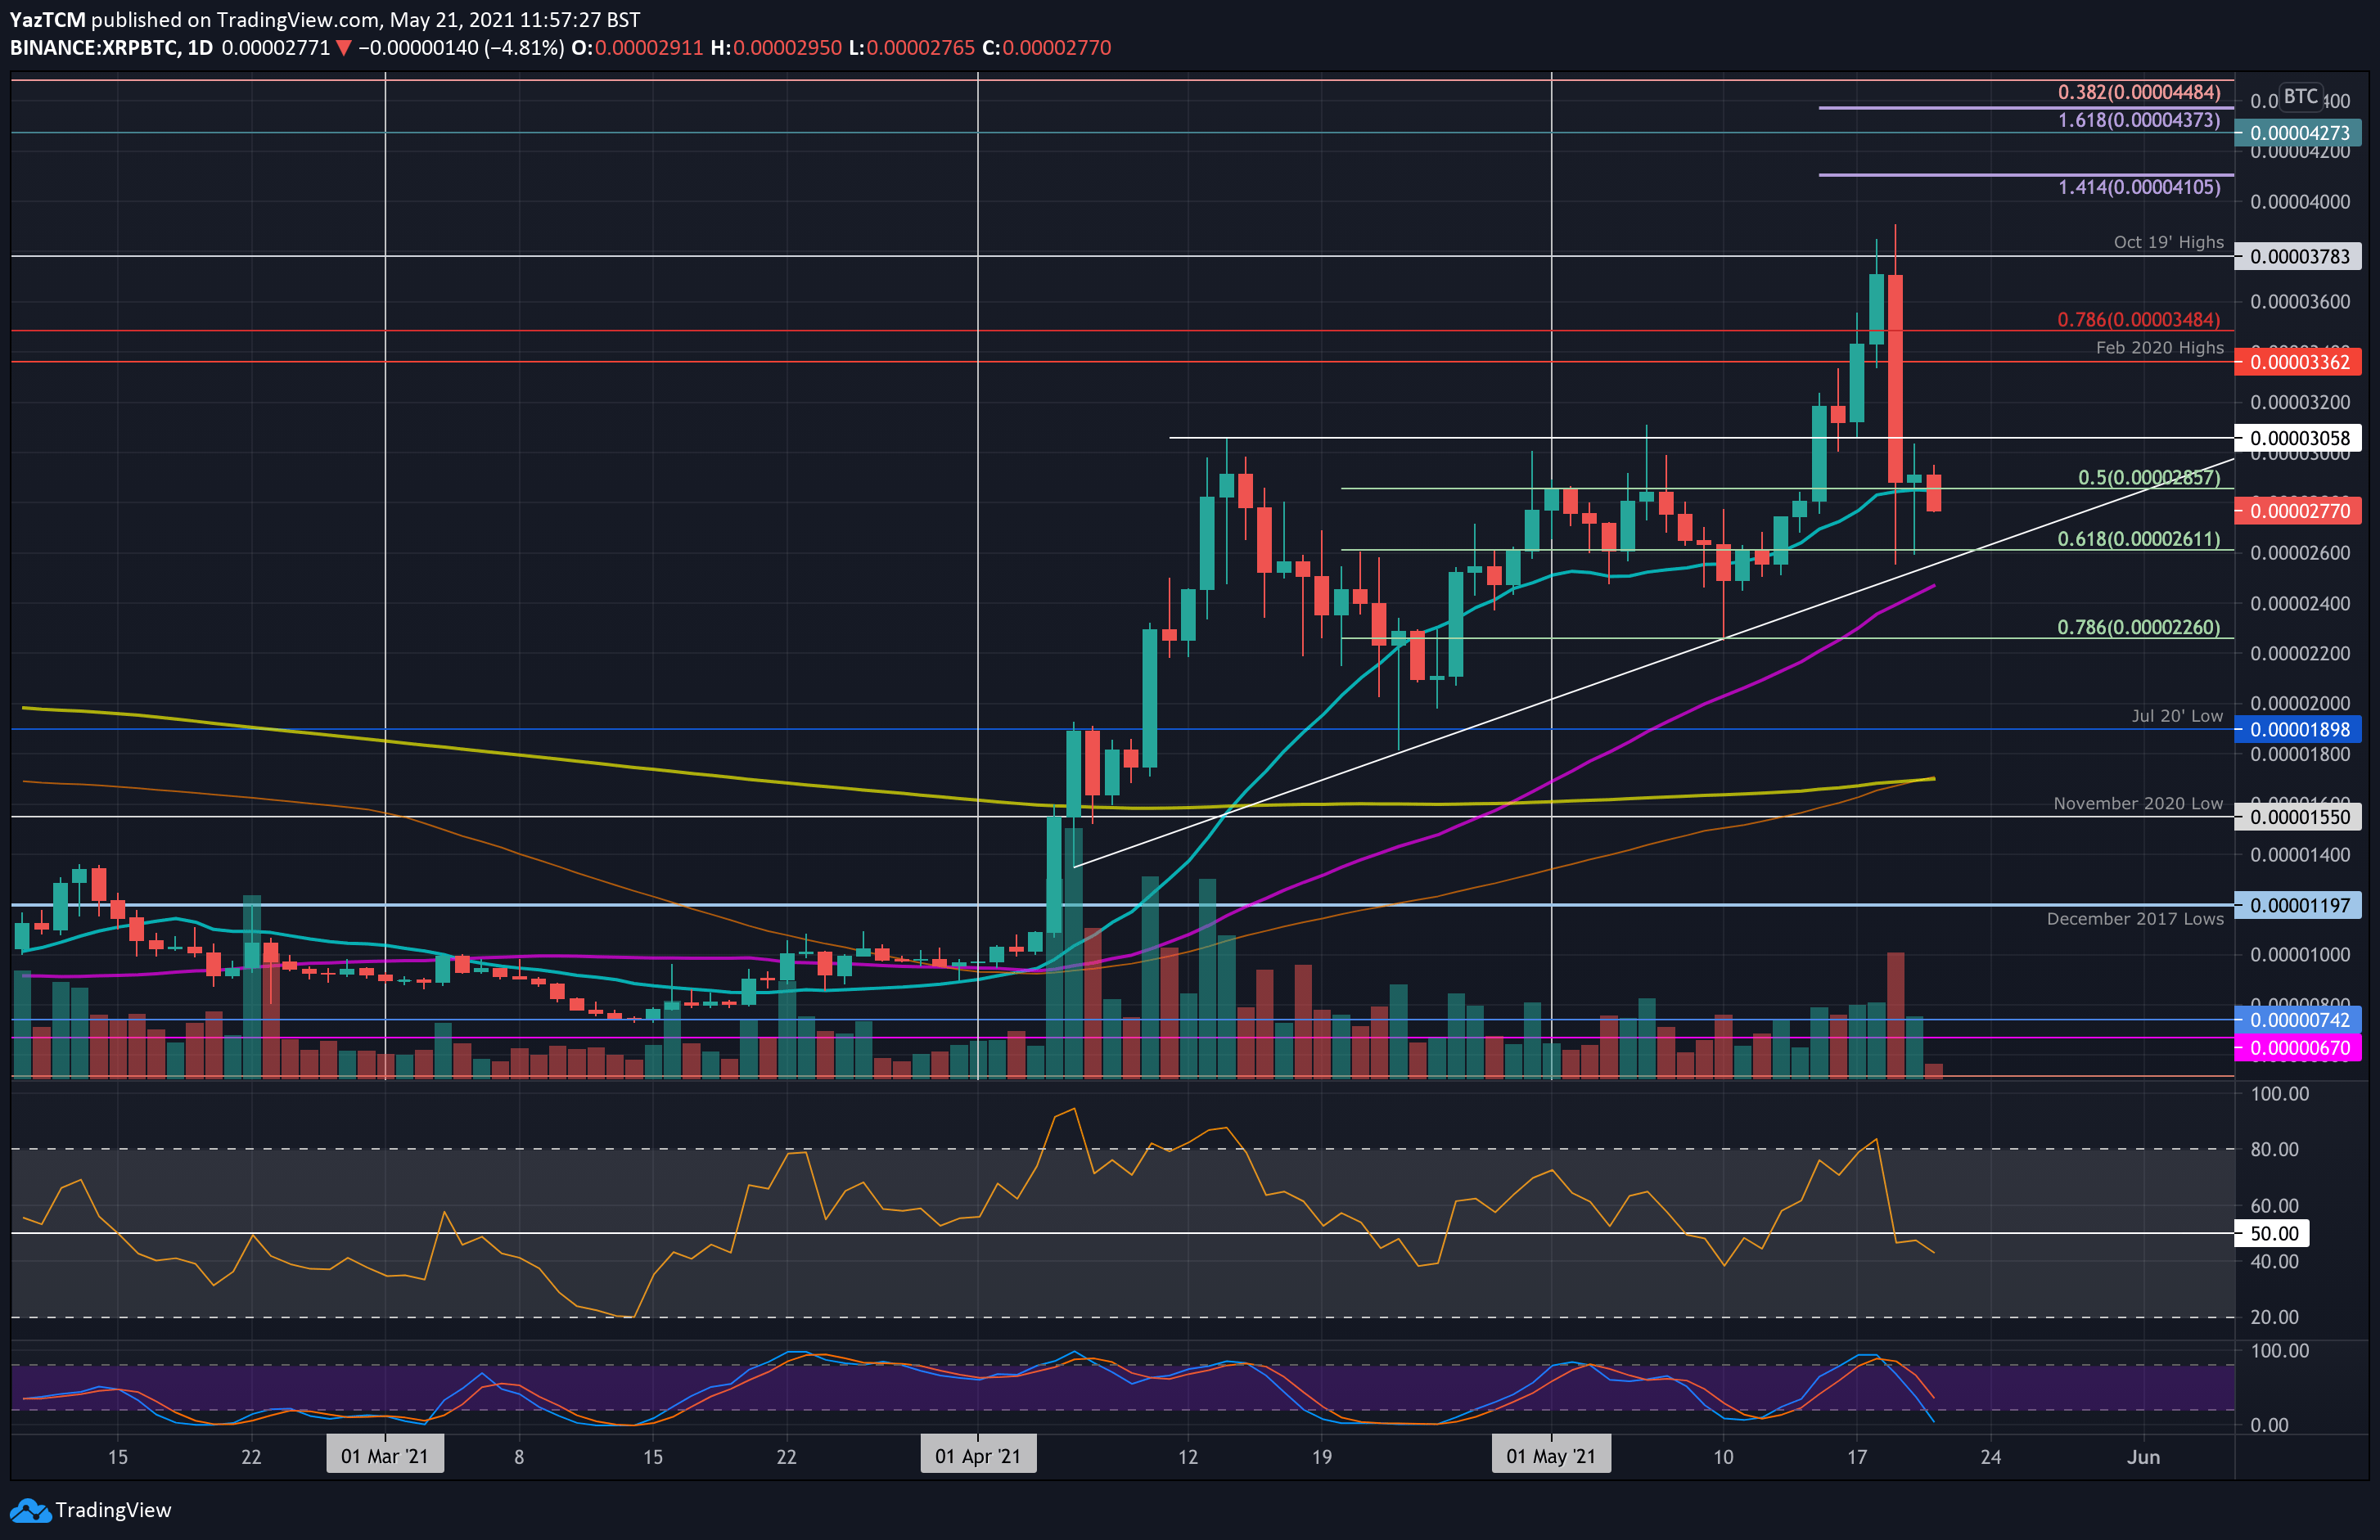
Against bitcoin, XRP started the week by pushing higher into the October 2019 highs around 3800 SAT. From there, XRP started to drop sharply on Wednesday as it fell as low as 2600 SAT. By the end of the day, the bulls regrouped to close the daily candle above the 20-day MA at 2857 SAT.
The buyers attempted to defend this support yesterday but have since pushed beneath it today as it now sits at 2770 SAT.
Looking ahead, the first support lies at 2610 SAT (.618 Fib). This is followed by $2450 SAT (50-day MA), 2660 SAT (.786 Fib), 2400 SAT, and 2000 SAT.
On the other side, the first resistance lies at 3000 SAT. This is followed by 3200 SAT, 3362 SAT (Feb 2020 High), 2600 SAT, and 3800 SAT (Oct 19’ highs).
Binance Coin
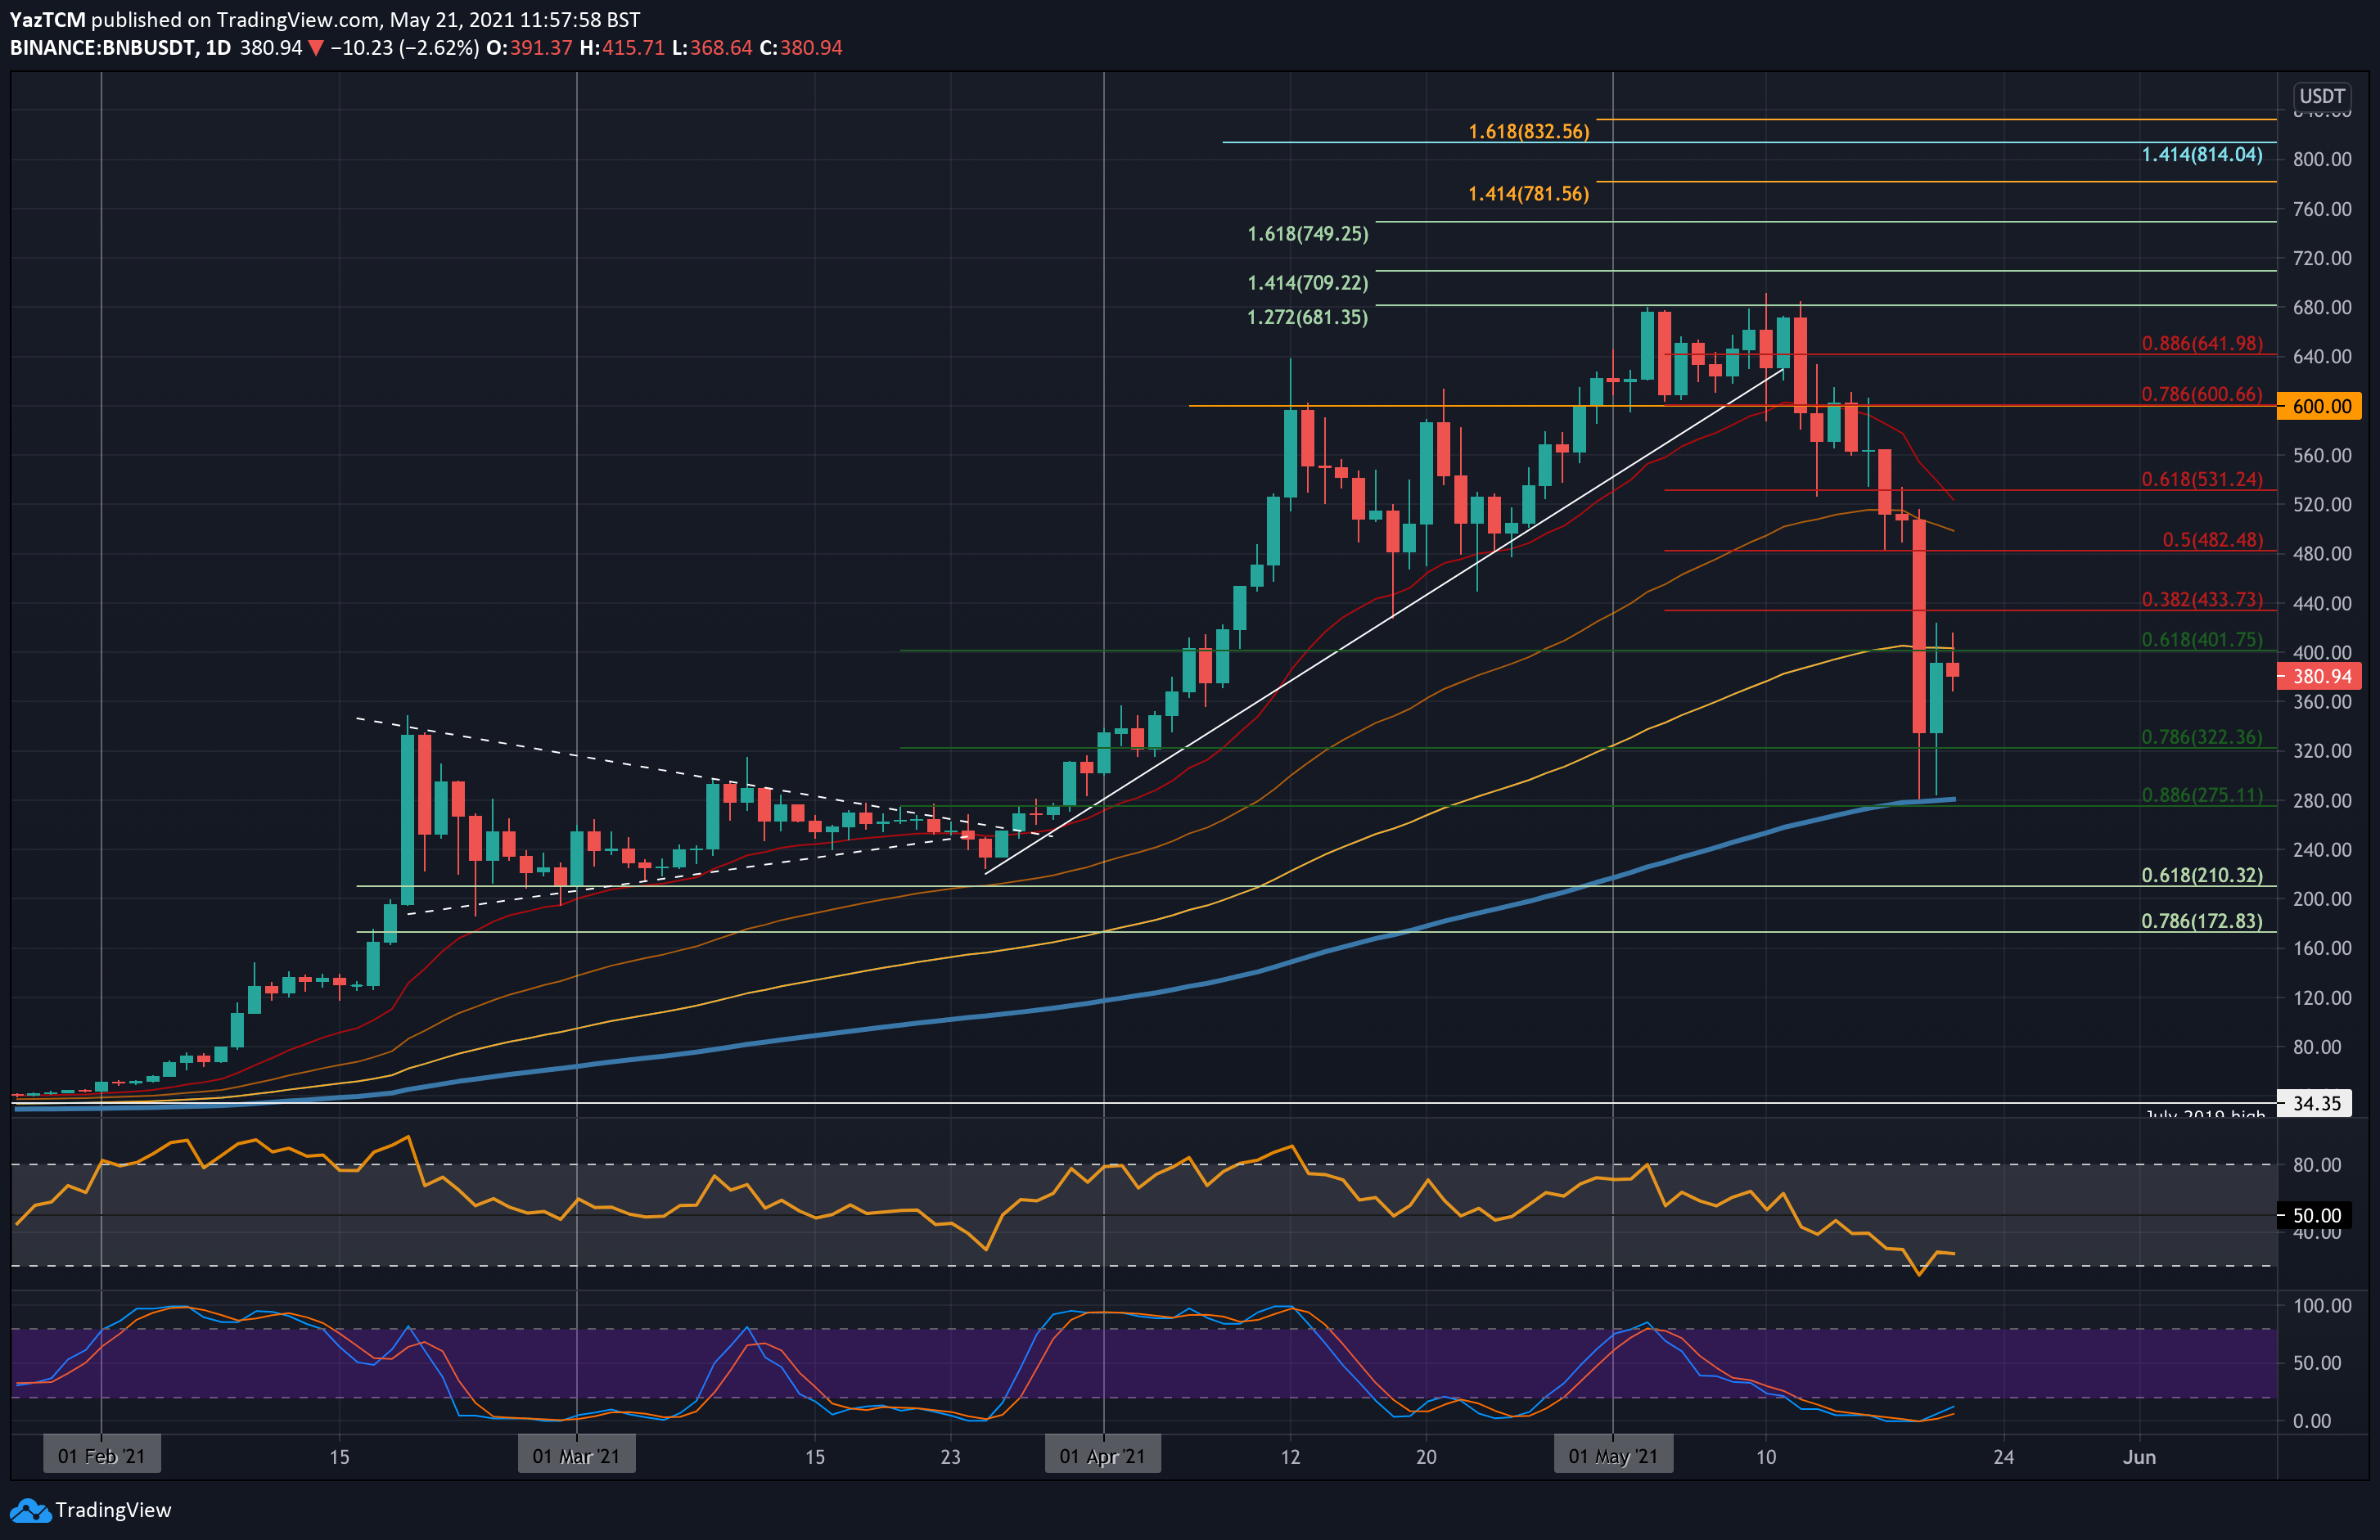
BNB suffered a sharp 34% price plummet this week as it now trades around $380. The coin had been falling since hitting resistance at $681 (1.272 Fib Extension) at the start of the month. On Monday, BNB slipped beneath support at $560 to head beneath $500 and hit $480.
On Wednesday, BNB continued to plummet as it fell beneath the 100-day MA, and continued until support was found at $275, provided by the 200-day MA and a .886 Fib Retracement. The bulls bounced from there to climb back above $300 and close the candle at $325.
Since then, the buyers have attempted to push above $400 but are struggling with the resistance there provided by the 100-day MA.
Looking ahead, if the bears push lower, the first support lies at $360. This is followed by $322 (.786 Fib), $300, and $275 (.886 Fib & 200-day MA).
On the other side, if the bulls can break $400, resistance lies at $433 (bearish .382 Fib), $482 (bearish .5 Fib), $500 (50-day MA), and $530 (bearish .618 Fib).
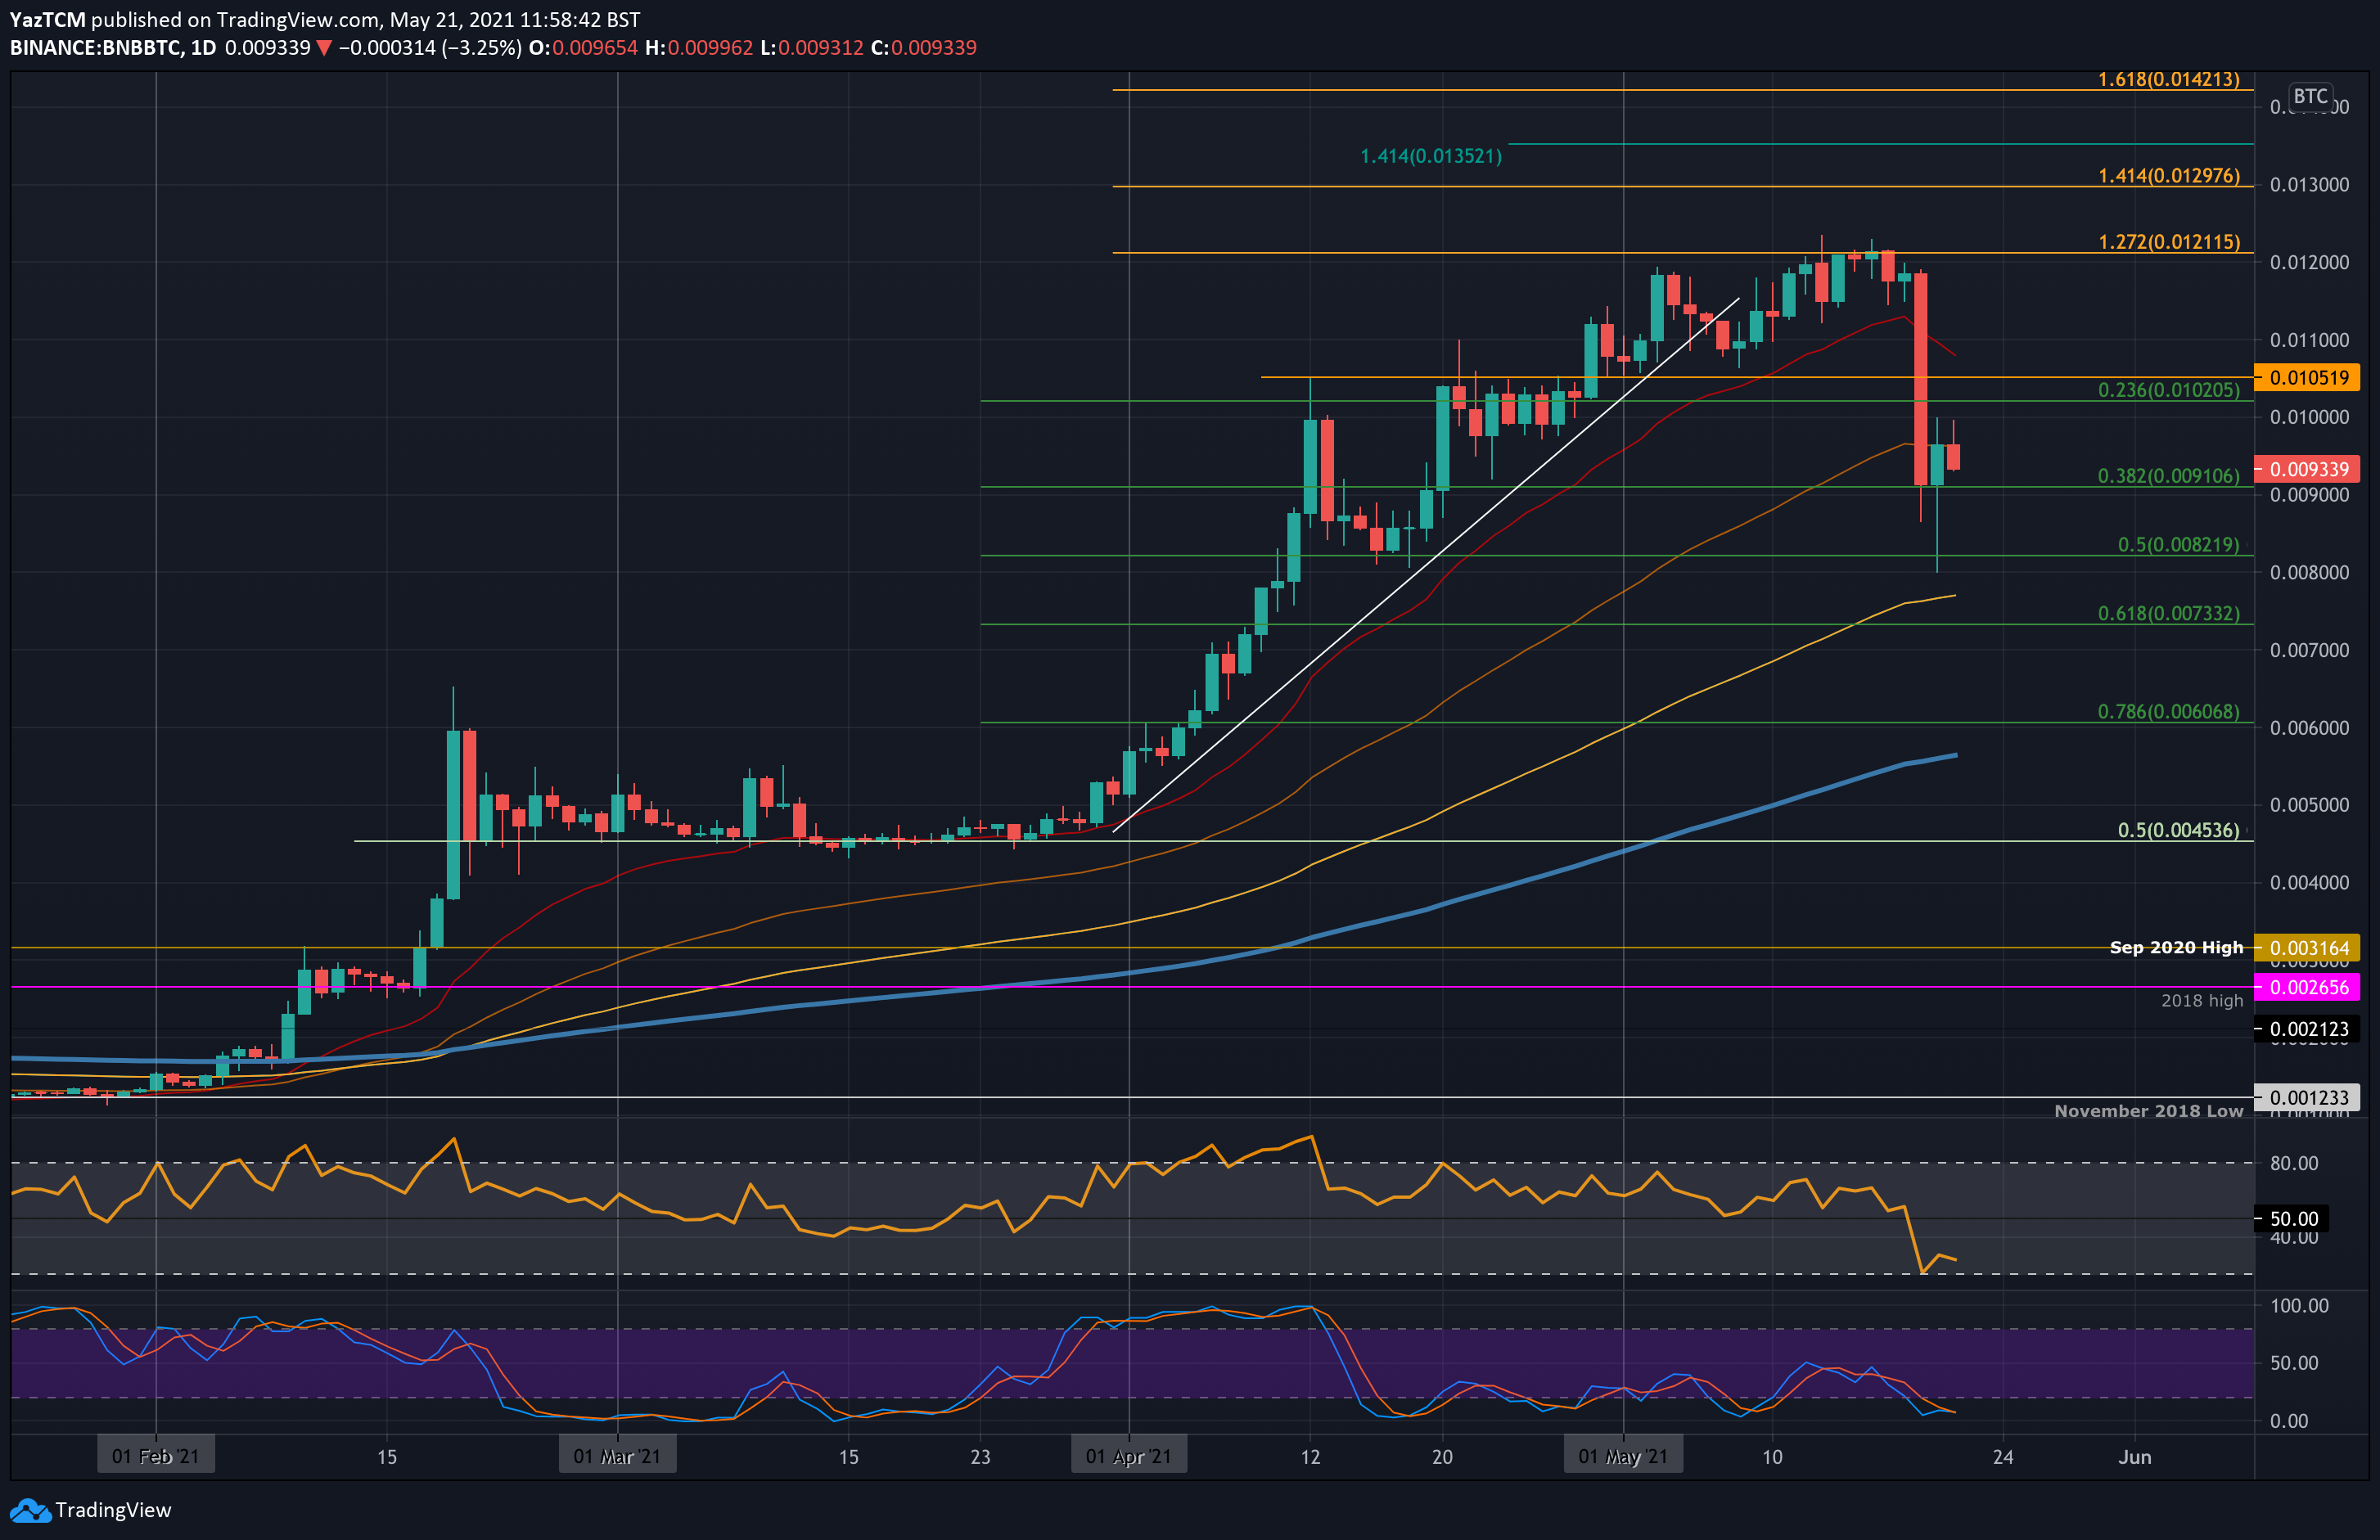
The situation is fairly similar for BNB/BTC. The coin struggled with resistance at 0.0121 BTC (1.272 Fib Extension) last week and failed to break above the level. On Wednesday, BNB fell until support was found at 0.0091 BTC (.382 Fib Retracement).
Interestingly, BNB continued to drop yesterday as it spiked as low as 0.008 BTC. However, the daily candle still managed to close above support at 0.0091 BTC.
Looking ahead, if the bears break 0.0091 BTC, the first support lies at 0.00821 BTC (.5 Fib). This is followed by 0.008 BTC, 0.0075 BTC (100-day MA), 0.00733 BTC (.618 Fib), and 0.006 BTC (.786 Fib).
On the other side, the first resistance lies at 0.01 BTC. This is followed by 0.0106 BTC, 0.011 BTC, and 0.0121 BTC (1.272 Fib Extension).
Polkadot
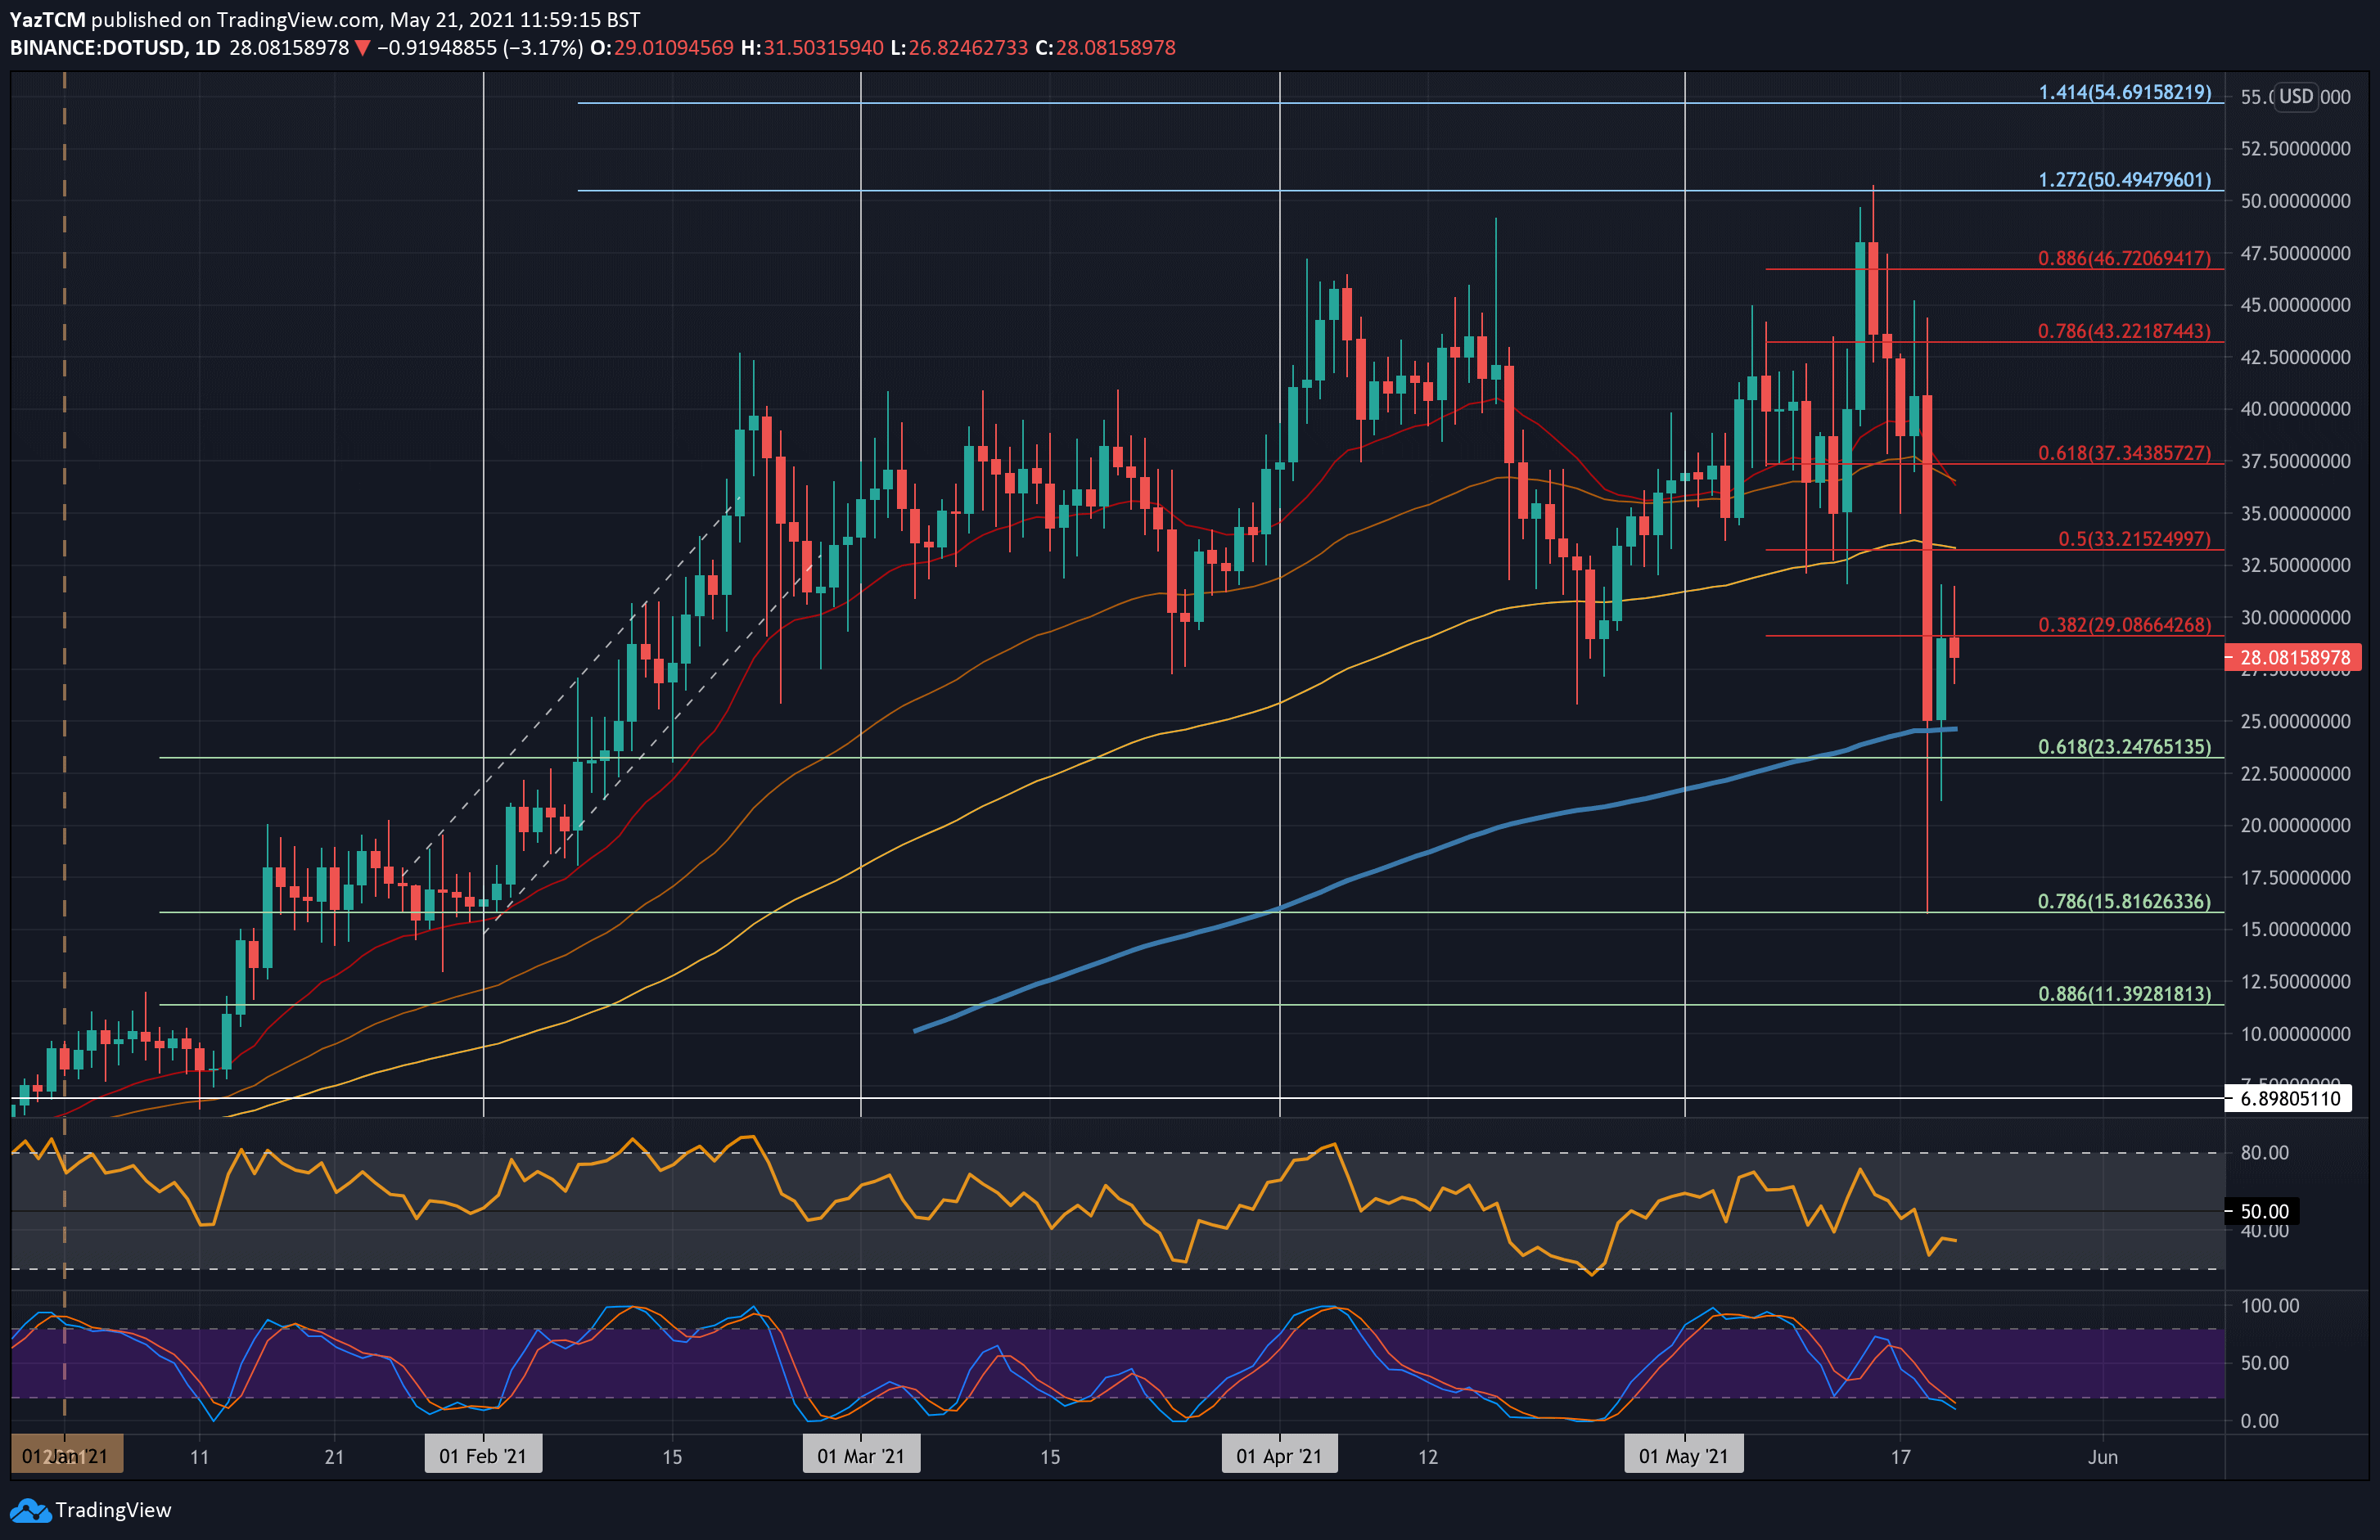
DOT also saw quite a steep 31% price fall this week as it currently trades around $28. The coin fell from above $43 on Wednesday to reach as low as $15.80, where it found support at a .786 Fib. Luckily, the buyers regrouped to allow the daily candle to close above support at $25 (200-day MA).
Since then, DOT managed to break above $30 but is currently struggling to close a candle above resistance at $29 (bearish .382 Fib).
Looking ahead, if the bulls can close above $29, the first resistance lies at $33.21 (bearish .5 Fib). This is followed by $37.35 (bearish .618 Fib), $40, $43.22 (bearish .786 Fib), and $45.
On the other side, the first support lies at $25 (200-day MA). This is followed by $23.25 (.618 Fib), $20, and $15.81 (.786 Fib).
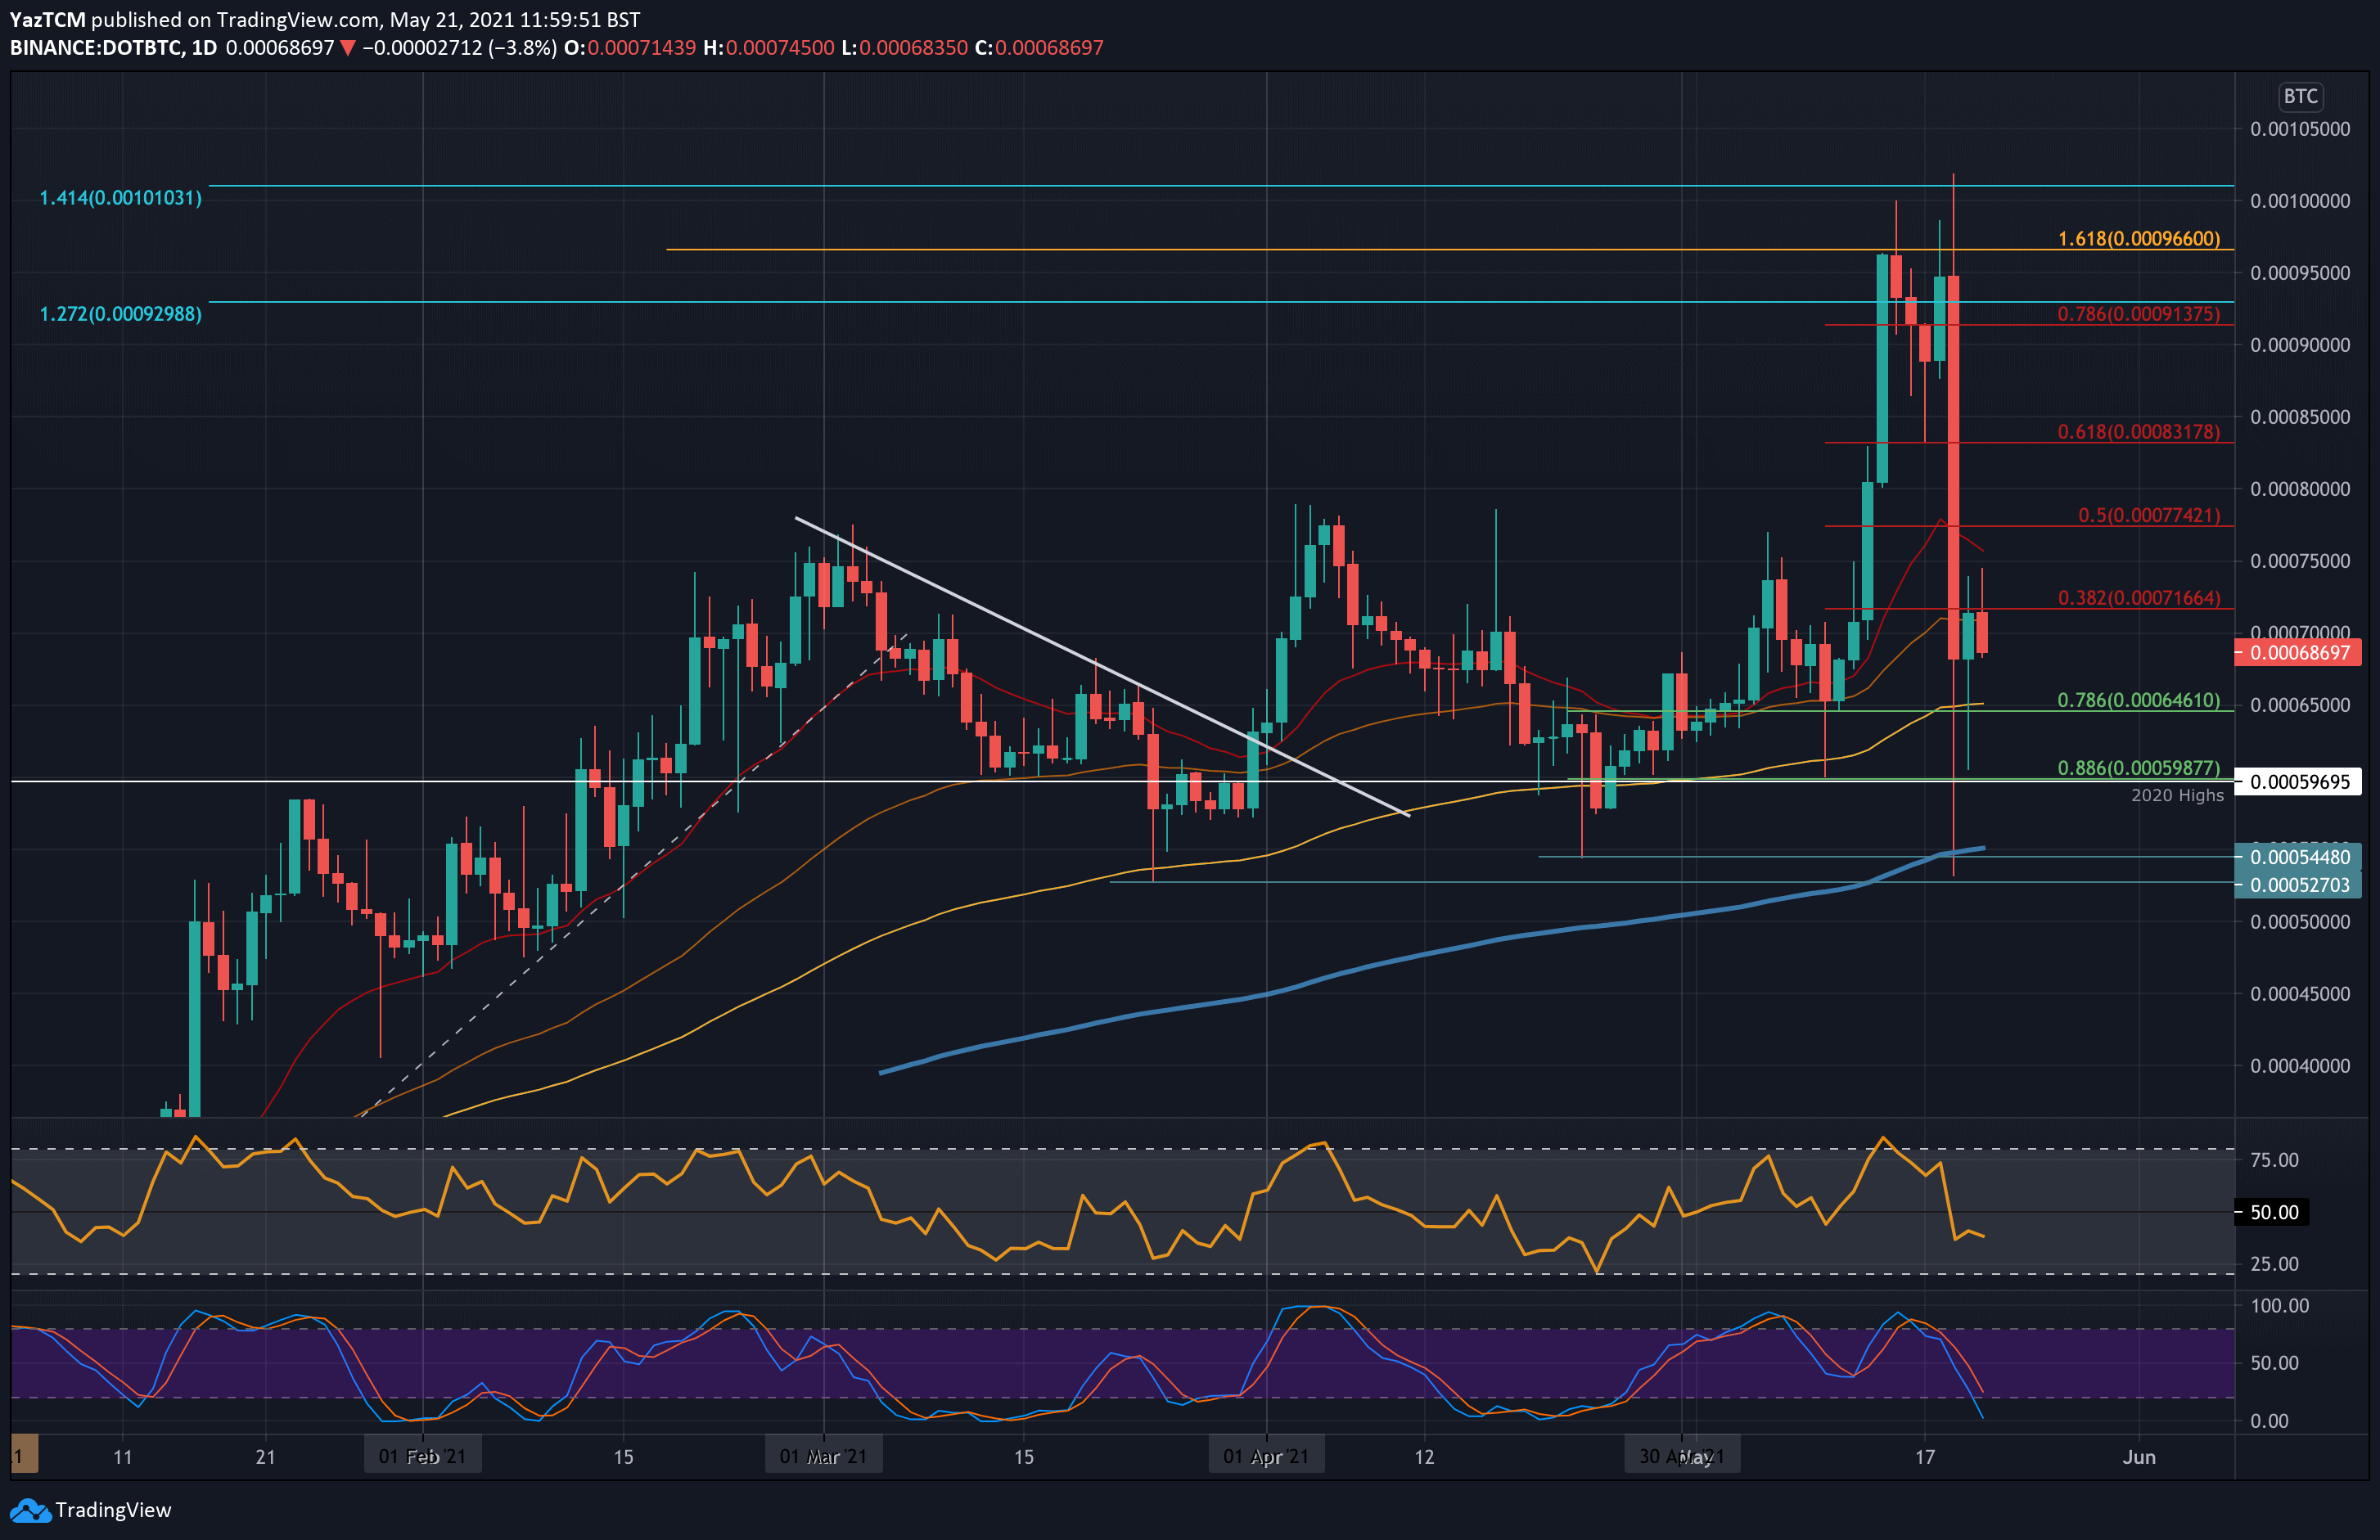
Against BTC, DOT managed to set a new ATH price above 0.001 BTC (1.414 Fib Extension) on Wednesday. However, the market sell-off then caused DOT to reverse and fall as low as 0.00053 BTC. It bounced from these lows to close the daily candle at around 0.00068 BTC.
Since then, DOT has attempted to close above resistance at 0.0007 BTC but has failed to overcome it so far.
Moving forward, the first support lies at 0.00065 BTC (.786 Fib & 100-day MA). This is followed by 0.0006 BTC (.886 Fib & 2020 high), 0.00055 BTC (200-day MA), and 0.000527 BTC.
Ob the other side, if the bulls can break above 0.00071 BTC, higher resistance lies at 0.00075 BTC (20-day MA), 0.00077 BTC (bearish .5 Fib), and 0.0008 BTC.
