Crypto Price Analysis & Overview May 1st: Bitcoin, Ethereum, Ripple, Stellar, and Chainlink
Bitcoin
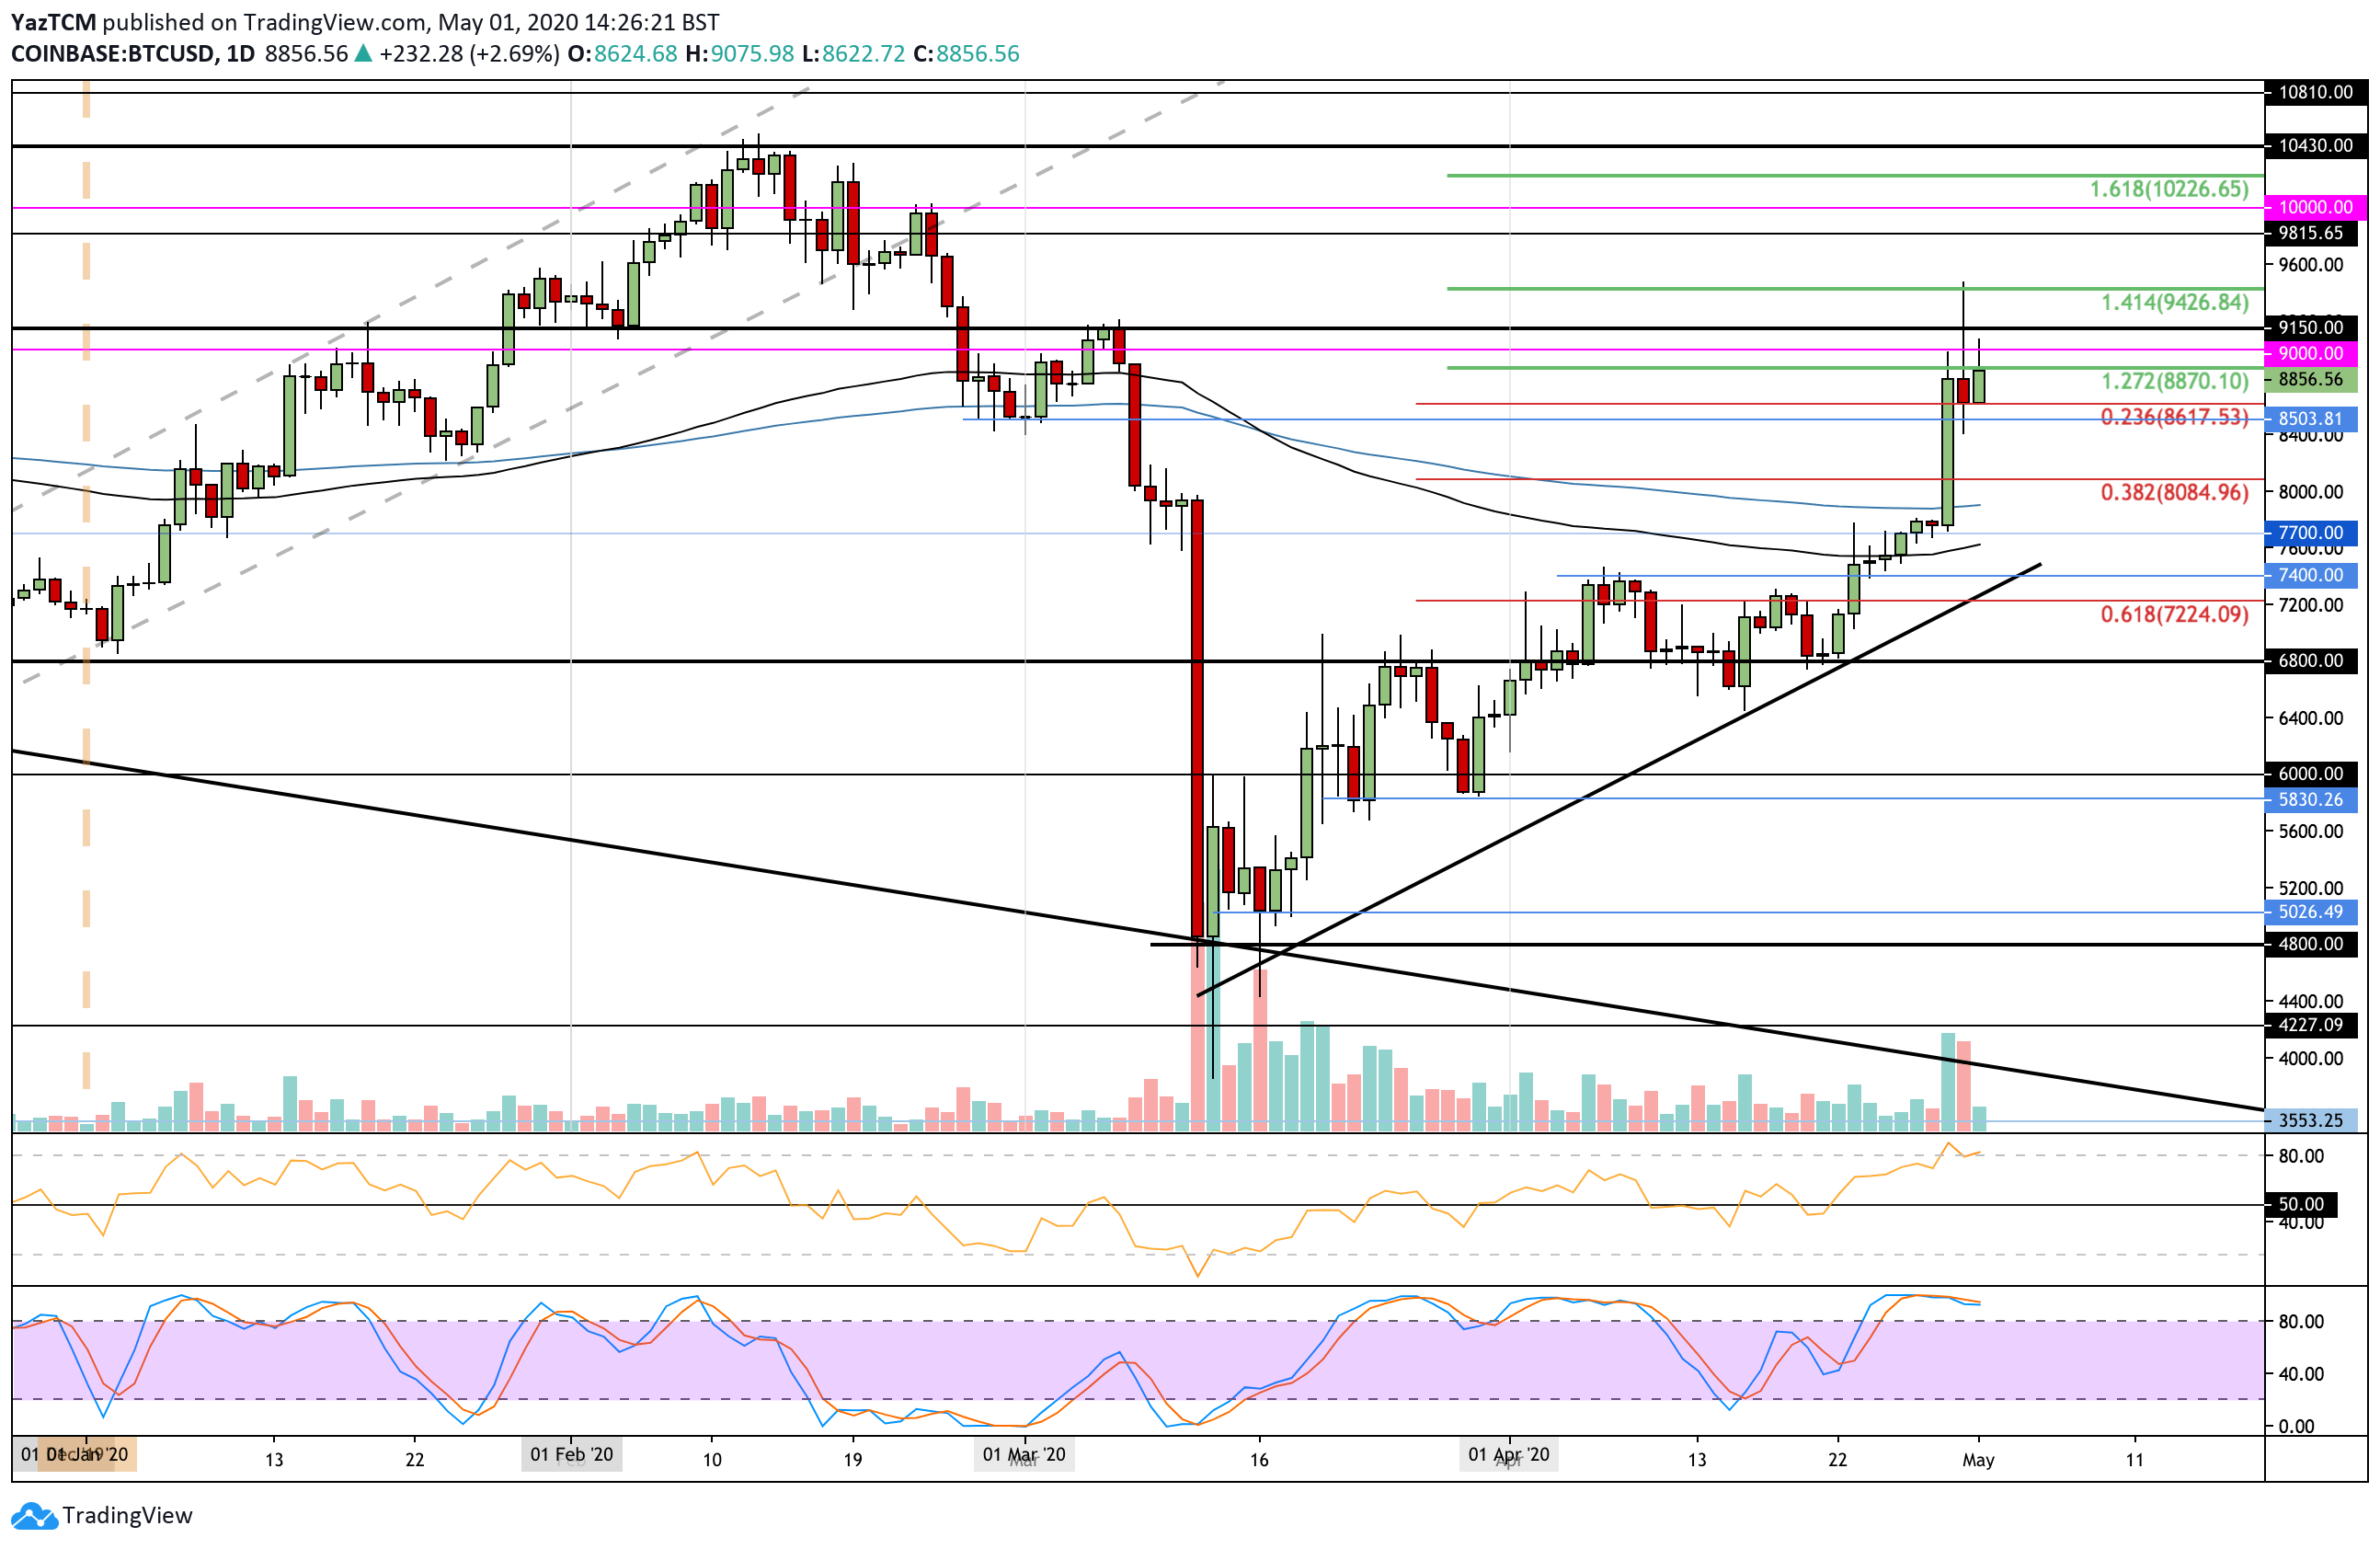
Bitcoin saw an impressive 17.5% price increase over the past 7-days of trading as the cryptocurrency managed to climb above the $7,500 resistance to break above $8,000. It continued to push higher and eventually reached a weekly high of $9,430 before dropping to the current resistance at $8,870 (1.272 Fib Extension).
This price increase is not surprising because the Bitcoin block halving event is just a short 10-days away.
If the buyers continue to push above the current $8,870 level, resistance is expected at $9,000, $9,150, and $9,430 (1.414 Fib Extension). Above this, added resistance lies at $9,500, $9,815, $10,000, and $10,226 (1.618 Fib Extension).
Toward the downside, support lies at $8,620 (.236 Fib Retracement), $8,500, and $8,000. Beneath this, additional support is found at $7,800 (200-days EMA), $7,600 (100-days EMA), and $7,400.
Ethereum
Ethereum saw a 13% price surge over the past 7-days of trading as the cryptocurrency increased from the $187 support to break above $200 and reach as high as $225 during the week.
The cryptocurrency has since dropped from this high as it trades at $211, which is resistance provided by the bearish .618 Fibonacci Retracement level.
Looking ahead, resistance above $211 is located at $220 (1.272 Fib Extension), $225, and $230 (1.414 Fib Extension). If the buyers continue to drive higher from here, added resistance is found at $245 (bearish .786 Fib Retracement), $250, and $270.
Toward the downside, support can be found at $200 (.236 Fib Retracement). Beneath this, support lies at $189 (.382 Fib Retracement), $180, and $175 (.5 Fib Retracement & 100-days EMA).

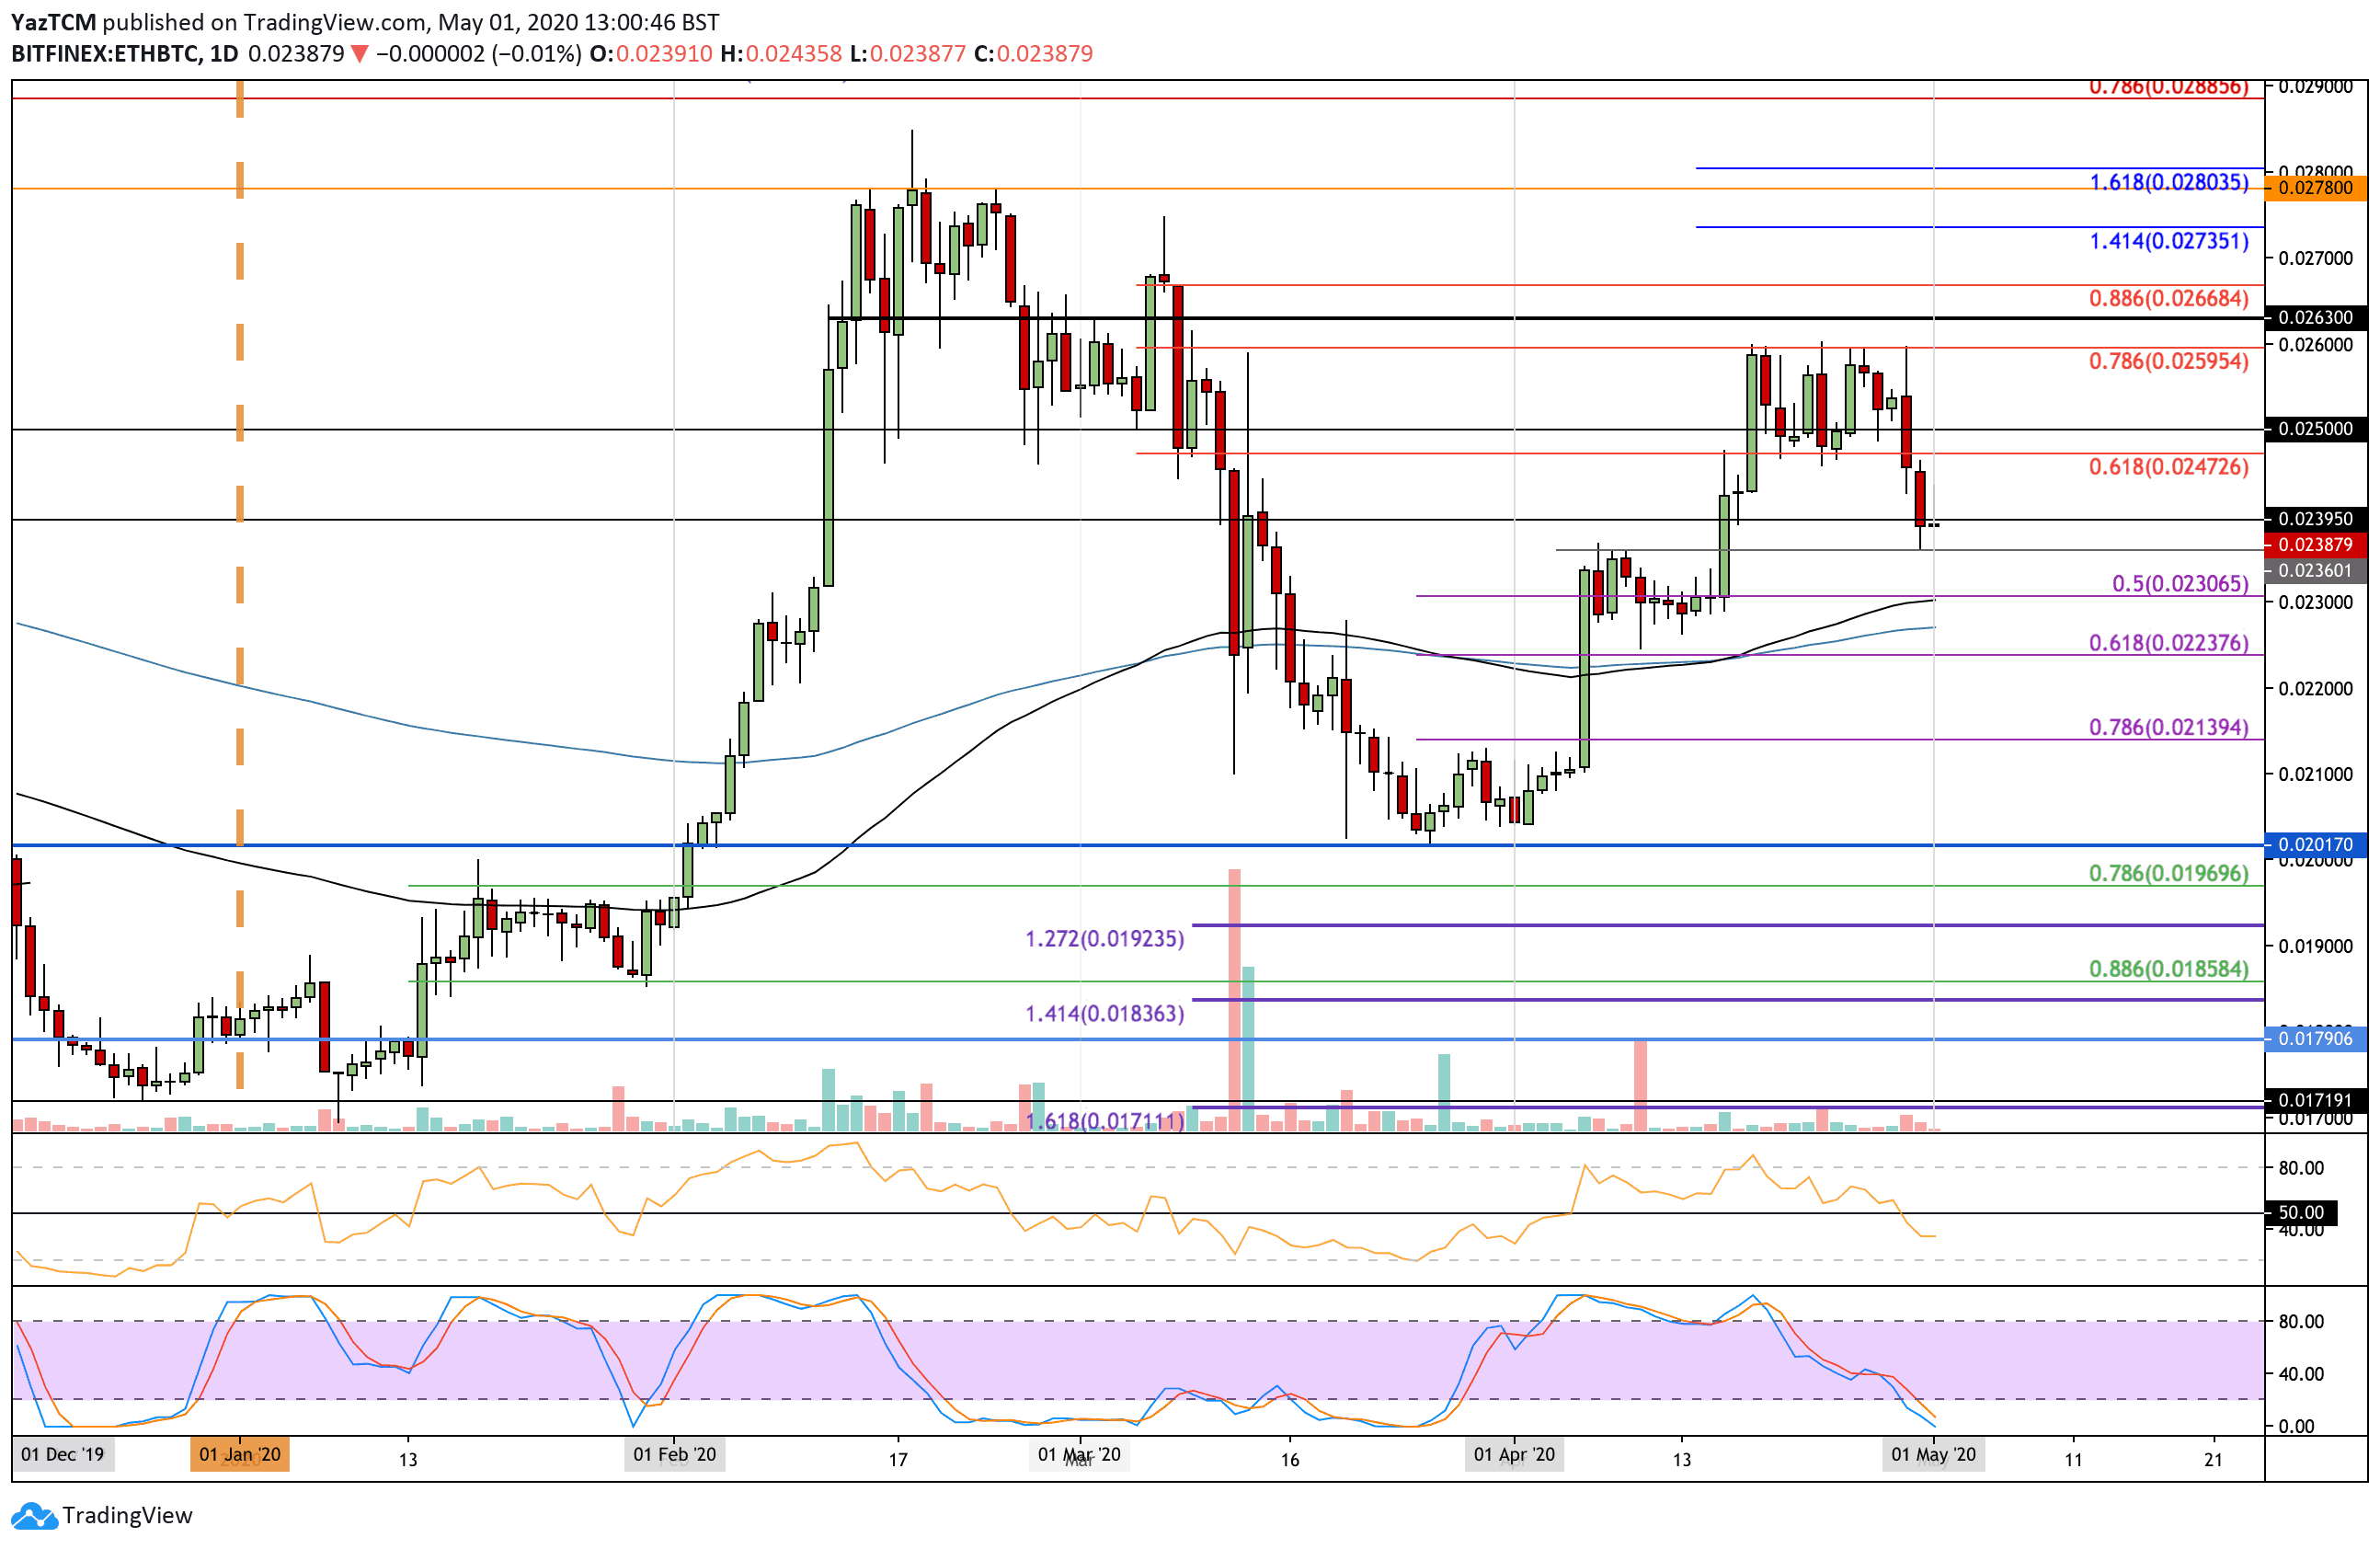
Against Bitcoin, Ethereum was trading within a range between 0.026 BTC and 0.0247 BTC for the majority of the week. However, in yesterday’s trading session, ETH dropped beneath this lower boundary as it crashed into the 0.0239 BTC level.
Moving forward, if the sellers push lower, support is located at 0.0236 BTC and 0.023 BTC (.5 Fib Retracement & 100-days EMA). Beneath this, support lies at 0.0225 BTC (200-days EMA), 0.0223 BTC (.618 Fib Retracement), and 0.022 BTC.
On the other side, if the bulls push back above 0.024 BTC, resistance lies at 0.0247 BTC, 0.025 BTC, and 0.026 BTC. This is followed by resistance at 0.0263 BTC and 0.0266 BTC (bearish .886 Fib Retracement).
Ripple
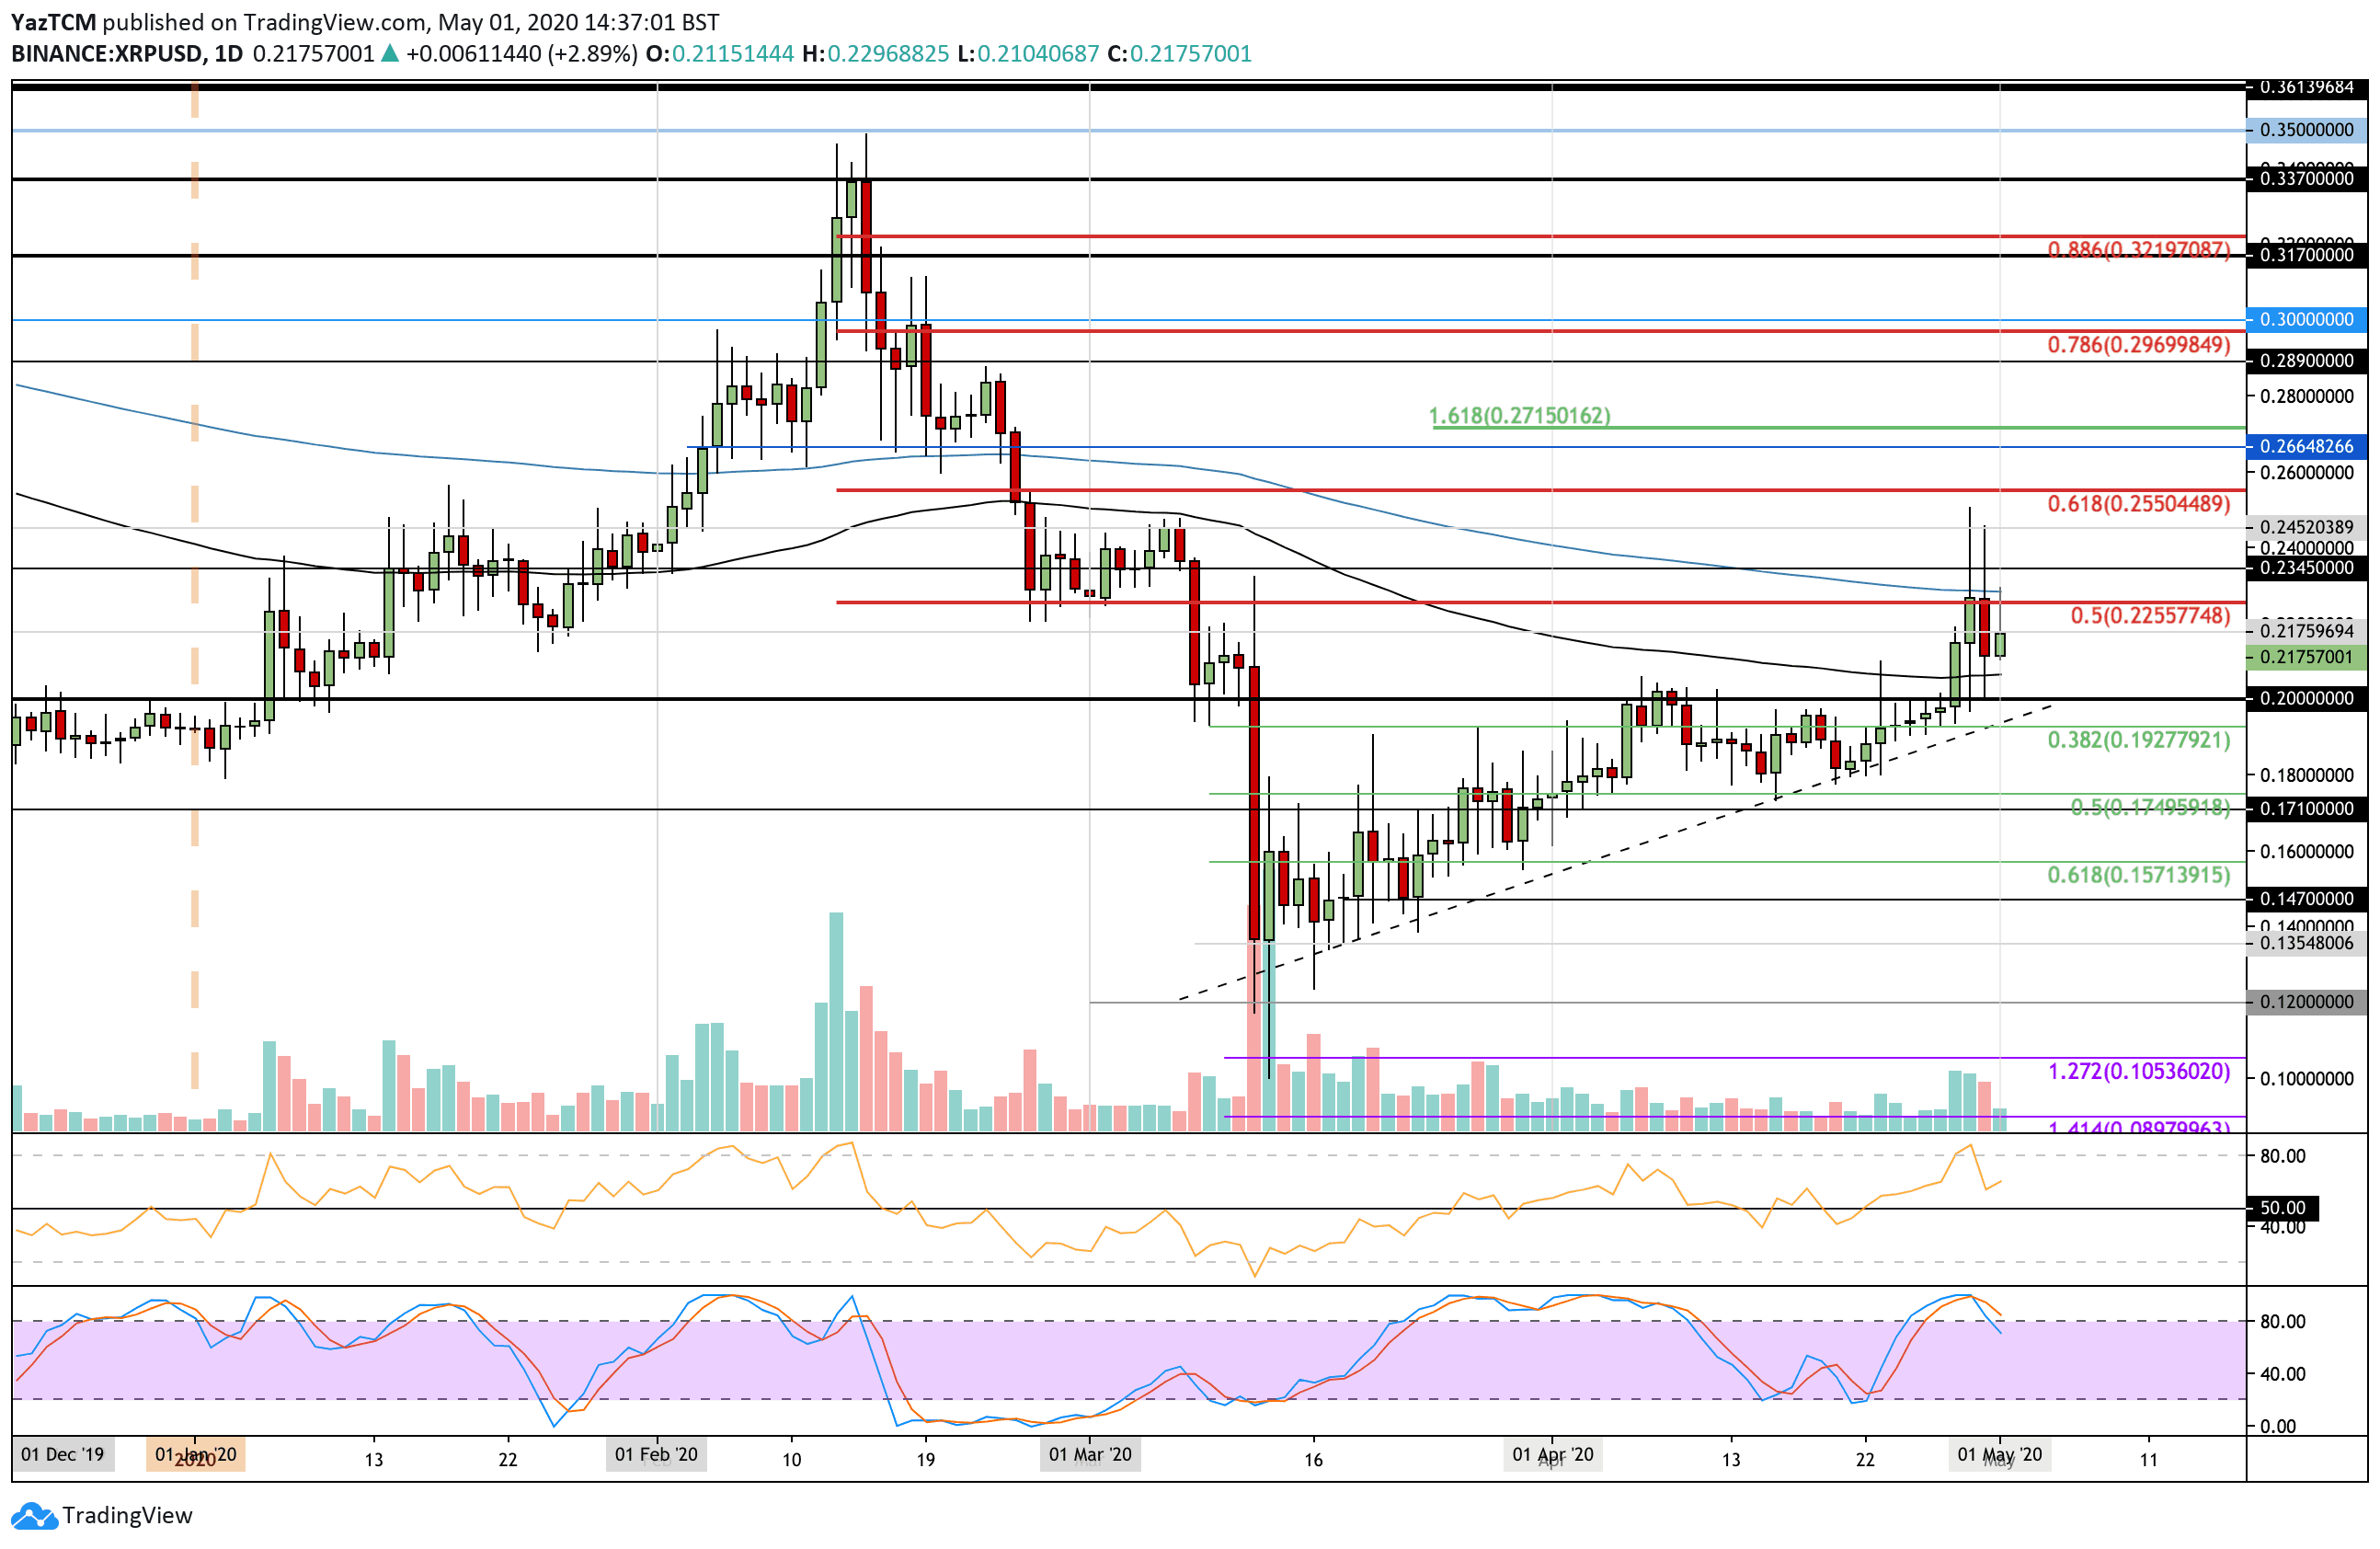
XRP saw a 12.5% price hike this week as the cryptocurrency finally manages to break above the strong resistance at $0.20. It had been trapped at this level since the mid-March market collapse and was turned away on each attempt to break above.
After breaking this resistance, XRP surged higher to reach the $0.25 level. However, it was unable to sustain this high and closed the day beneath the 200-days EMA at $0.226. XRP has pushed lower from here as it currently trades at $0.217.
If the buyers manage to push above $0.226 (200-days EMA) again, higher resistance lies at $0.234, $0.245, and $0.255 (bearish .618 Fib Retracement). Above this, added resistance is located at $0.26 and $0.271.
On the other side, if the sellers push lower, support is found at $0.21, $0.206 (100-days EMA), and $0.20. Beneath this, added support is located at $0.192 (.382 Fib Retracement) and $0.18.
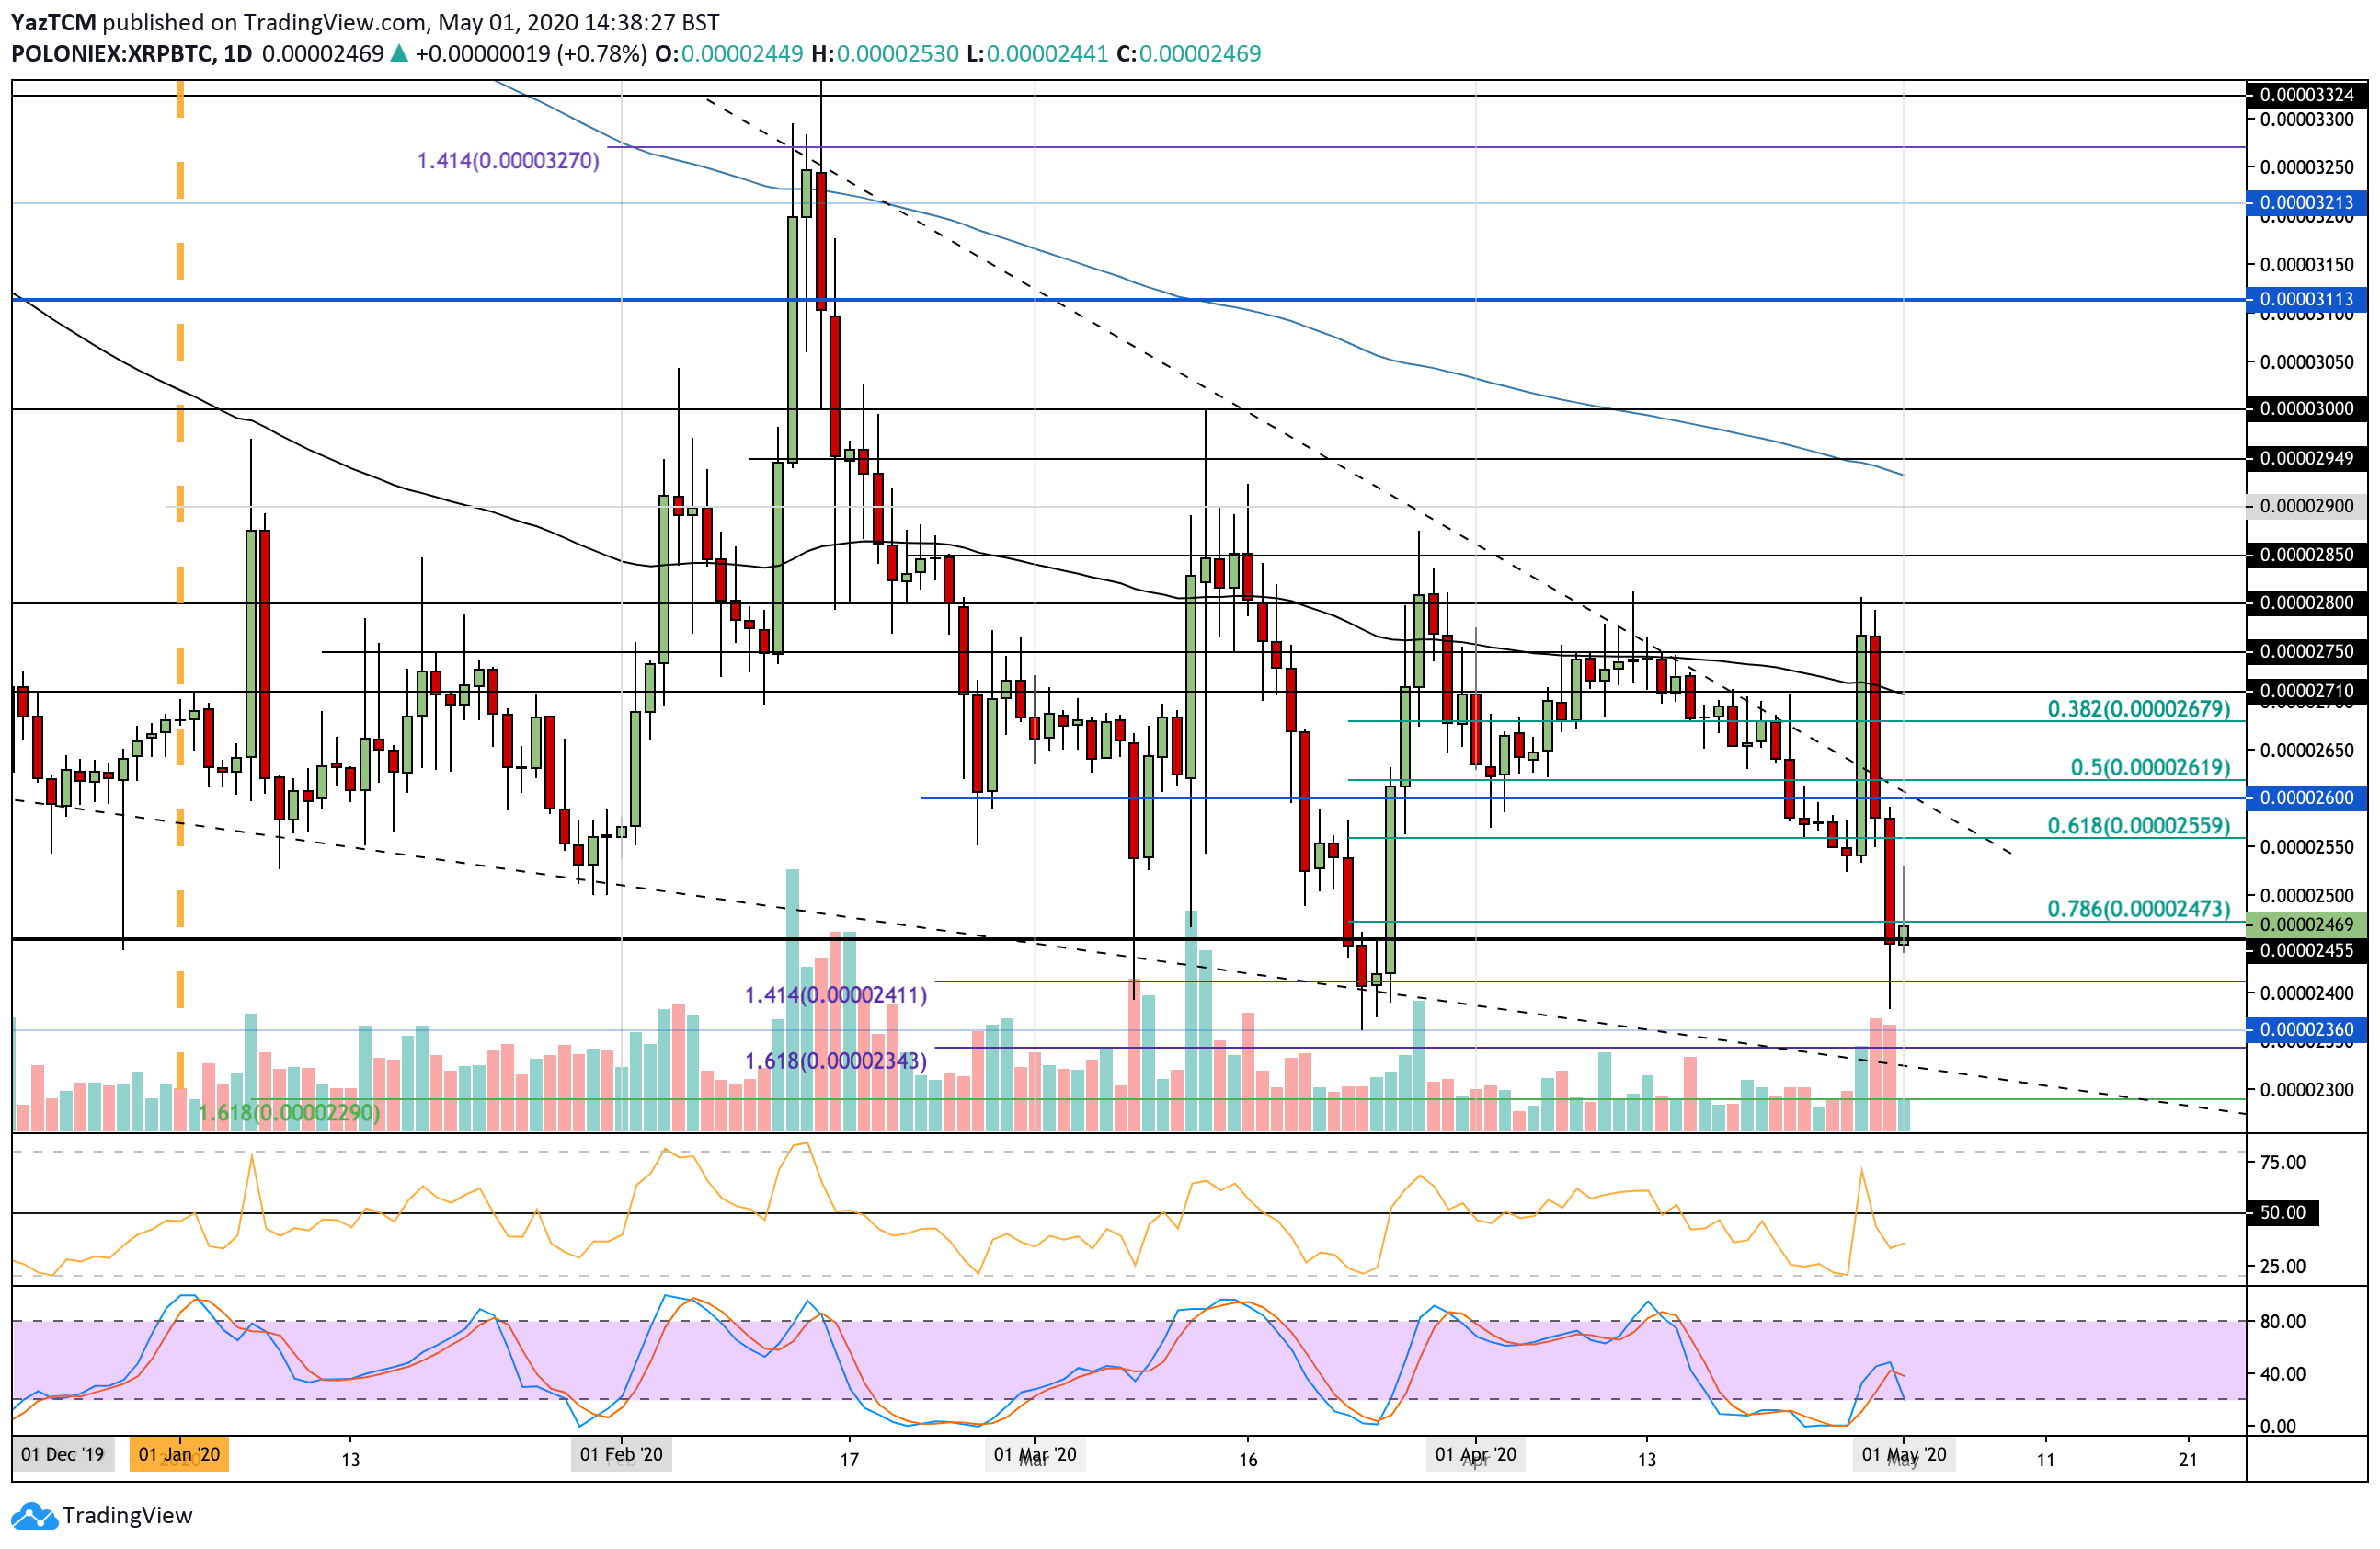
XRP had an exciting week against BTC. During the week, it managed to surge as high as 2800 SAT as it climbed above the long term falling trend line. However, it quickly reversed this increase over the past couple of days as the cryptocurrency plummetted back beneath the trend line to create a fresh April low at around 2400 SAT.
The coin has now risen to the 2470 SAT level today, but the outlook still looks pretty bearish.
If the sellers push lower, the first level of support lies at 2455 SAT. This is followed by support at 2400 SAT, 2360 SAT, 2350 SAT, and 2300 SAT.
If the buyers drive upward, resistance lies at 2470 SAT, 2500 SAT, 2560 SAT, and 2600 SAT. Above this, added resistance lies at 2650 SAT and 2710 SAT.
Stellar
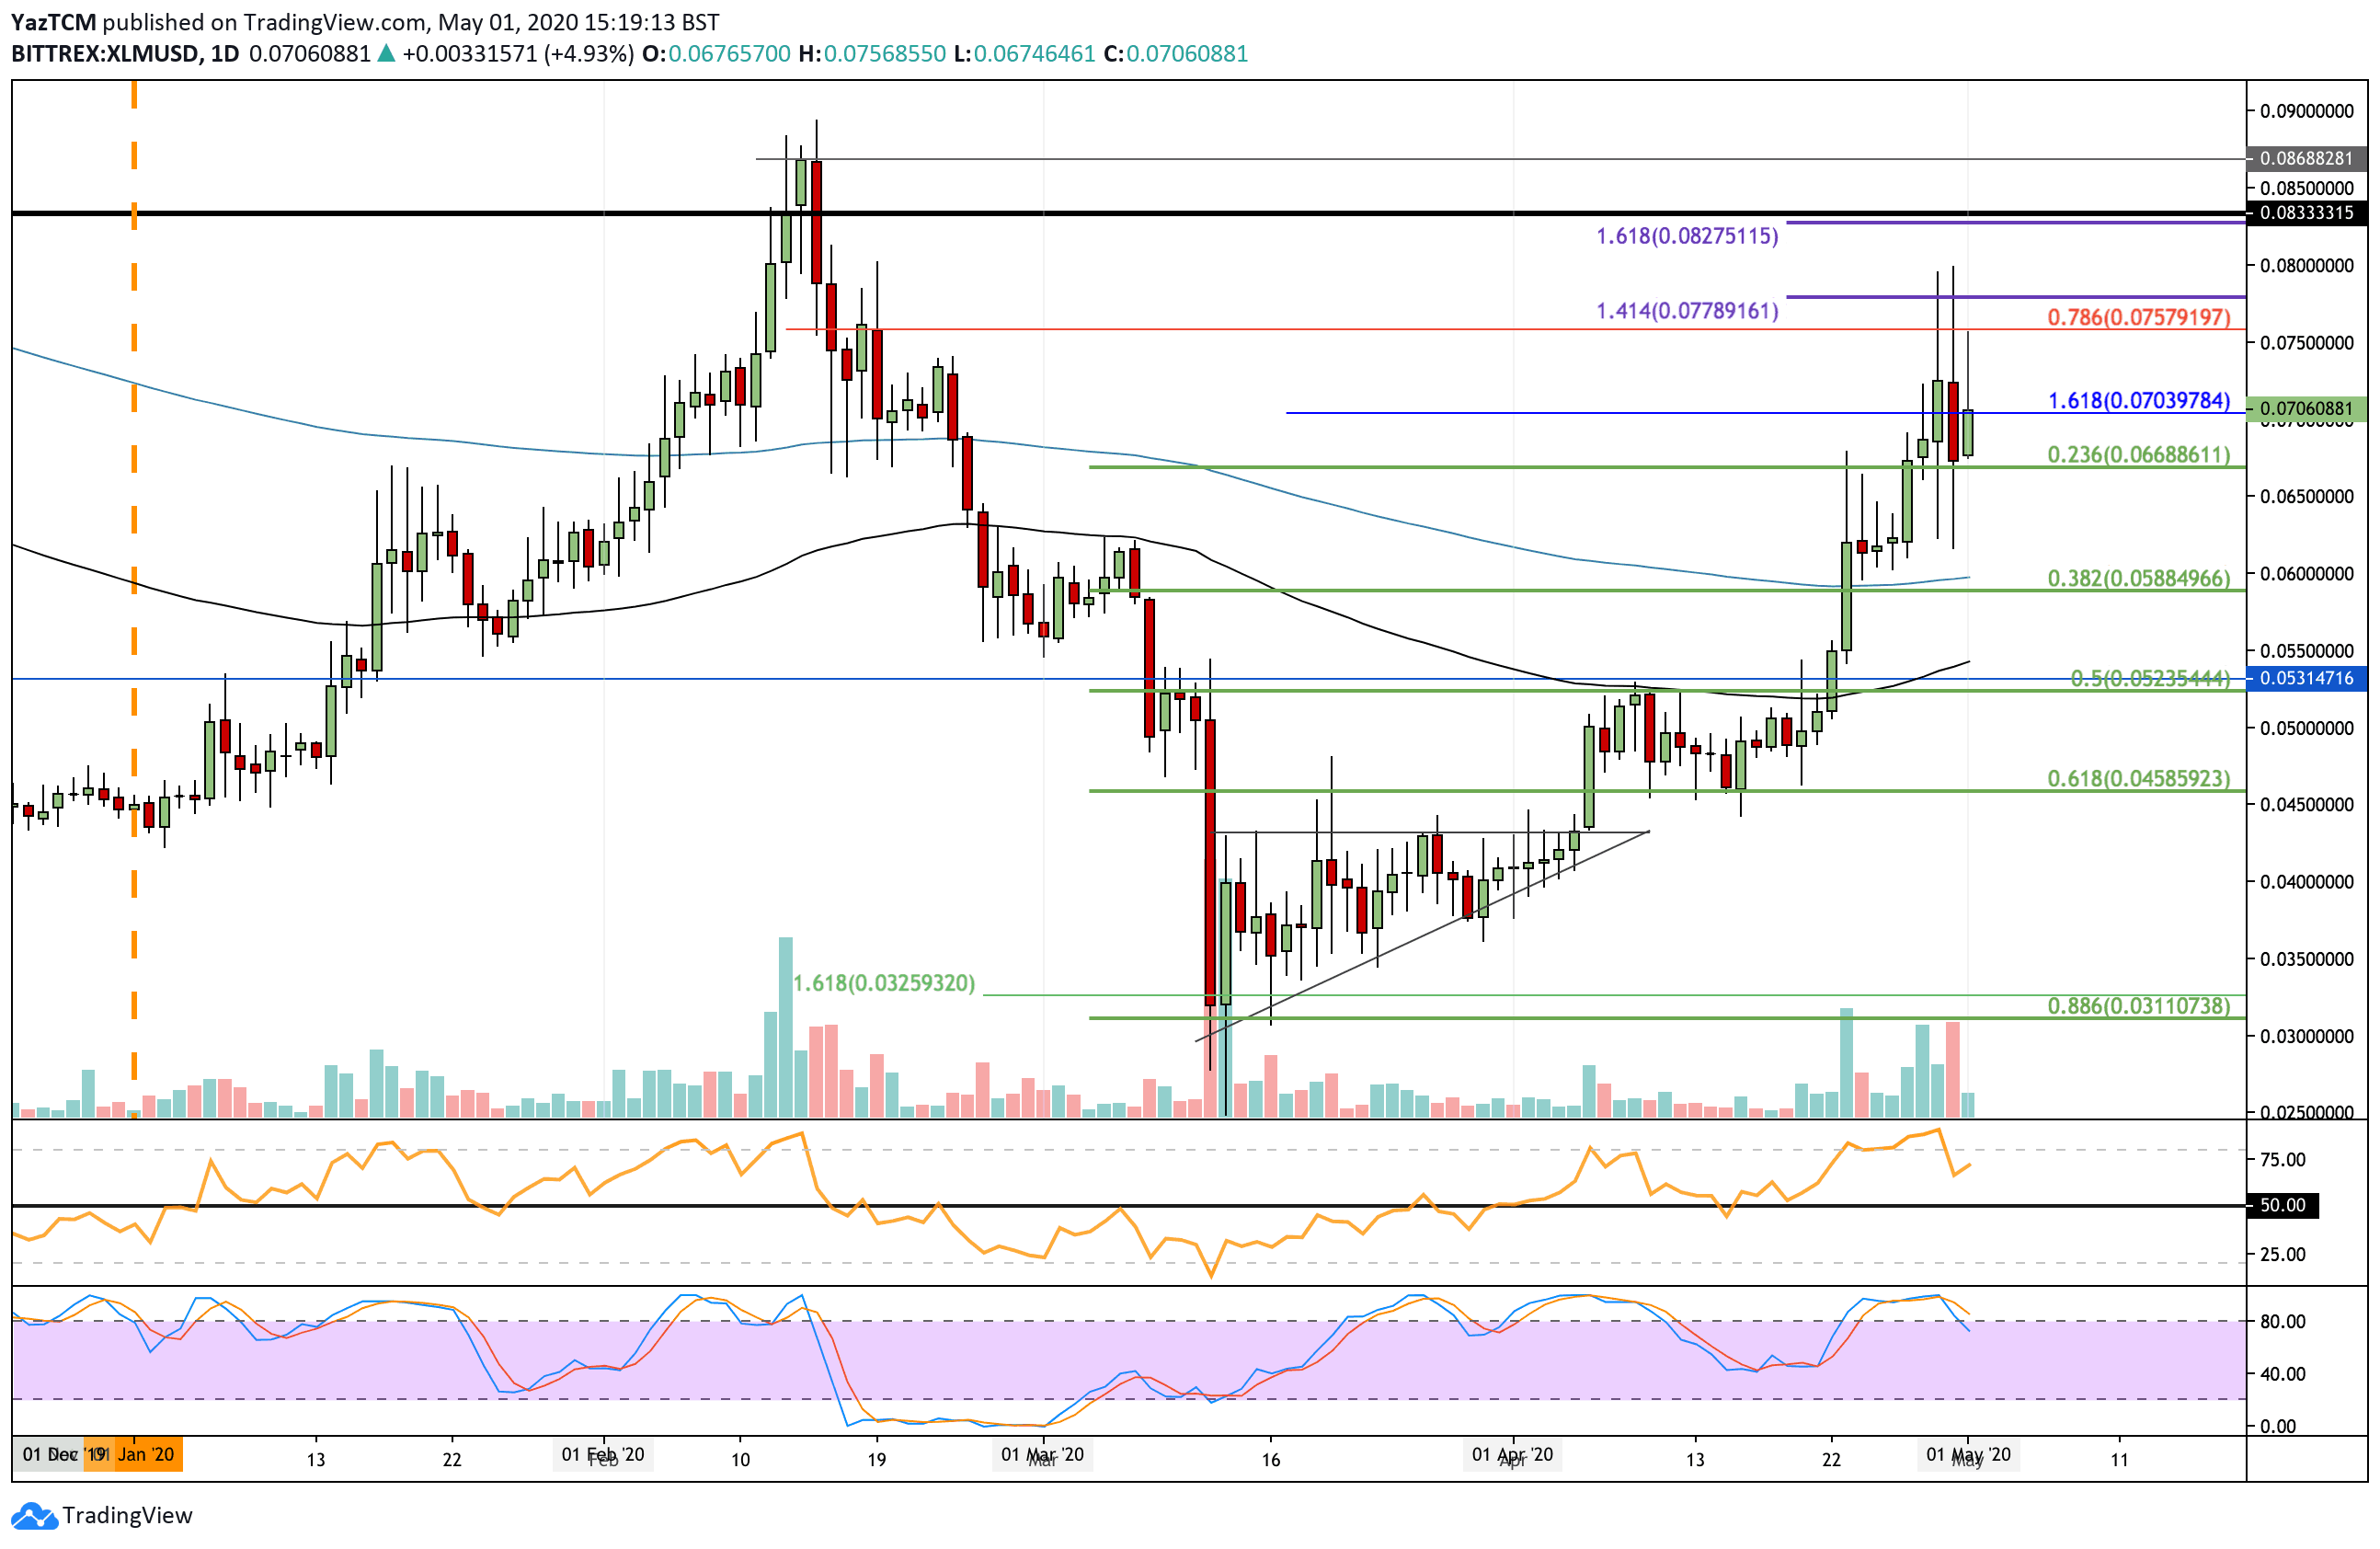
Stellar saw a fantastic 12.8% price surge this week as the cryptocurrency managed to rise from the $0.06 level to reach as high as $0.08. The coin since dropped lower into the $0.07 level after finding support at $0.066.
This price surge has now caused XLM to regain all of the losses that were seen during the March 2020 collapse after being able to surge by a total of around 77% over the past 30-days of trading.
Looking ahead, if the buyers push above $0.07, resistance is located at $0.0757 (bearish .786 Fib Retracement), and $0.08. Above this, higher resistance lies at $0.082 (1.618 Fib Extension), $0.085, and $0.09.
Toward the downside, the first level of support lies at $0.066 (.236 Fib Retracement). Beneath this, support lies at $0.06 (200-days EMA), $0.058, and $0.055 (100-days EMA).
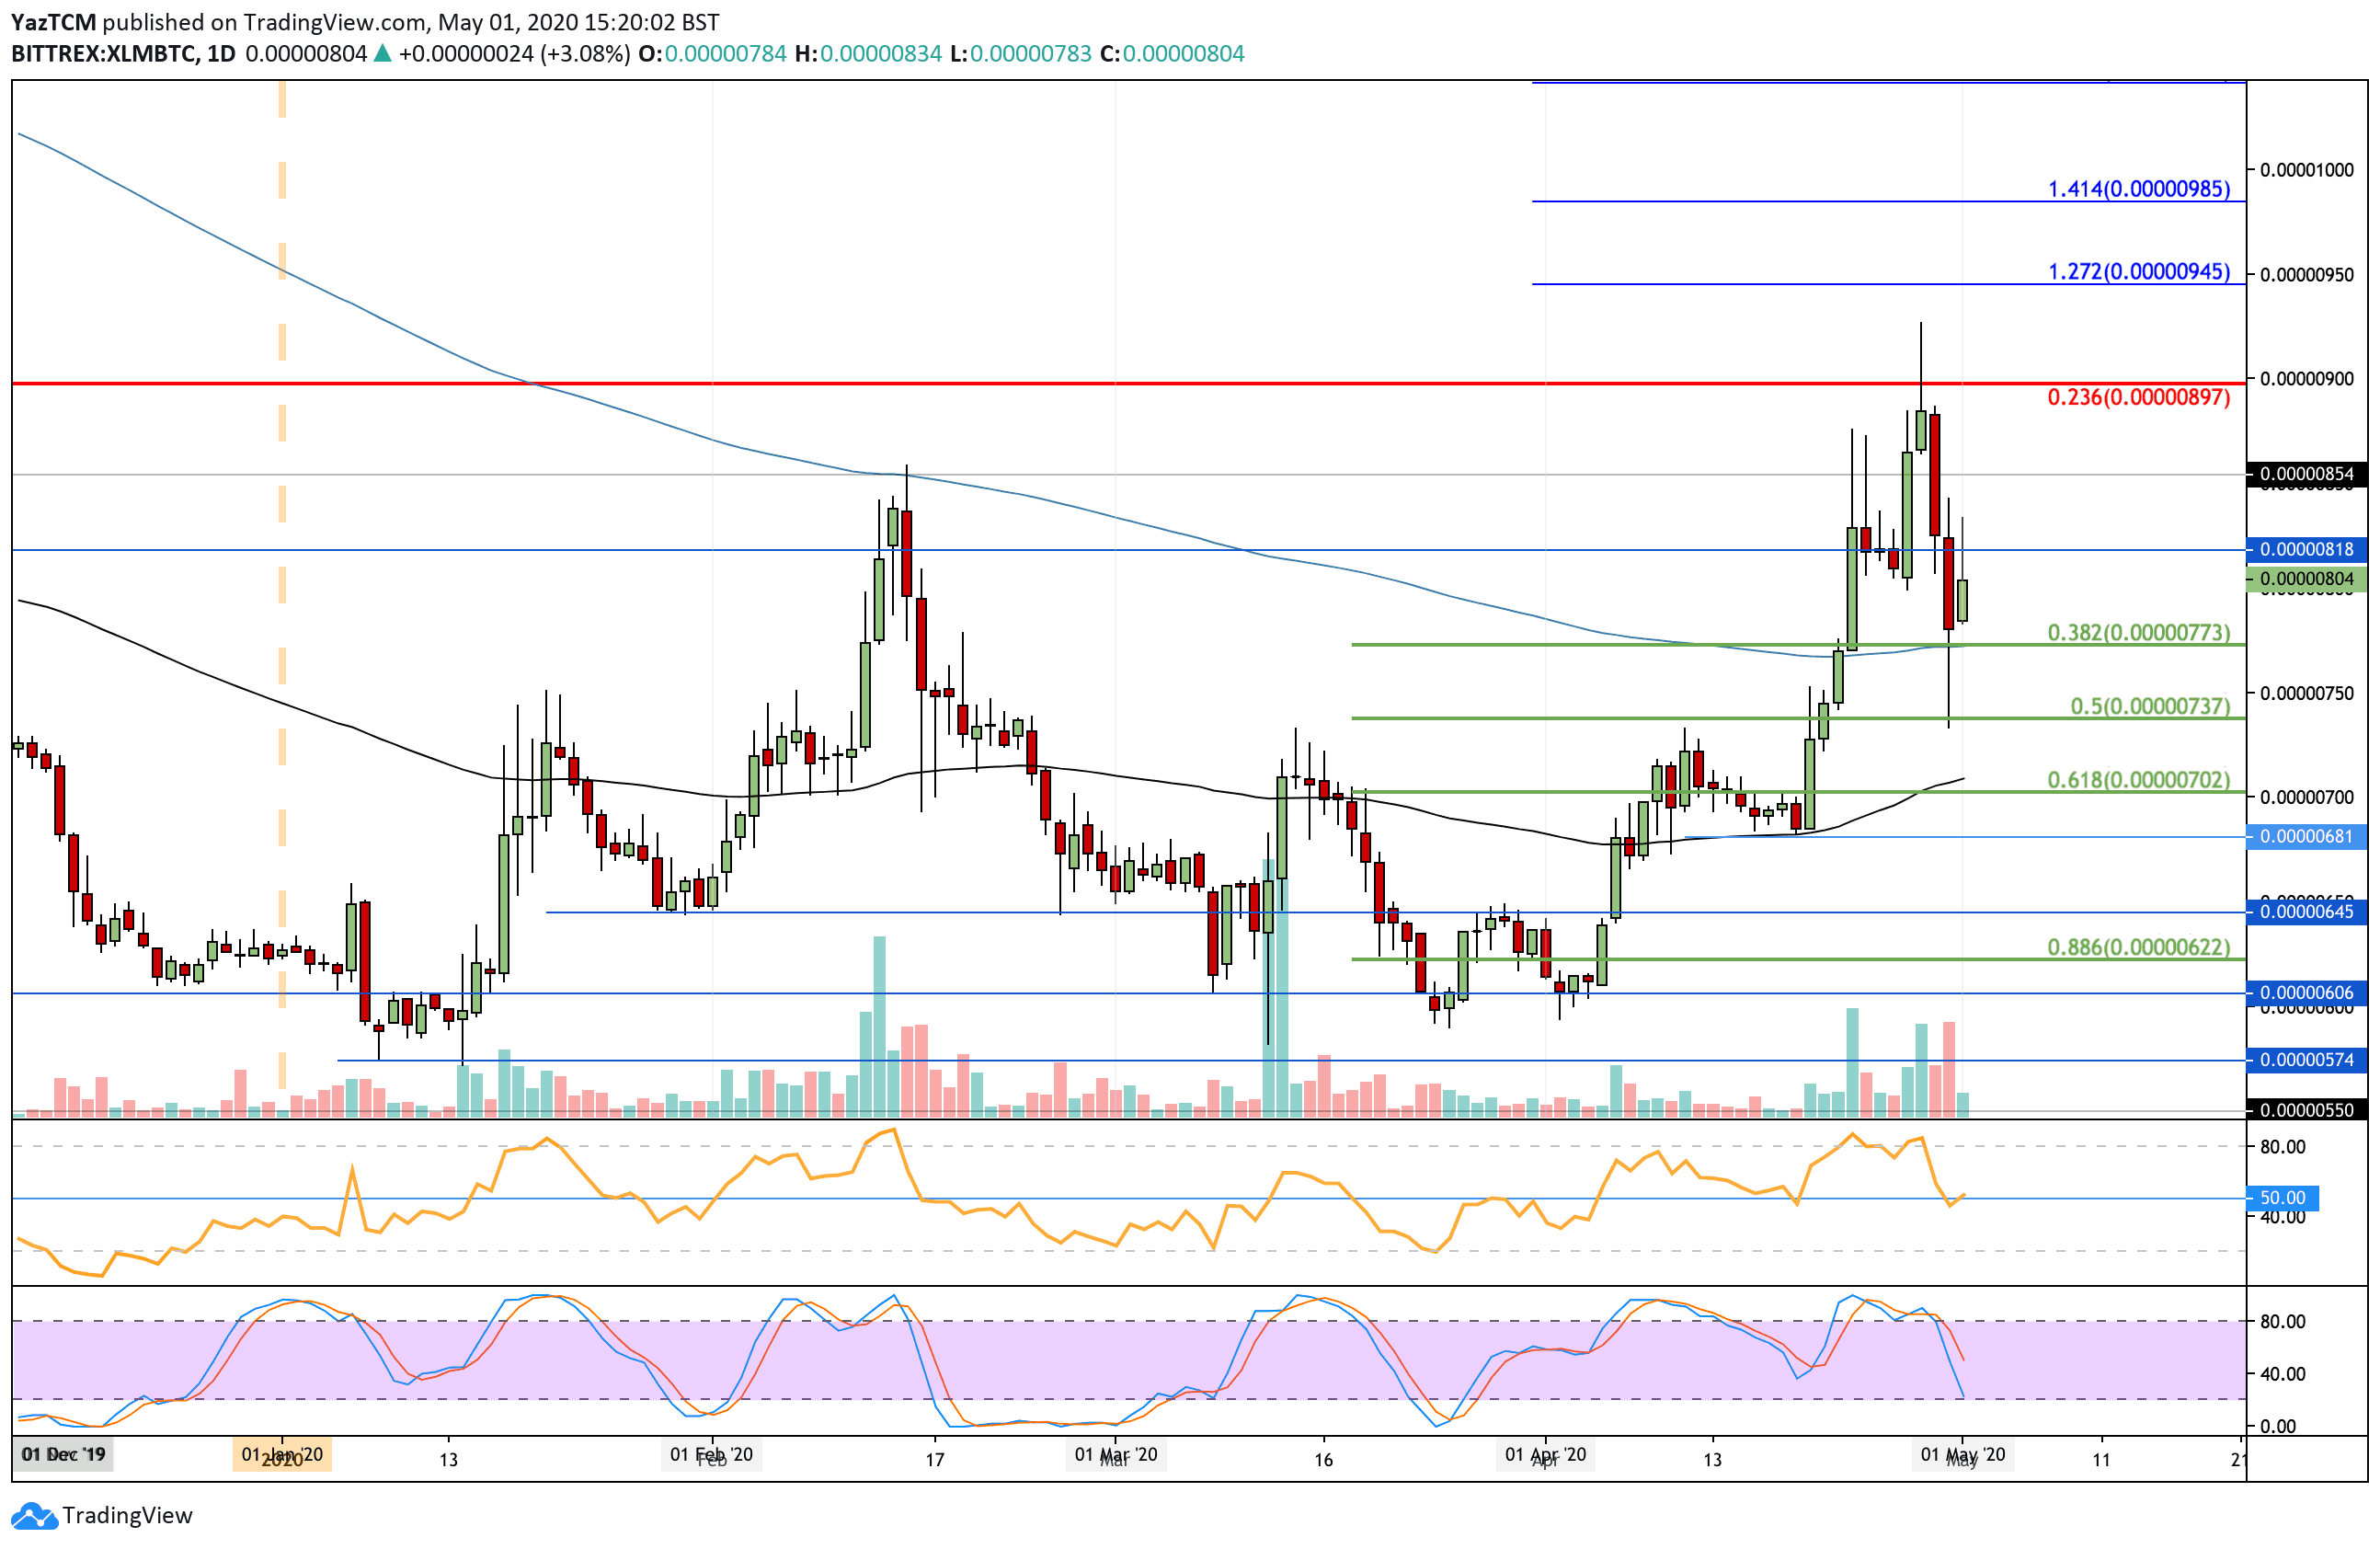
Against BTC, XLM managed to clock in a fresh 2020 high at the 927 SAT level this week. Unfortunately, it was unable to close above the 900 SAT level, which caused it to fall. It managed to find support at 727 (.5 Fib Retracement), and it rebounded higher to the current 805 SAT level.
If the bulls continue to drive higher, resistance lies at 820 SAT, 850 SAT, and 900 SAT (bearish .236 Fib Retracement). Above this, resistance lies at 954 SAT (1.272 Fib Extension), 985 SAT (1.414 Fib Extension), and 1000 SAT.
Toward the downside, support lies at 775 SAT (.382 Fib Retracement & 200-days EMA). Beneath this, added support is located at 740 SAT (.5 Fib Retracement), 700 SAT (.618 Fib Retracement), and 680 SAT.
ChainLink
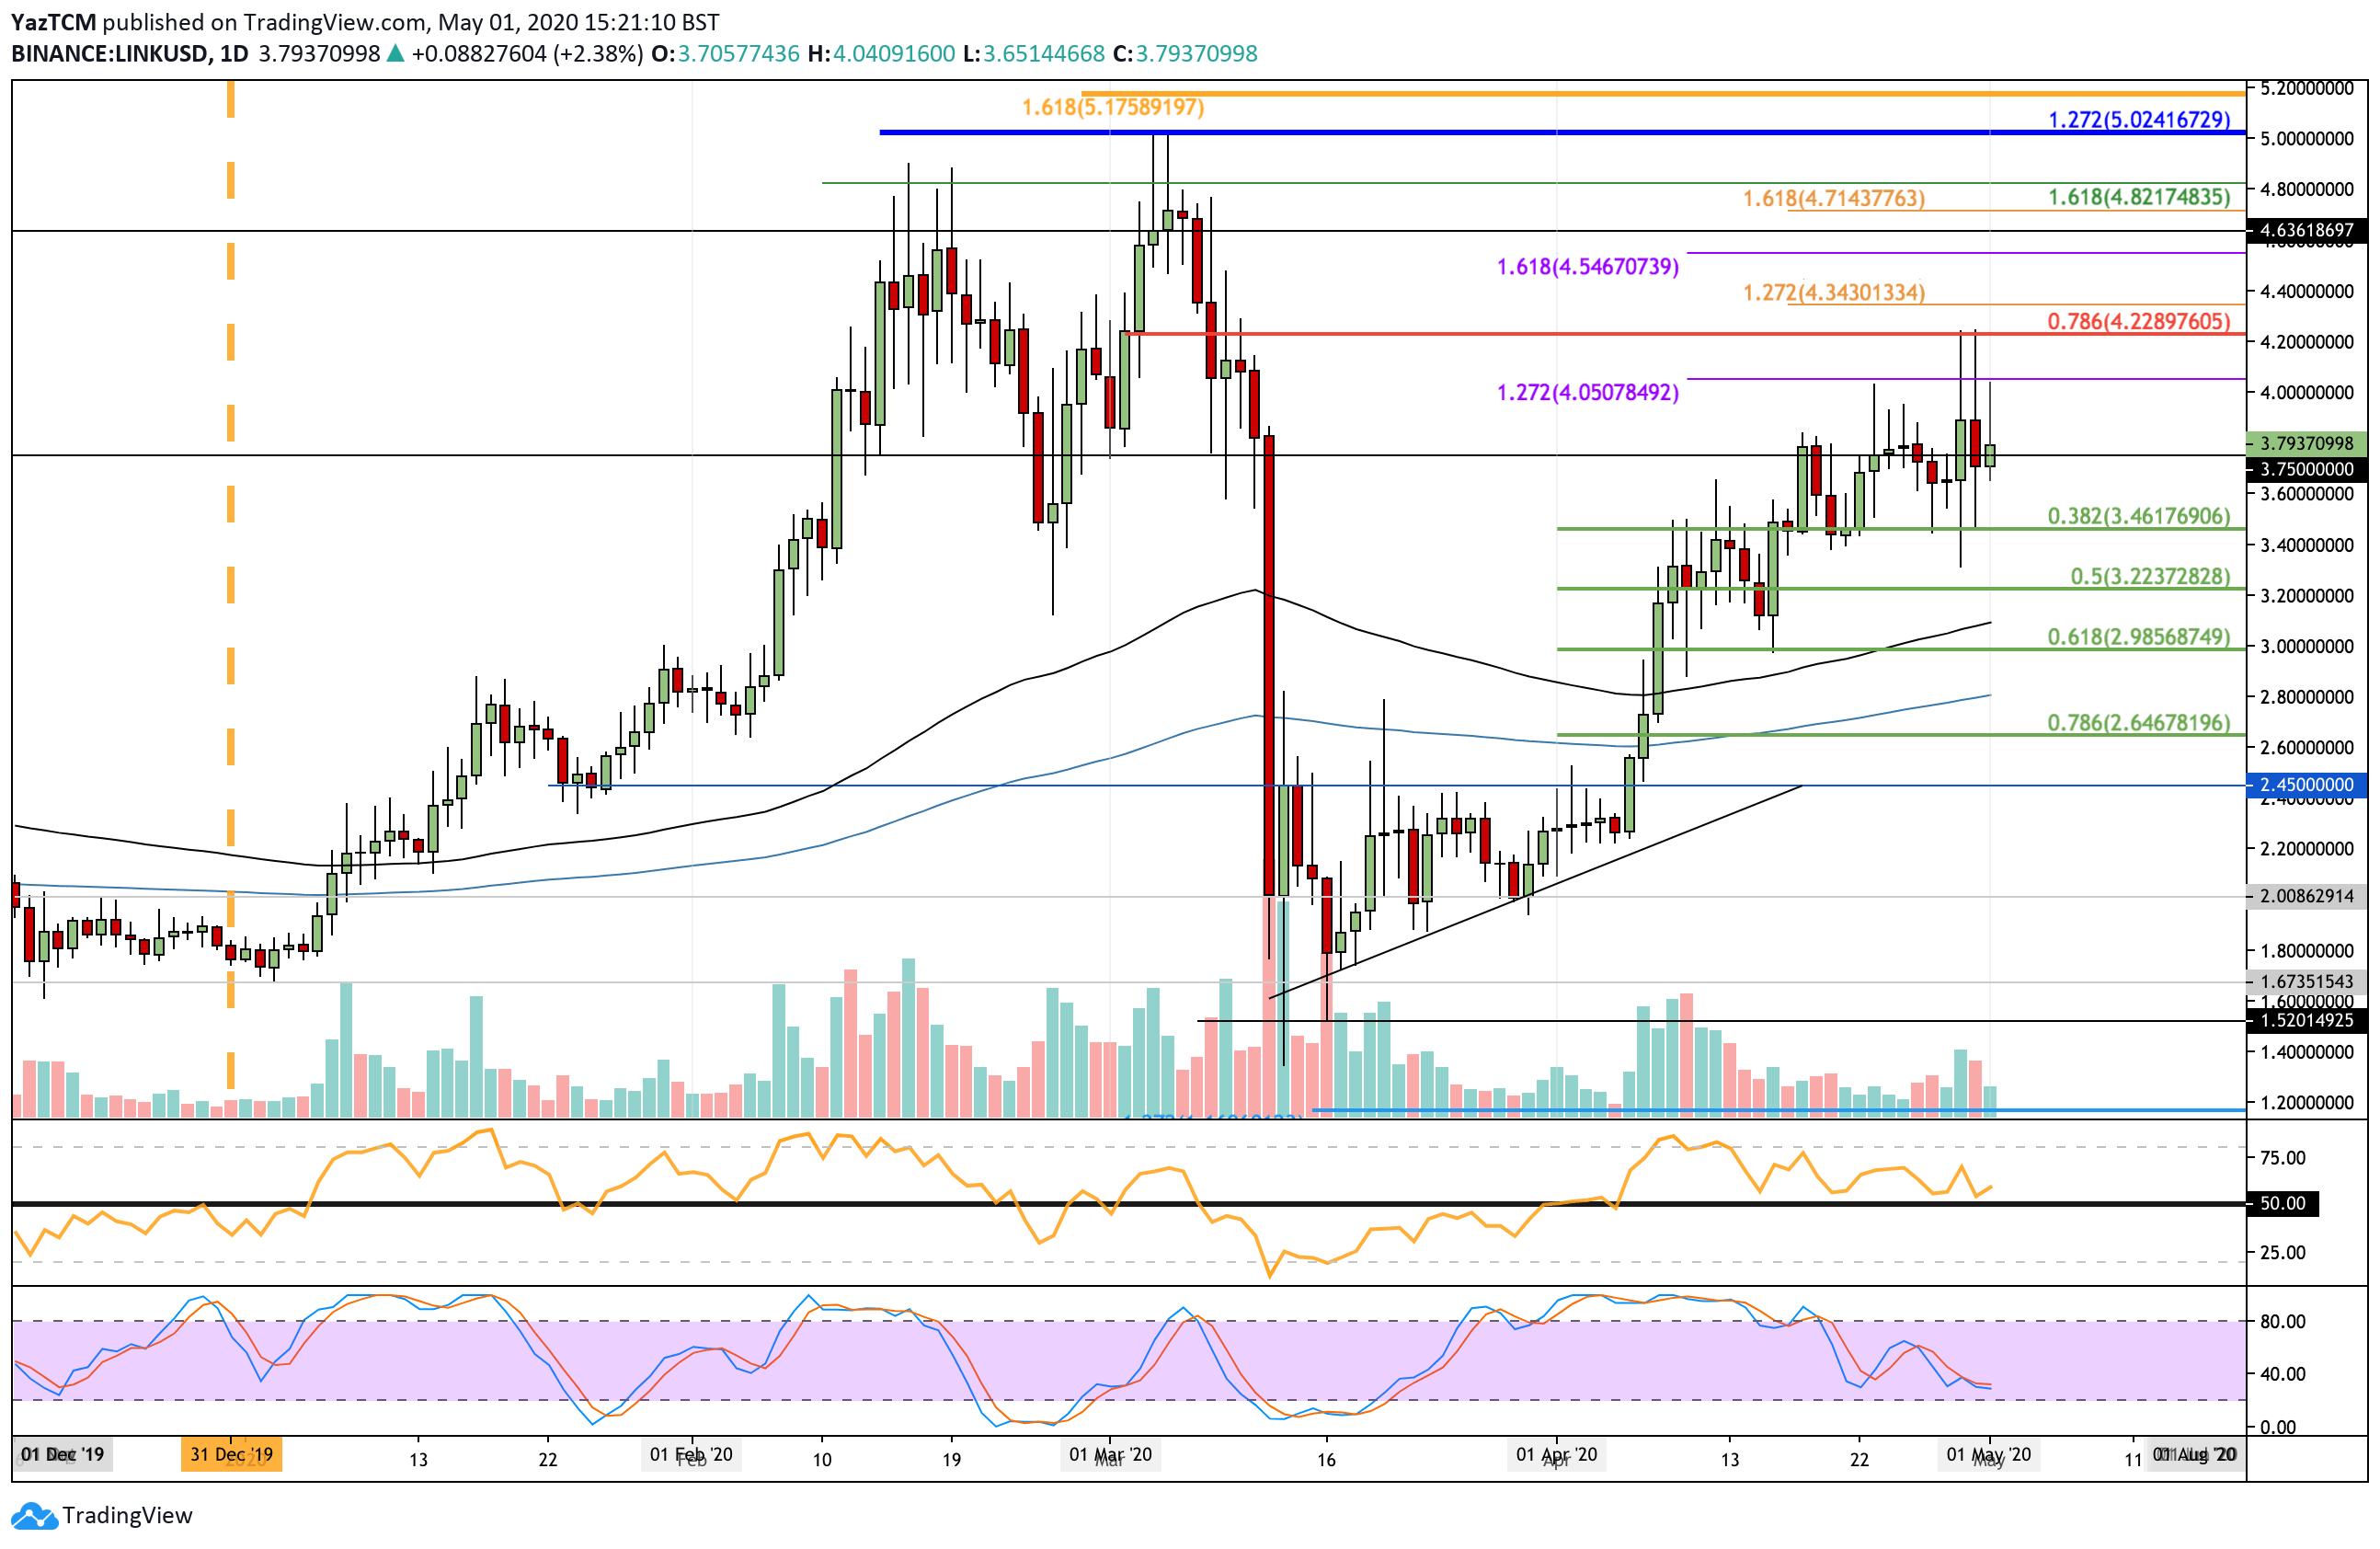
LINK saw a small 0.5% price decline over this past week of trading as the cryptocurrency moves sideways at the $3.80 level. It did manage to spike higher during the week but was unable to overcome the resistance at $4.22 (bearish .786 Fib Retracement level).
Moving forward, if the buyers push higher, the first level of resistance lies at $4.05. Above this, resistance is located at $4.22 (bearish .786 Fib Retracement), $4.34, $4.54, and $4.63.
On the other side, support is located at $3.46 (.382 Fib Retracement), $3.22 (.5 Fib Retracement), and $3.00 (.618 Fib Retracement).
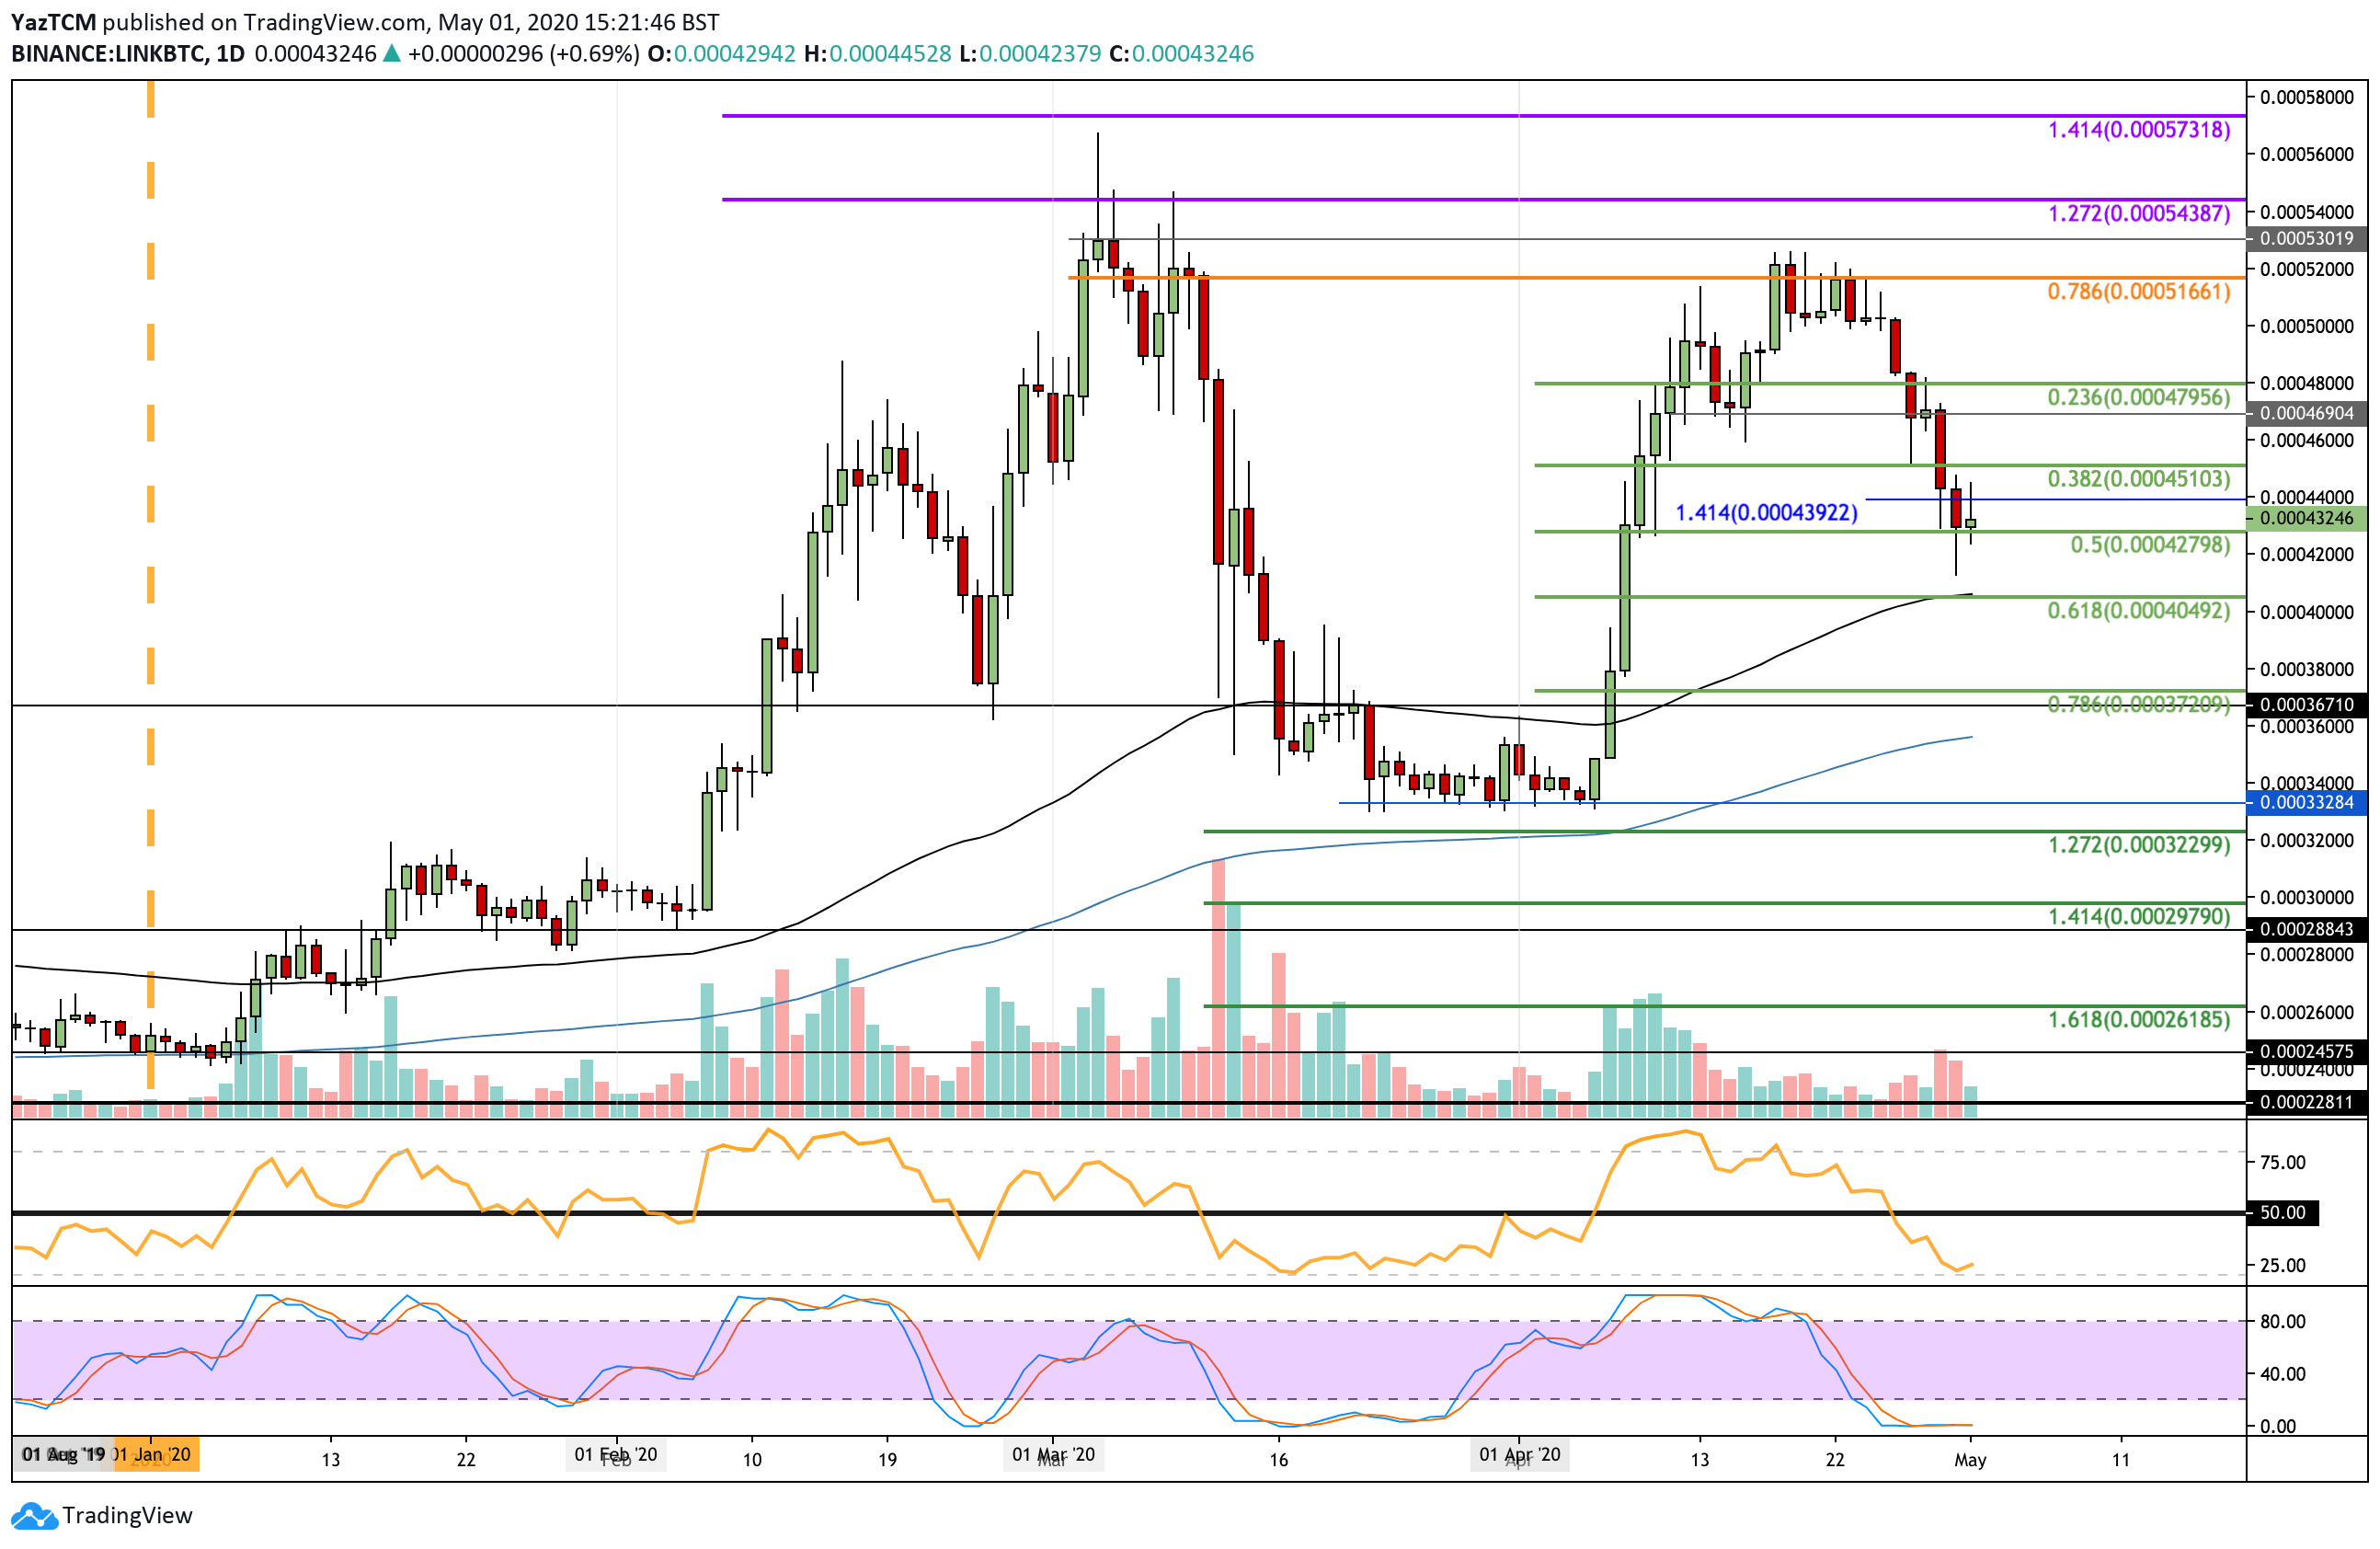
Against BTC, LINK has been suffering throughout the entire week after rolling over from the 0.00051 BTC resistance (bearish .786 Fib Retracement). It continued to drop throughout the week until finding support at 0.000428 BTC (.5 Fib Retracement), where it currently trades.
Looking ahead, if the bulls can rebound from here, resistance is located at 0.00044 BTC, 0.000451 BTC, and 0.00048 BTC. Above this, additional resistance lies at 0.0005 BTC, 0.000516 BTC, and 0.00053 BTC.
Beneath 0.000438 BTC, support can be expected at 0.0004 BTC (.618 Fib Retracement & 200-days EMA), 0.00038 BTC, and 0.00037 BTC (.786 Fib Retracement).
The post Crypto Price Analysis & Overview May 1st: Bitcoin, Ethereum, Ripple, Stellar, and Chainlink appeared first on CryptoPotato.


