Crypto Price Analysis & Overview June 11th: Bitcoin, Ethereum, Ripple, Polkadot, & Matic
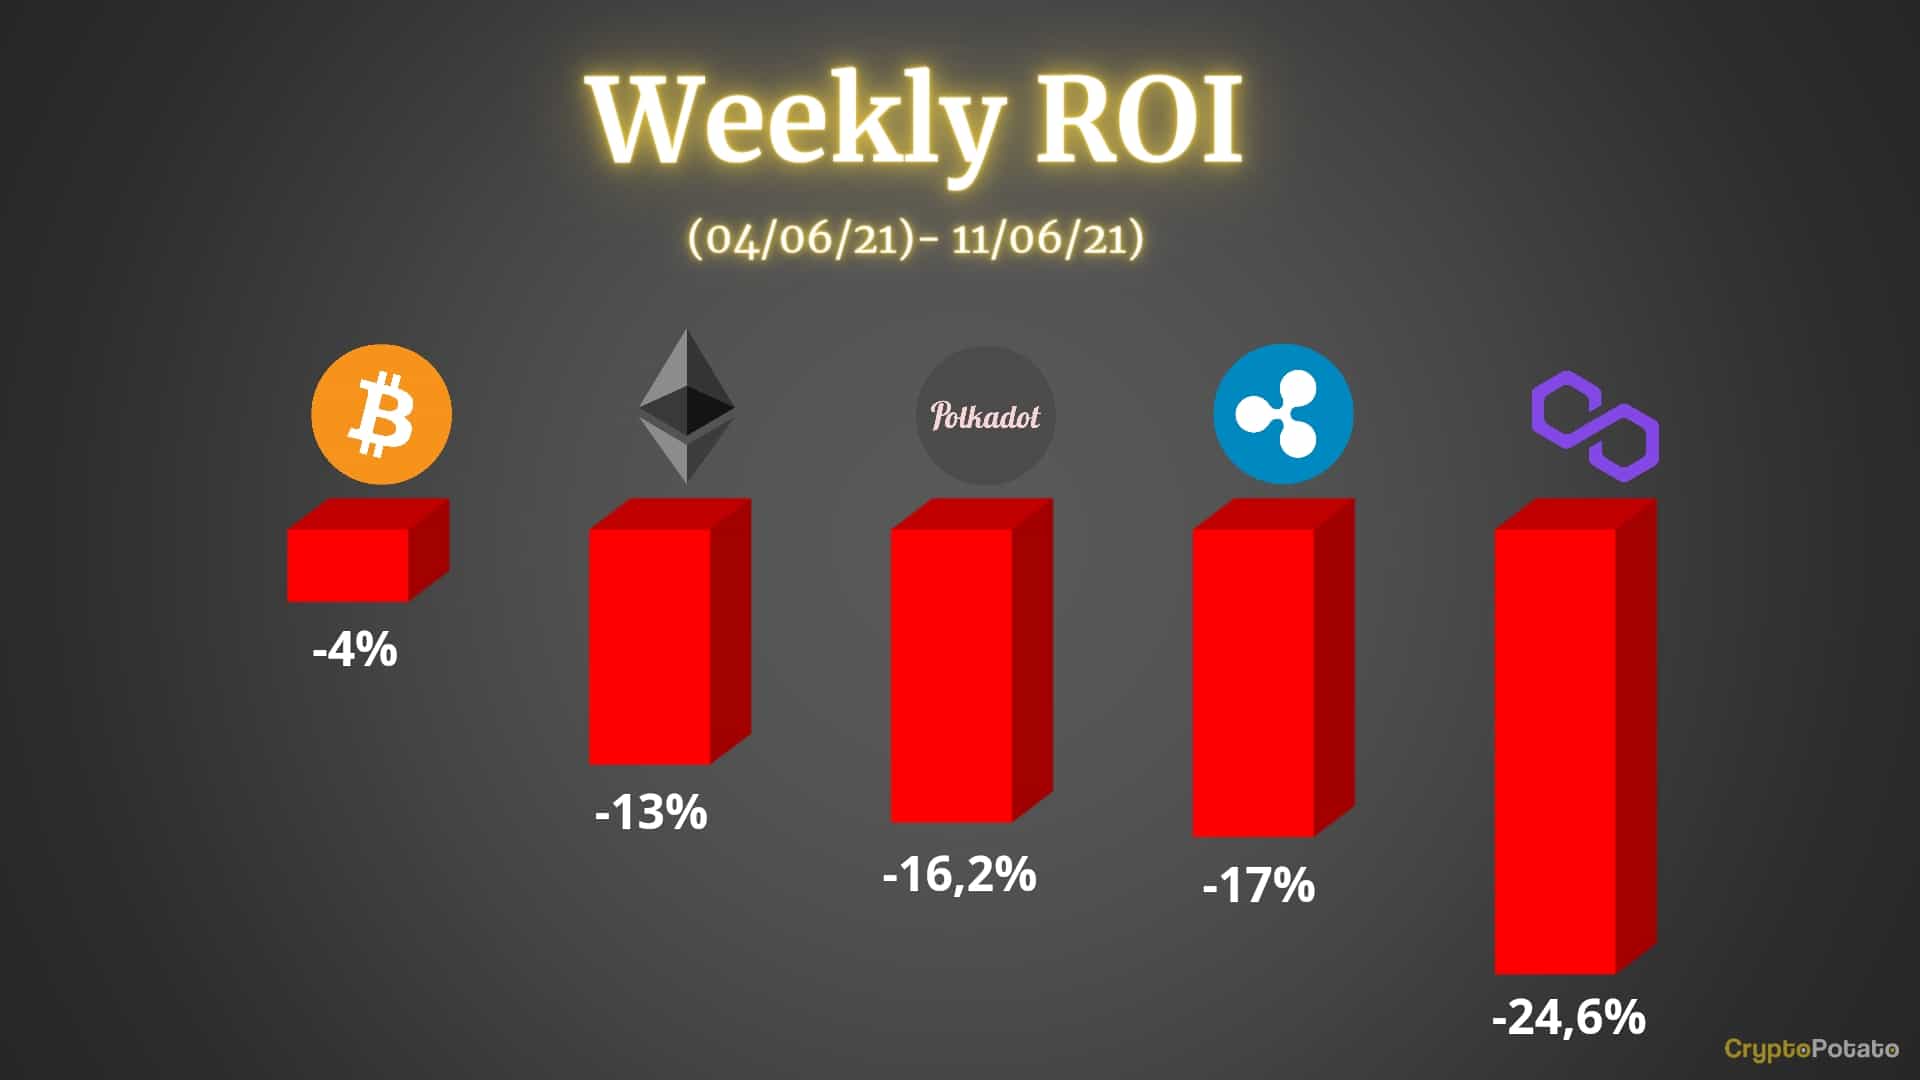
It was a rather unfortunate week for the entire cryptocurrency market as most of the coins are trading in the red. Bitcoin is no exclusion, though it’s the one the best performer, relatively speaking, compared to major altcoins.
Bitcoin
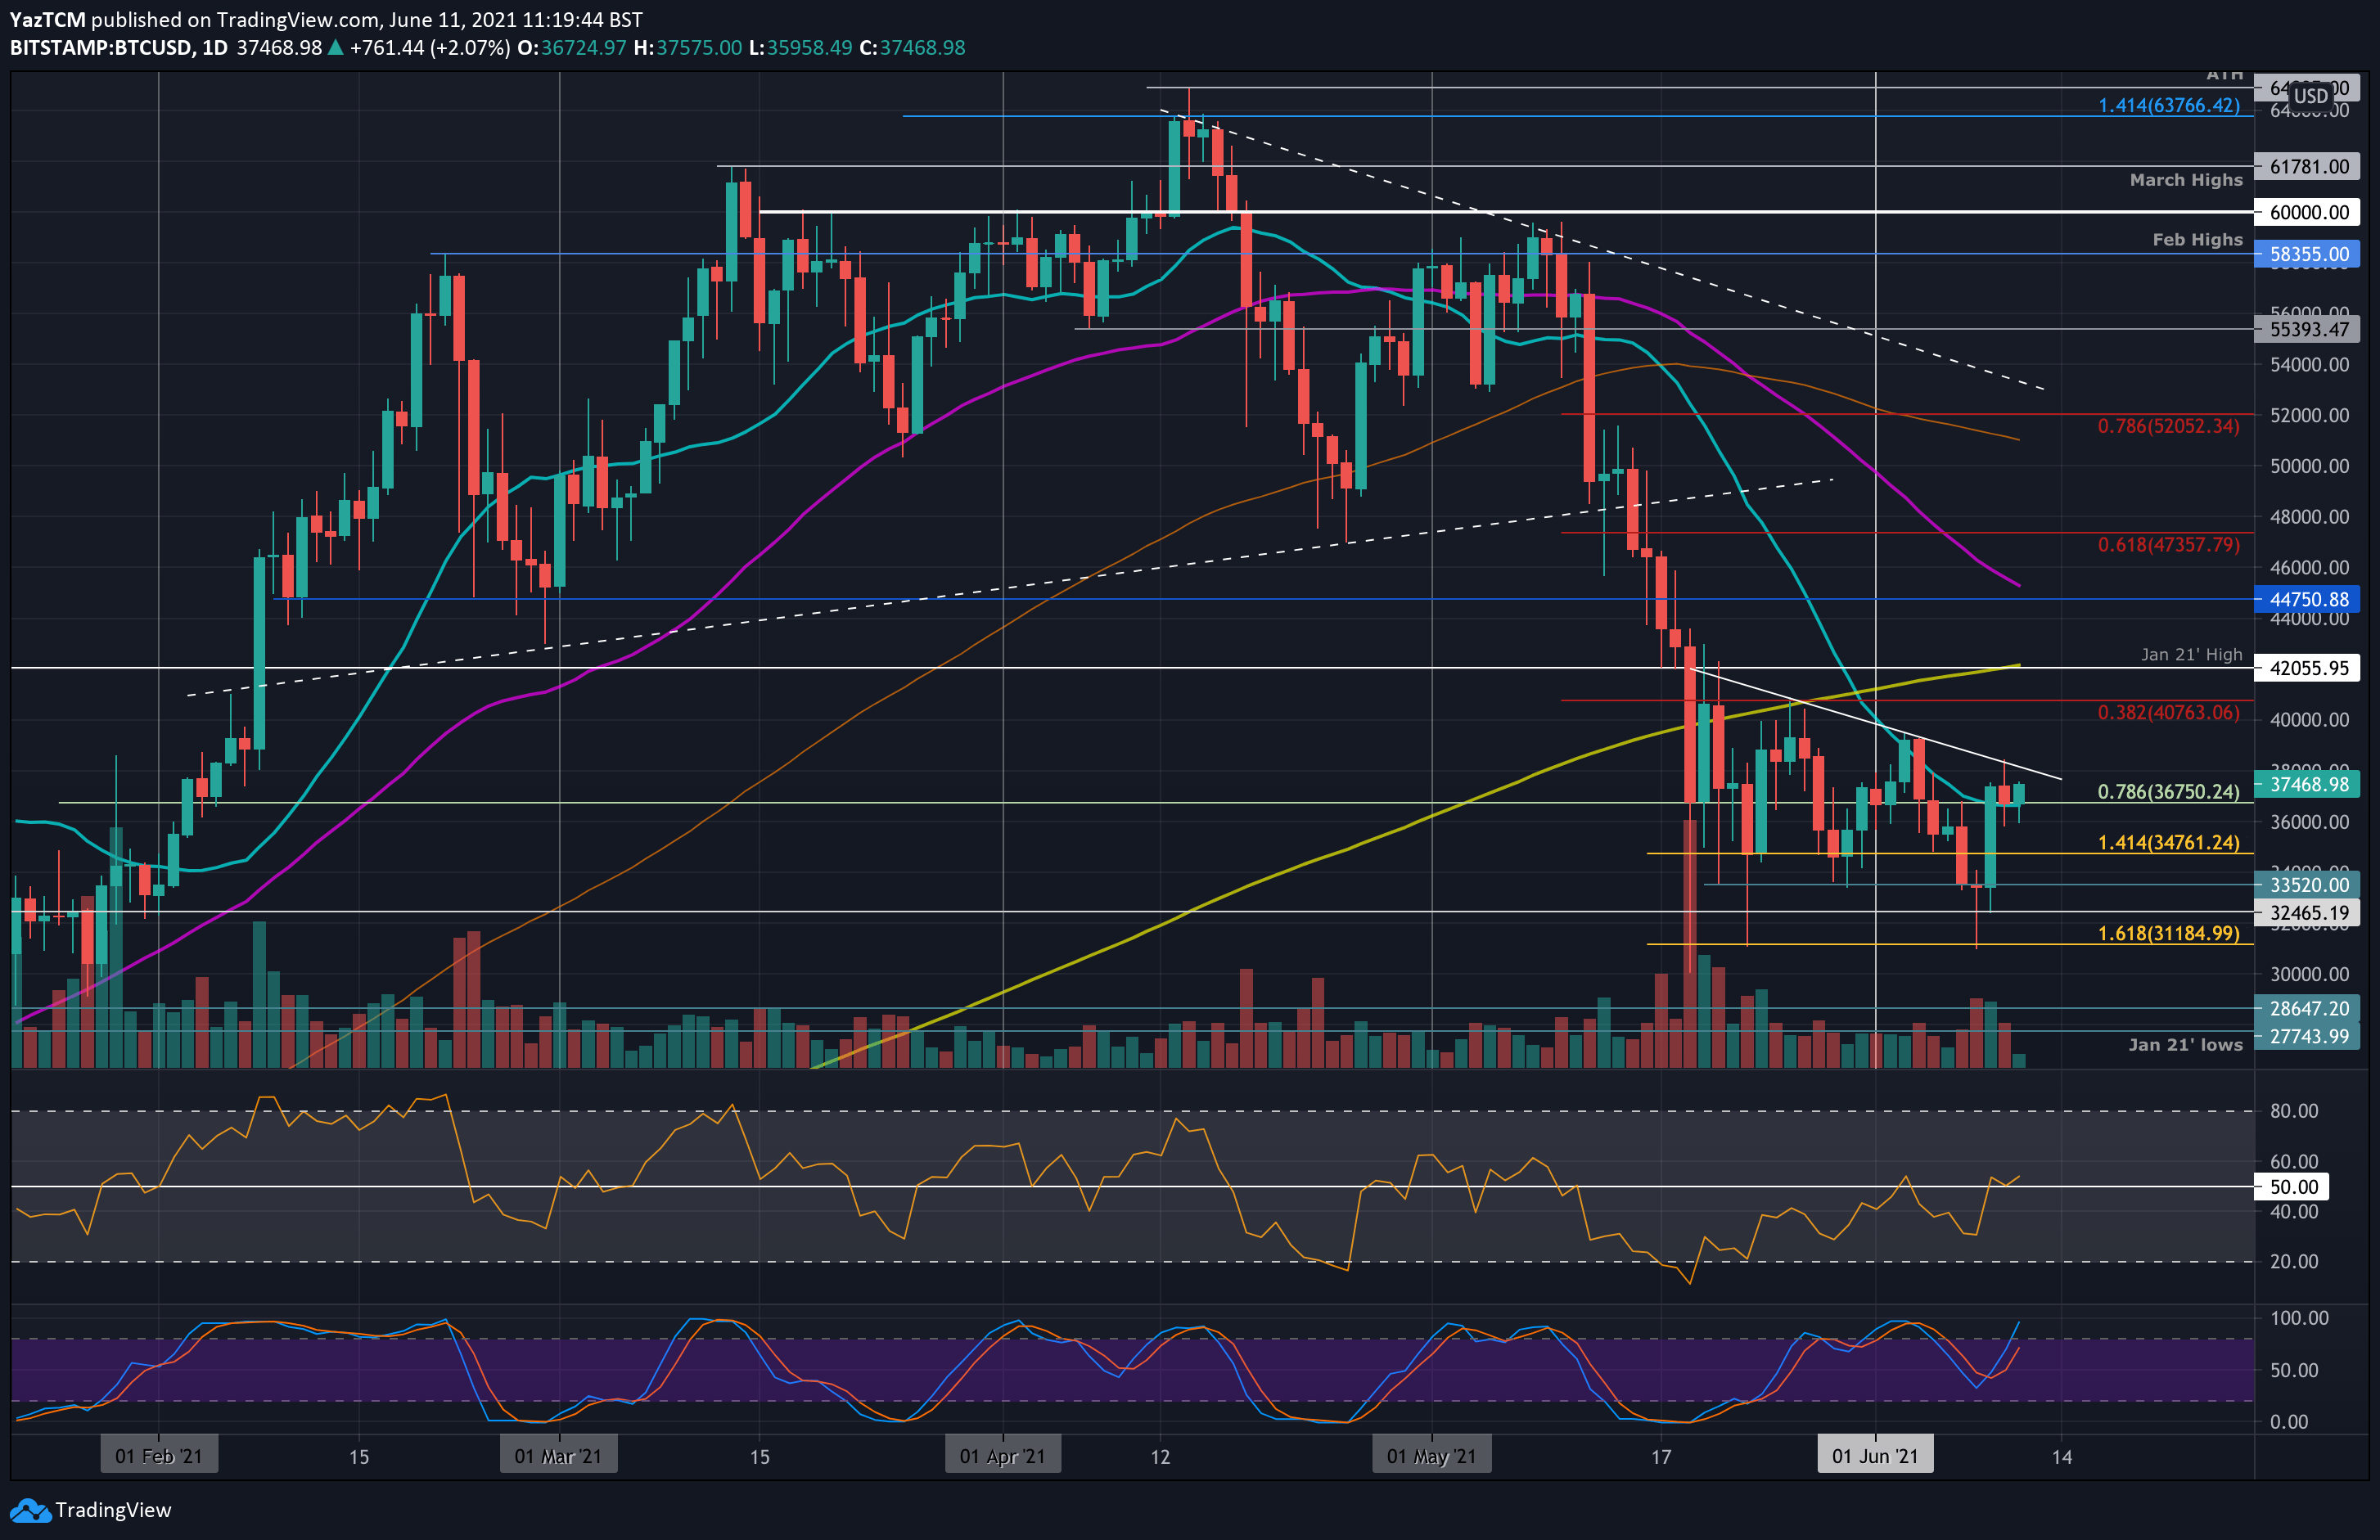
Bitcoin is down by a small 4% over the past week as it currently sits above the 20-day MA at $37,000. The cryptocurrency saw an interesting week after testing $39,200 last week. There, it found resistance at a falling trend line and failed to overcome it.
It rolled over from there and started to head lower as the week progressed. On Monday, it dropped beneath $36,000 and spiked as low as $31,000 on Tuesday. It quickly rebounded from this weekly low and ended up closing Tuesday’s daily candle above $33,500.
From there, BTC started to turn quite optimistic after being able to surge on Wednesday to break resistance at the 20-day MA at $37,000. Yesterday, BTC surged back above $38,000 but found resistance at the same falling trend line it struggled with last week. Nevertheless, it is still above the 20-day MA today.
Looking ahead, the first resistance lies at $38,000 (falling trend line). This is followed by $39,200 (last week’s high), $40,000, $40,763 (bearish .5 Fib), and $42,000 (July 2021 high & 200-day MA).
On the other side, the first support lies at $36,750 (.786 Fib & 20-day MA). This is followed by $36,000, $34,760 (downside 1.414 Fib Extension), $33,500, $32,465, and $31,000.
Ethereum
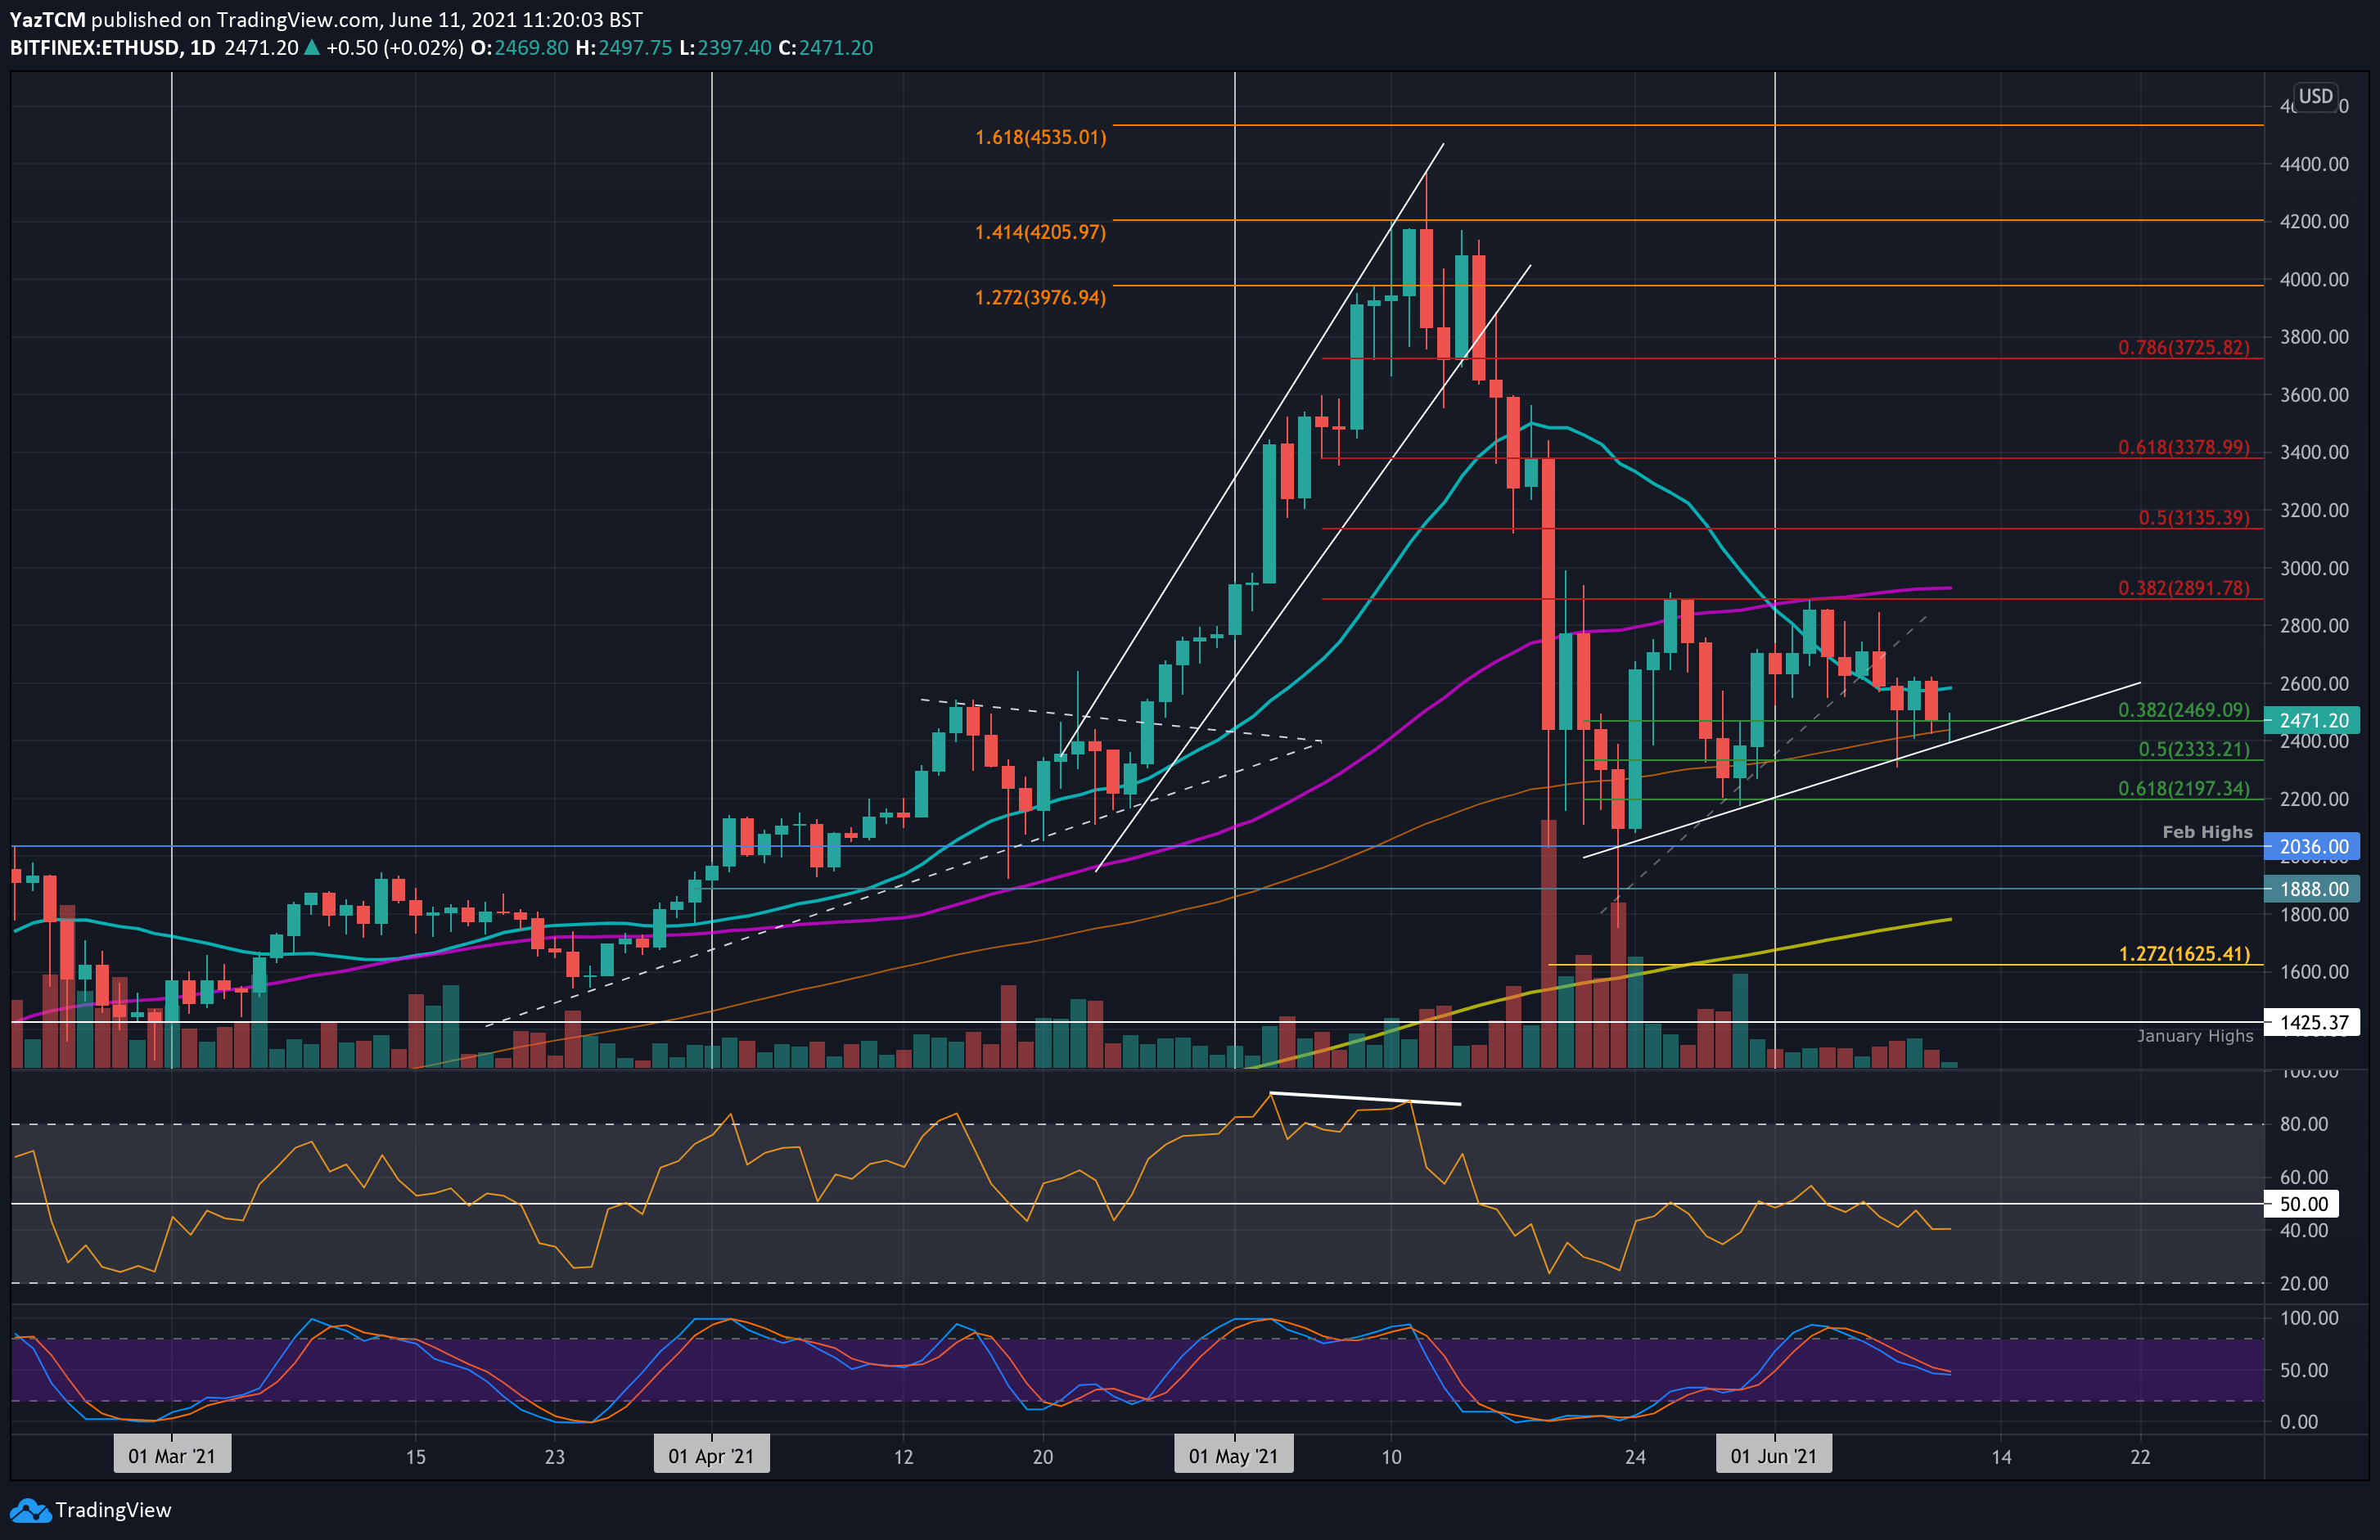
Ethereum is down by a strong 13% this week as the cryptocurrency breaks beneath $2,500 again today. Last week, Ethereum was trading inside an ascending triangle pattern with the roof of the triangle at $2891 (bearish .382 Fib). It failed to overcome this resistance and started to head lower throughout the week.
On Monday, ETH fell beneath the previous ascending price channel and spiked as low as $2330 on Tuesday. However, it quickly bounced higher by the end of the day to close above $2470 (.382 Fib). Since then, ETH has managed to remain above this support and is battling to keep above it today.
Looking ahead, if the market drops beneath $2470, the first support lies at $2400 (100-day MA & rising trend line). This is followed by 2330 (.5 Fib), 2200 (.618 Fib), and $2035 (Feb 2021 highs).
On the other side, the first resistance lies at $2600 (20-day MA0. This is followed by $2800, $2890 (bearish .382 Fib & 50-day MA), $3000, and $3135 (bearish .5 Fib).
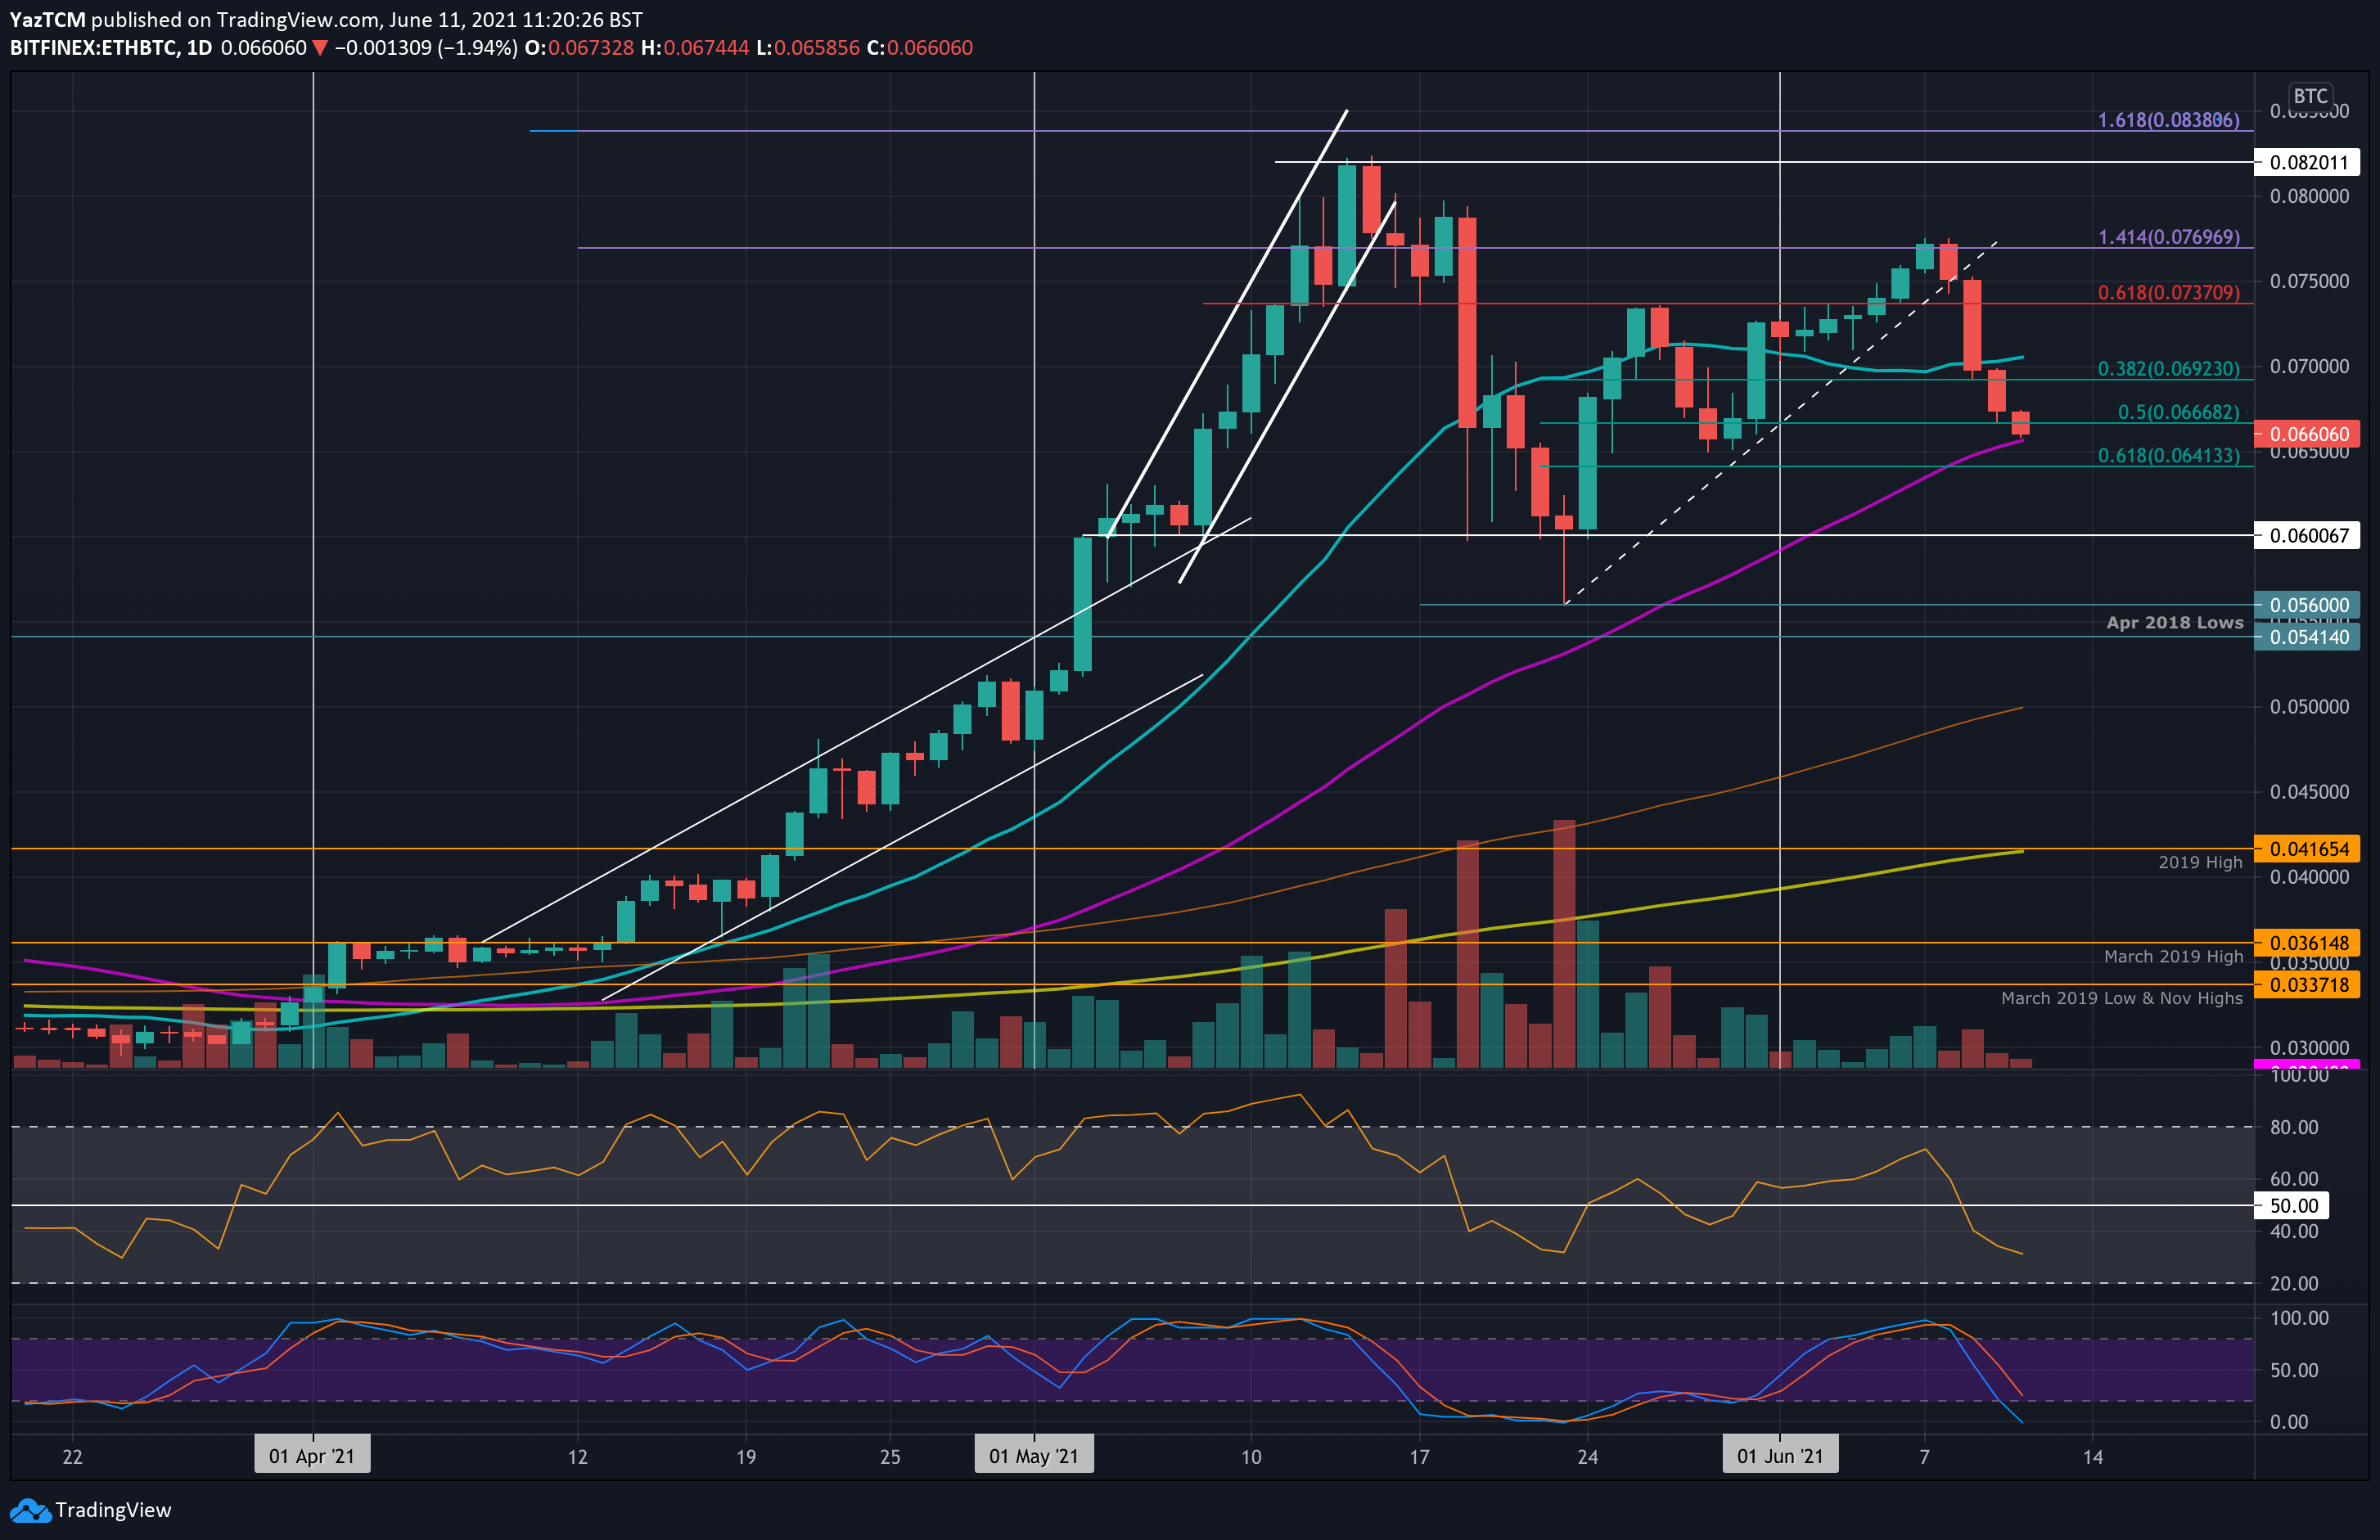
ETH is struggling this week against BTC. The coin had set a new high for June at the start of the week as it surged into 0.077 BTC (1.414 Fib extension). Unfortunately, it rolled over from there and started to head lower. On Wednesday, ETH collapsed beneath 0.075 BTC and dropped to 0.07 BTC (20-day MA).
Over the past two days, ETH continued lower from the 20-day MA as it broke beneath 0.07 BTC to reach the current 0.066 BTC level (50-day MA).
Looking ahead, if the sellers push beneath the 50-day MA, the first support lies at 0.0641 BTC (.618 Fib). This is followed by 0.062 BTC, 0.06 BTC, and 0.056 BTC (late-May lows).
On the other side, the first strong resistance lies at 0.07 BTC (20-day MA). This is followed by 0.0737 BTC (bearish .618 Fib), 0.077 BTC (1.414 Fib Extension), and 0.08 BTC.
Ripple
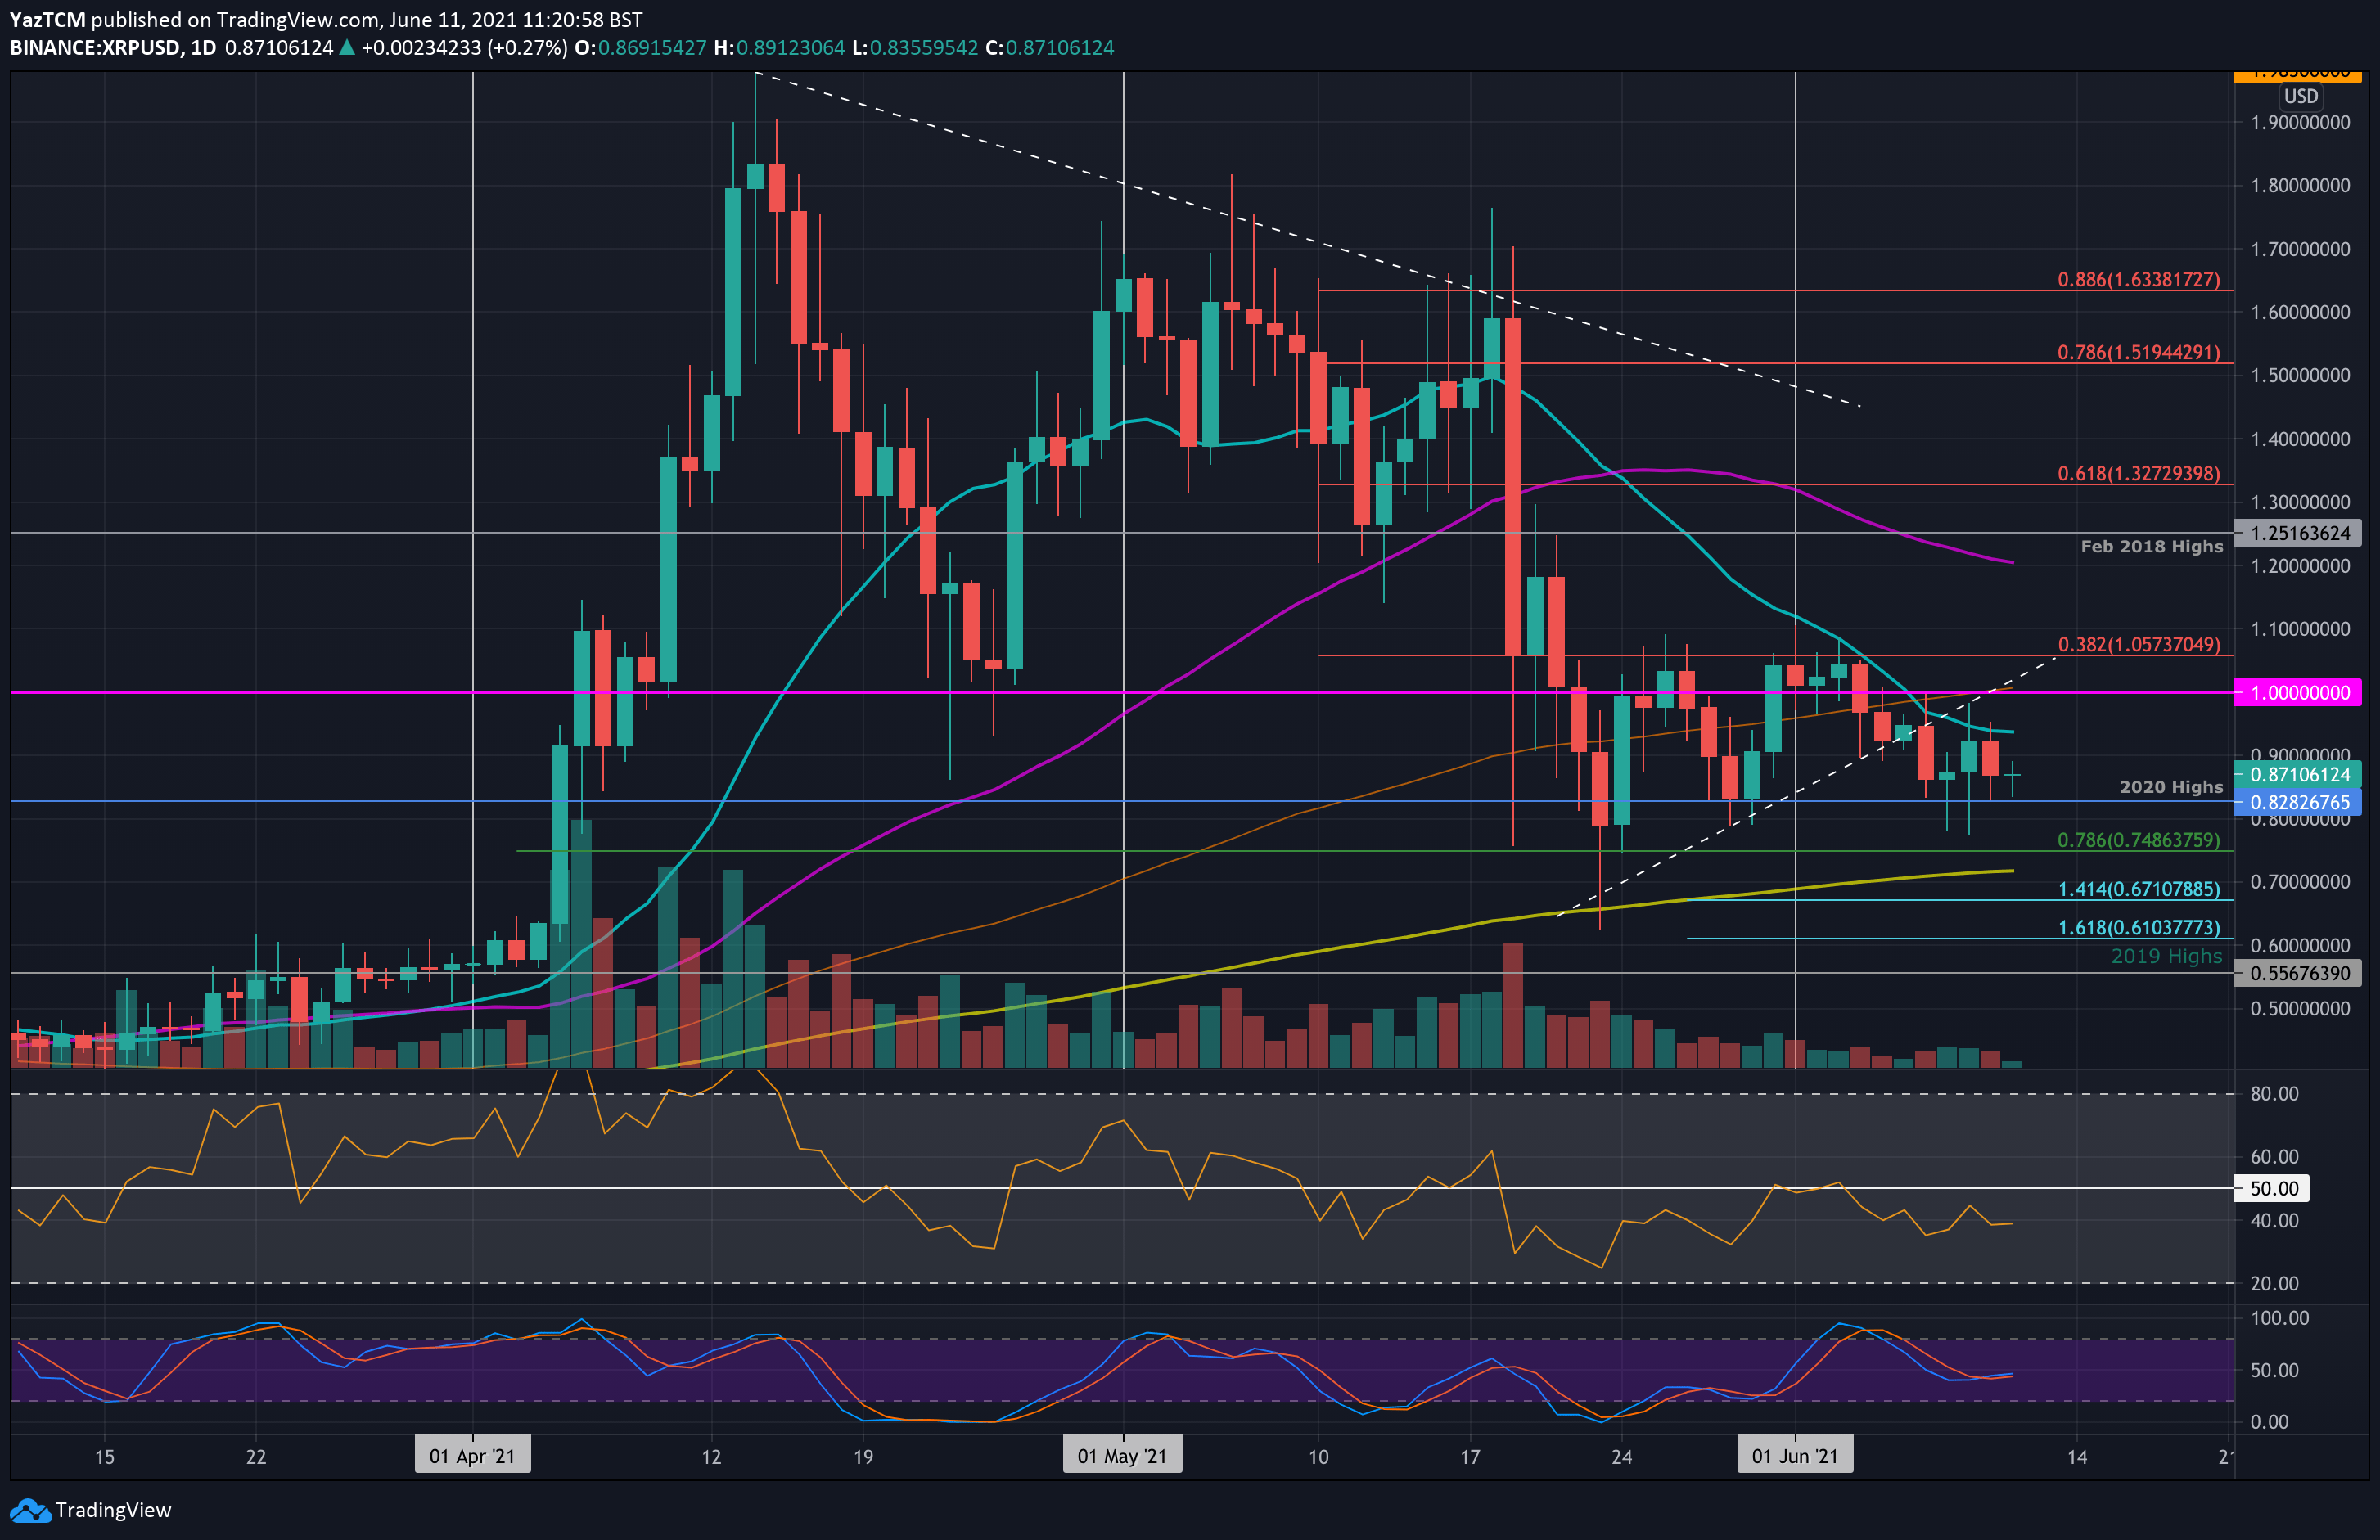
Ripple is down by a steep 17% this week as the cryptocurrency trades beneath $0.09. It was trading inside an ascending triangle pattern last week but failed to overcome the upper boundary of the pattern at $1.05.
It dropped beneath $1.00 over the weekend and continued beneath the triangle on Monday. Since then, it headed lower throughout the week but managed to establish support at $0.8282 (2020 highs).
Looking ahead, the first support lies at $0.8282. This is followed by $0.8, $0.75 (.786 Fib), $0.7 (200-day MA), and $0.671 (downside 1.414 Fib Extension).
On the other side, the first resistance lies at $0.94 (20-day MA). This is followed by $1.00, $1.05, $1.20 (50-day MA), and $1.25 (Feb 2018 highs).
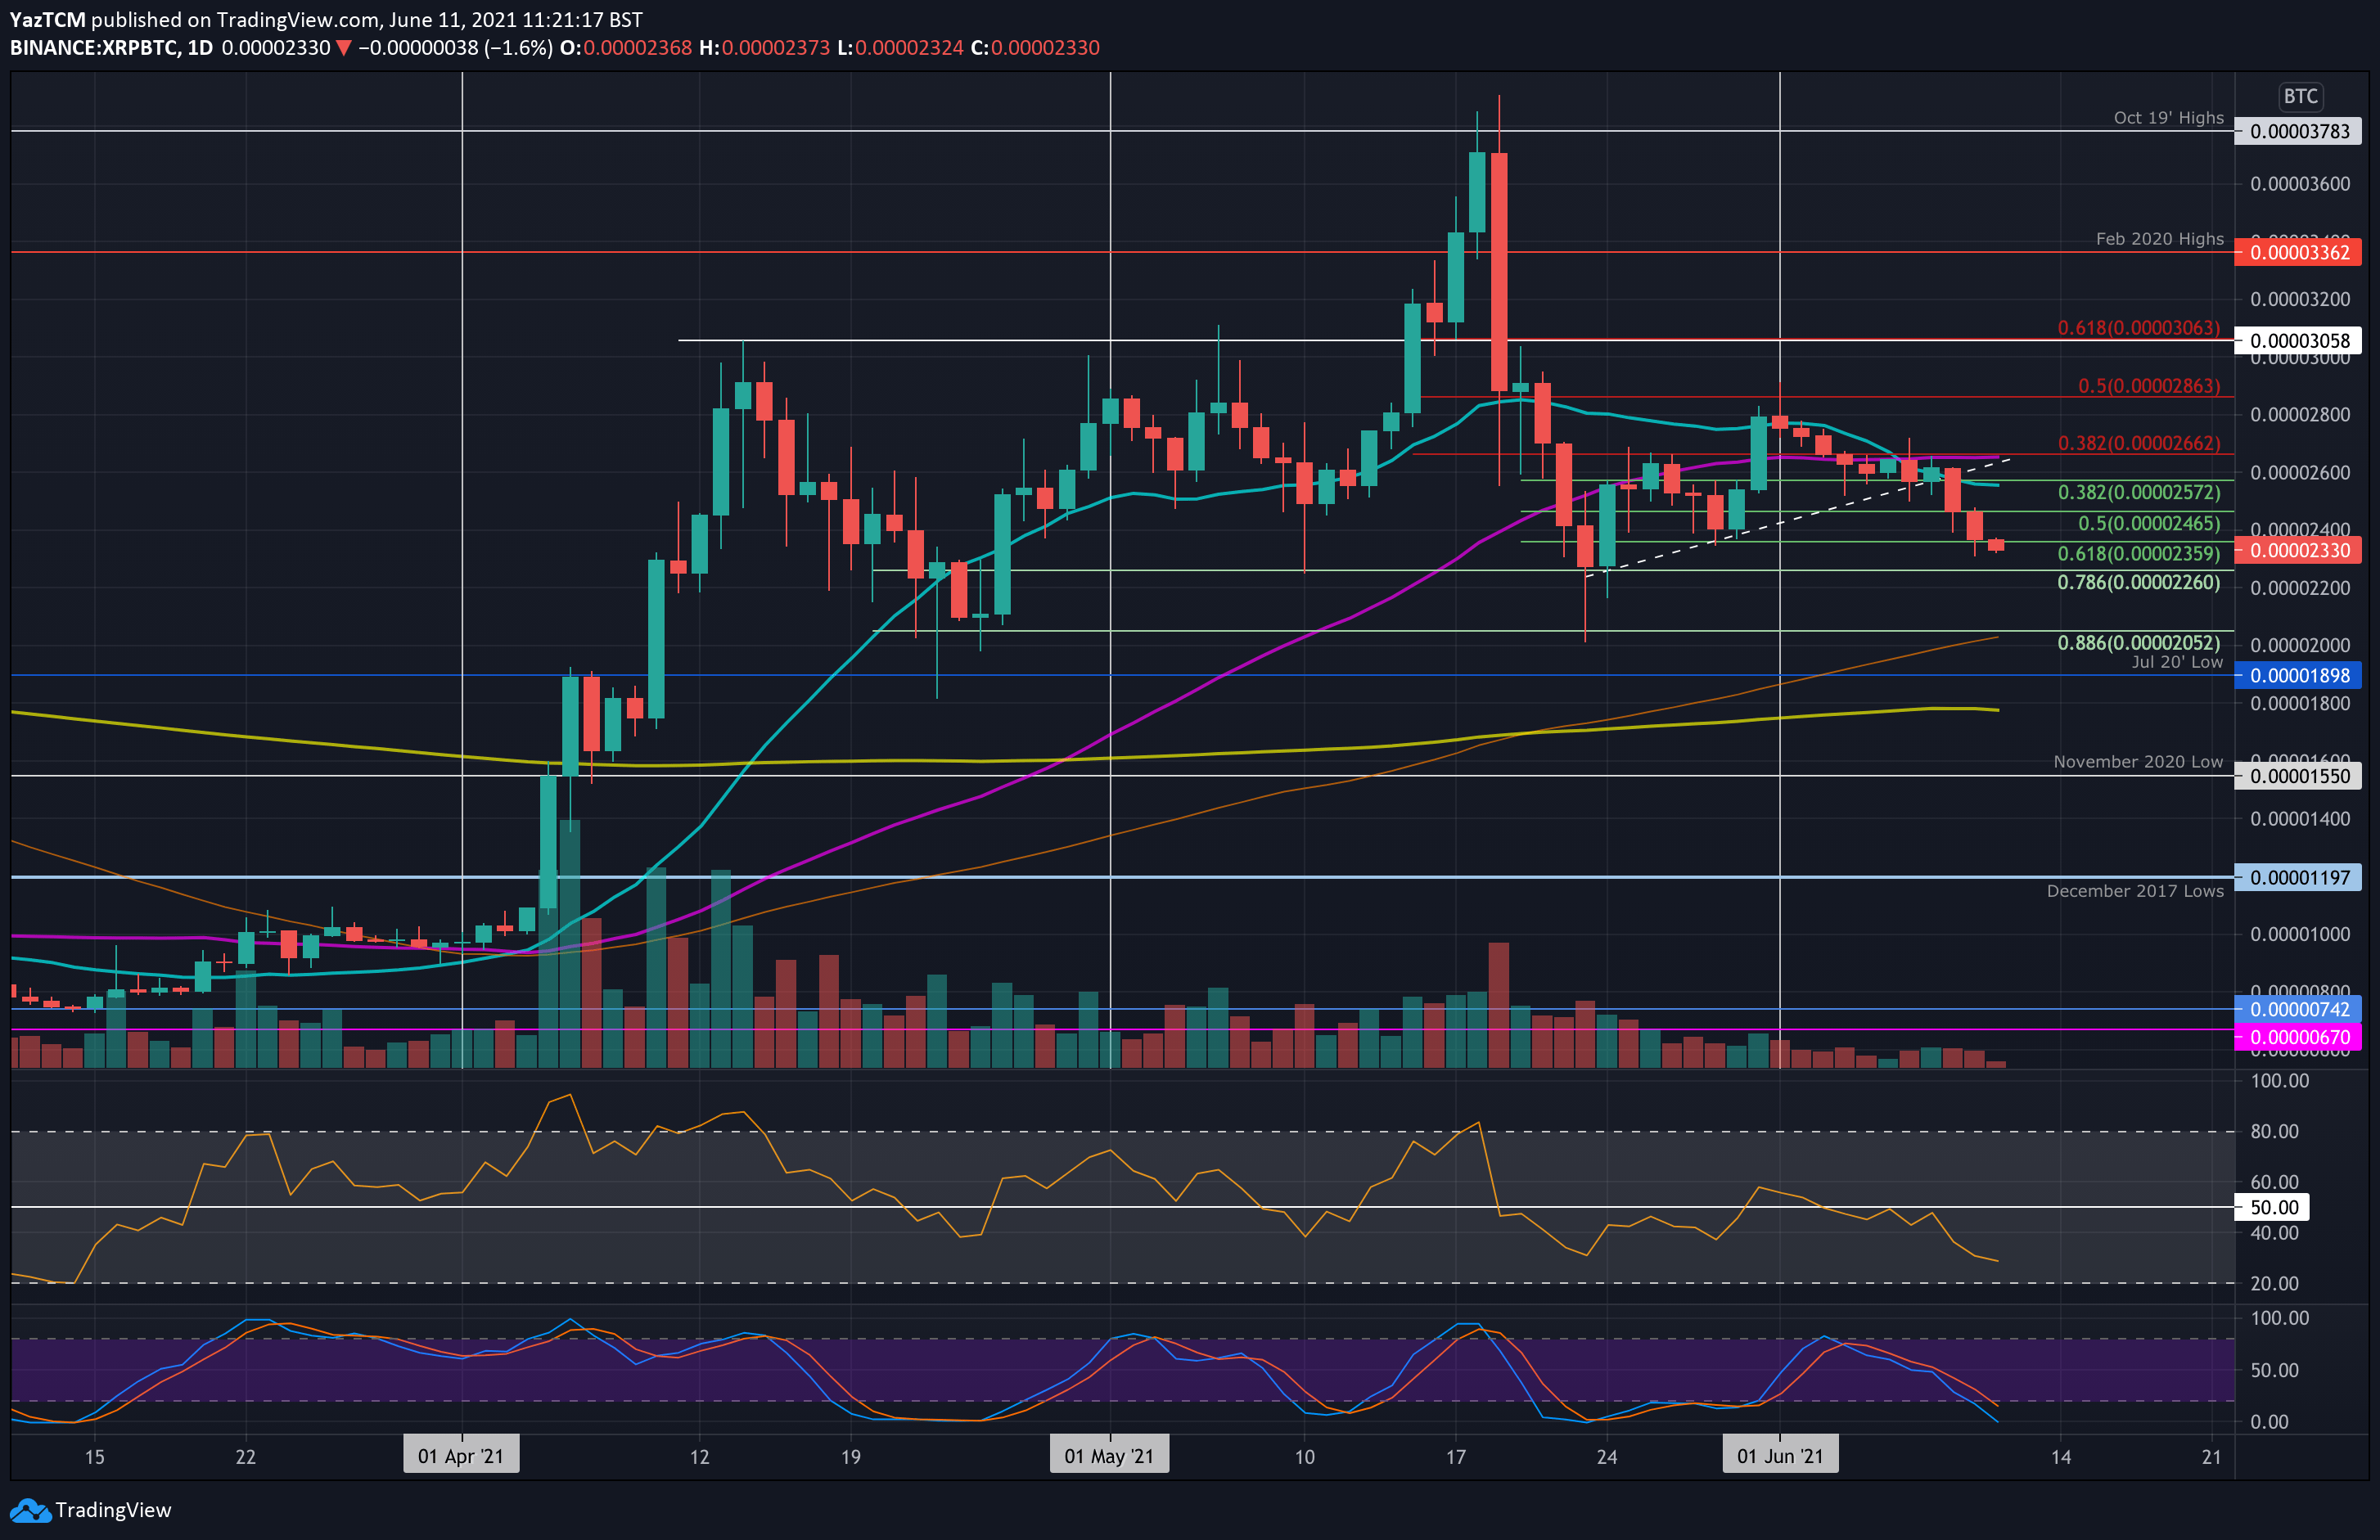
Against bitcoin, XRP struggled to break resistance at 2660 SAT (50-day MA) at the start of the week and started to head lower. It initially found support at 2465 SAT (.5 Fib) but continued beneath there yesterday.
The market dropped beneath 2360 SAT (.618 Fib) today as the bears continue to drive XRP back toward the May support levels around 2260 SAT.
Looking ahead, the first support lies at 2260 SAT (.786 Fib). This is followed by 2200 SAT, 200 SAT (50-day MA0, 1900 SAT (July 2020 low), and 1800 SAT (200-day MA).
On the other side, the first resistance lies at 2570 SAT (20-day MA). This is followed by 2660 SAT (50-day MA & bearish .382 Fib), 2800 SAT, 2863 SAT (bearish .5 Fib), and 3000 SAT.
Polkadot
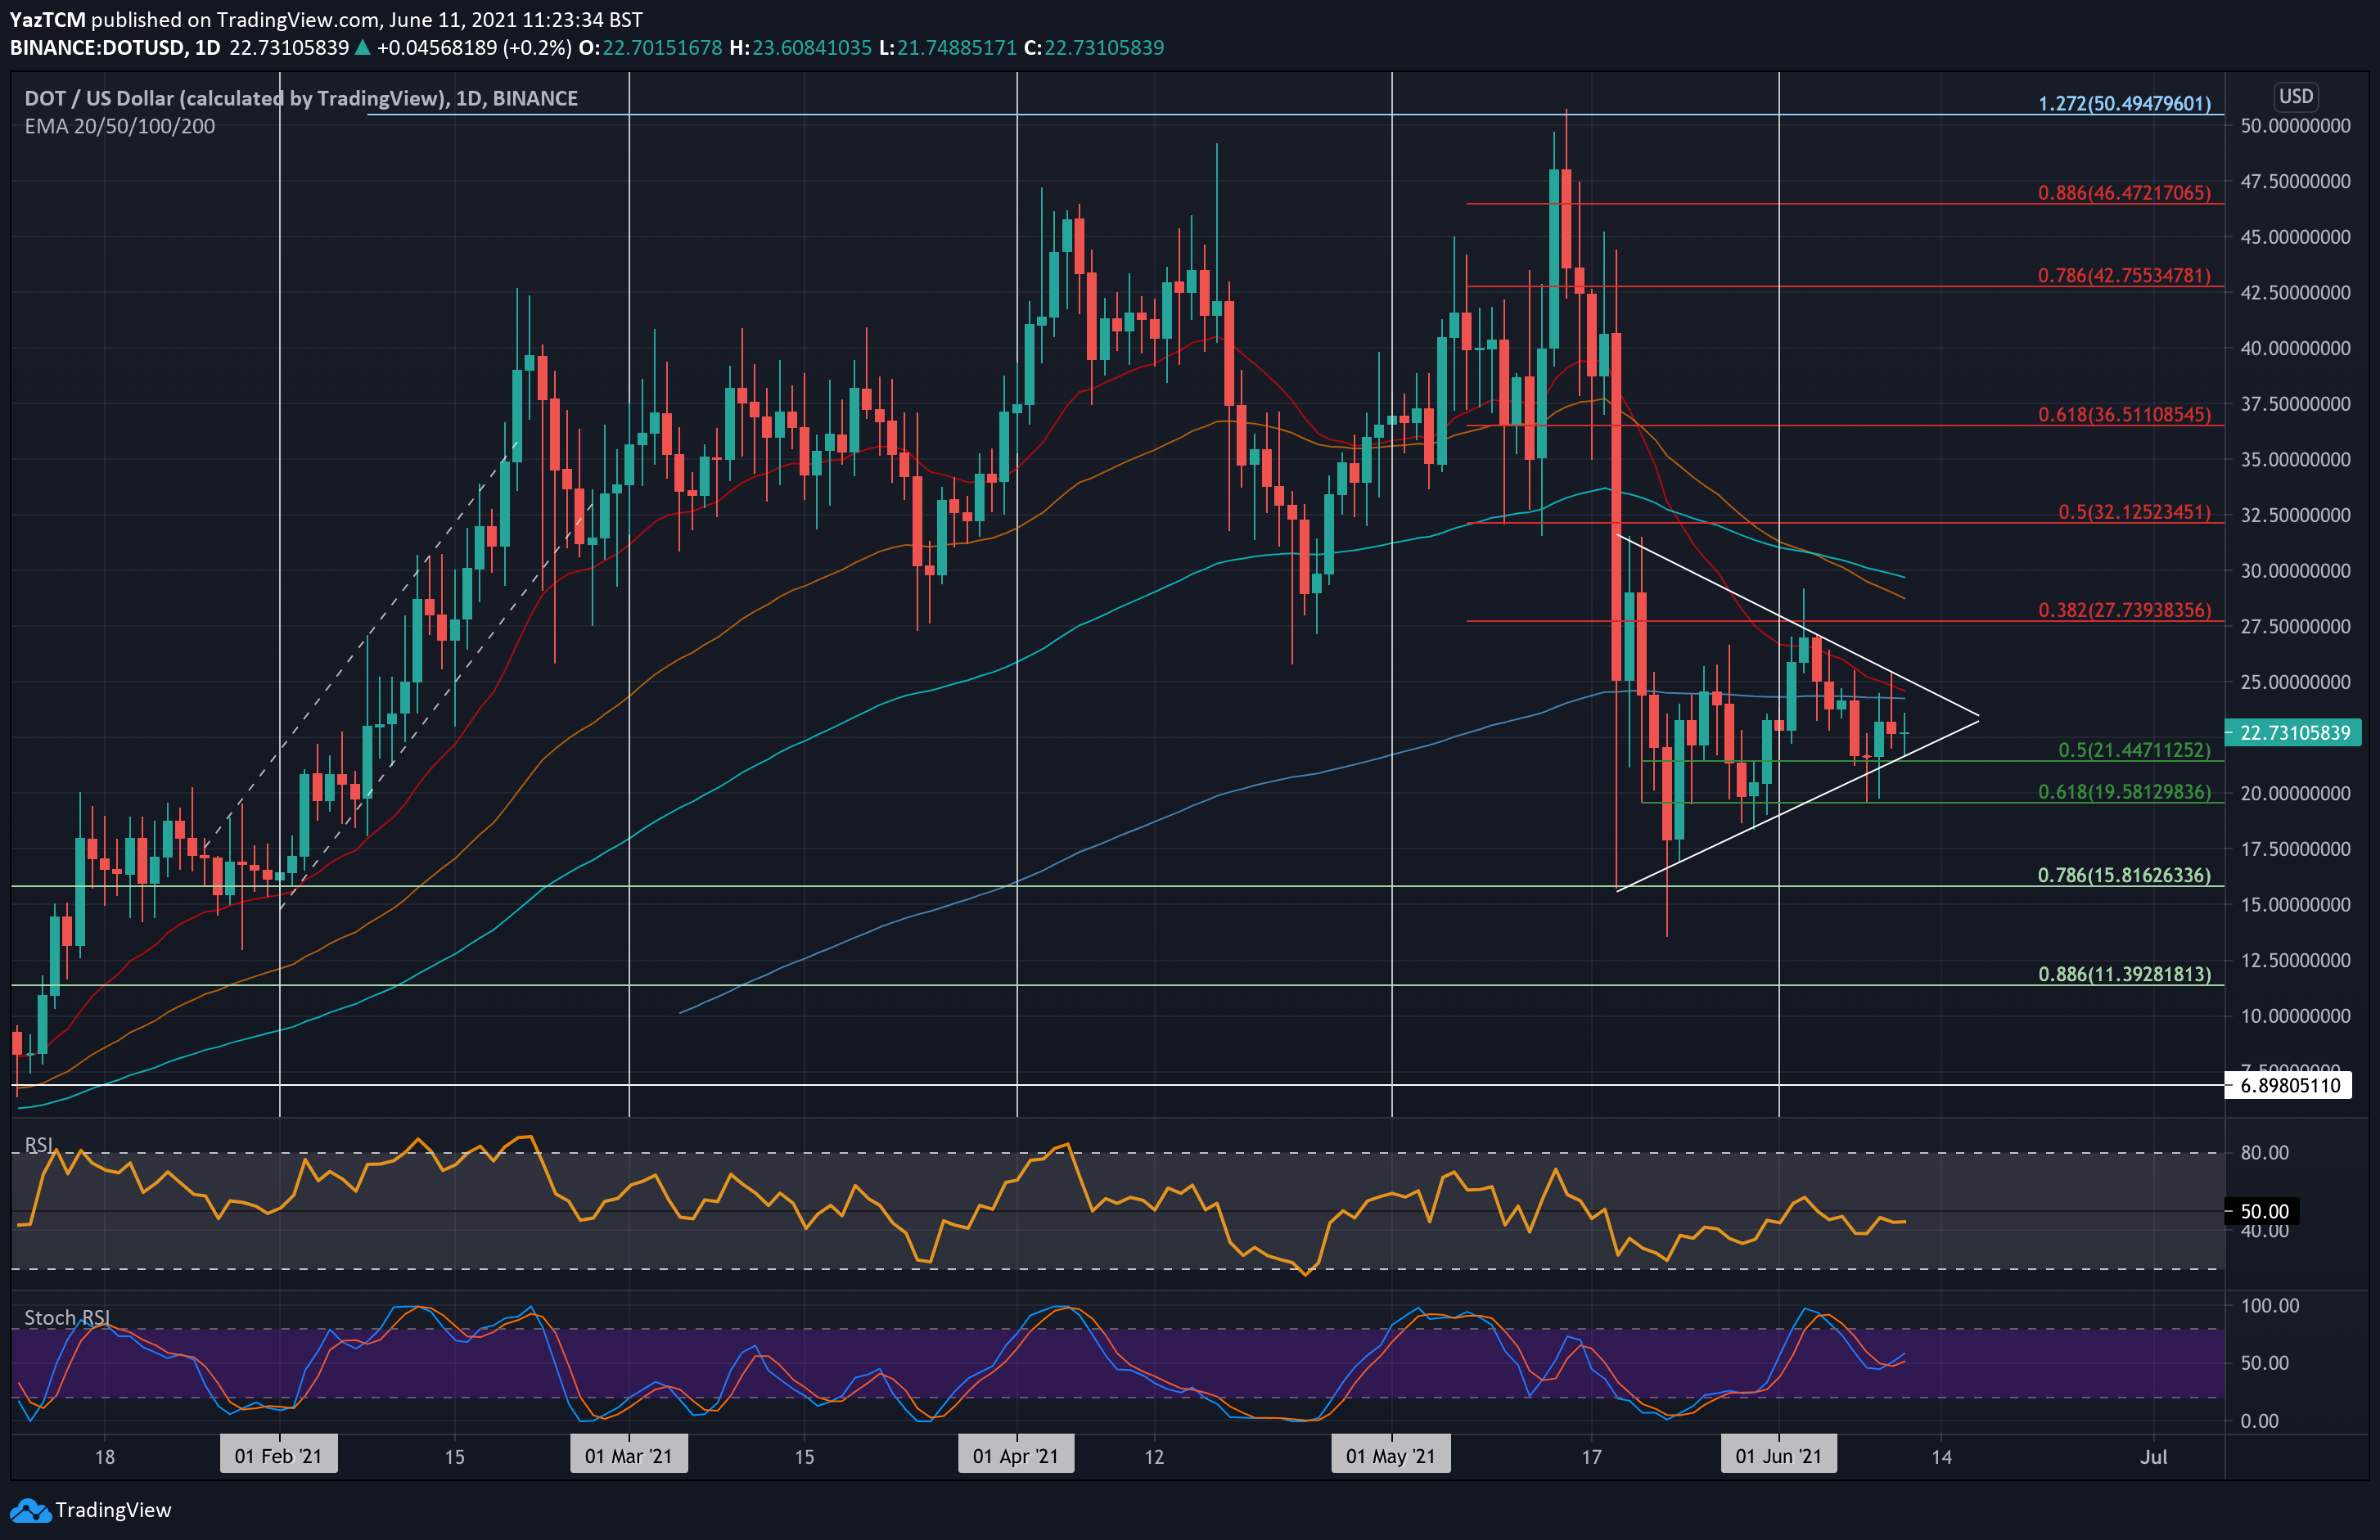
DOT is down by a solid 16% this week as it currently trades around $22.70. The coin was also trading inside a symmetrical triangle pattern and failed to overcome the upper boundary of this pattern toward the end of last week.
As a result, DOT headed lower into the week as it broke beneath the 200-day MA at around $25. It continued lower until support was established at $21.45 (.5 Fib & lower boundary of the triangle) on Wednesday.
Looking ahead, the first support lies at the lower boundary of the triangle, around $21.50. This is followed by $20, $19.60 (.618 Fib), $17.50, and $15.80.
On the other side, the first resistance lies at $25 (the upper boundary of the triangle & 200-day MA). Above the triangle, resistance lies at $27.75 (bearish .382 Fib), $30 (100-day MA), and $32.12 (bearish .5 Fib).
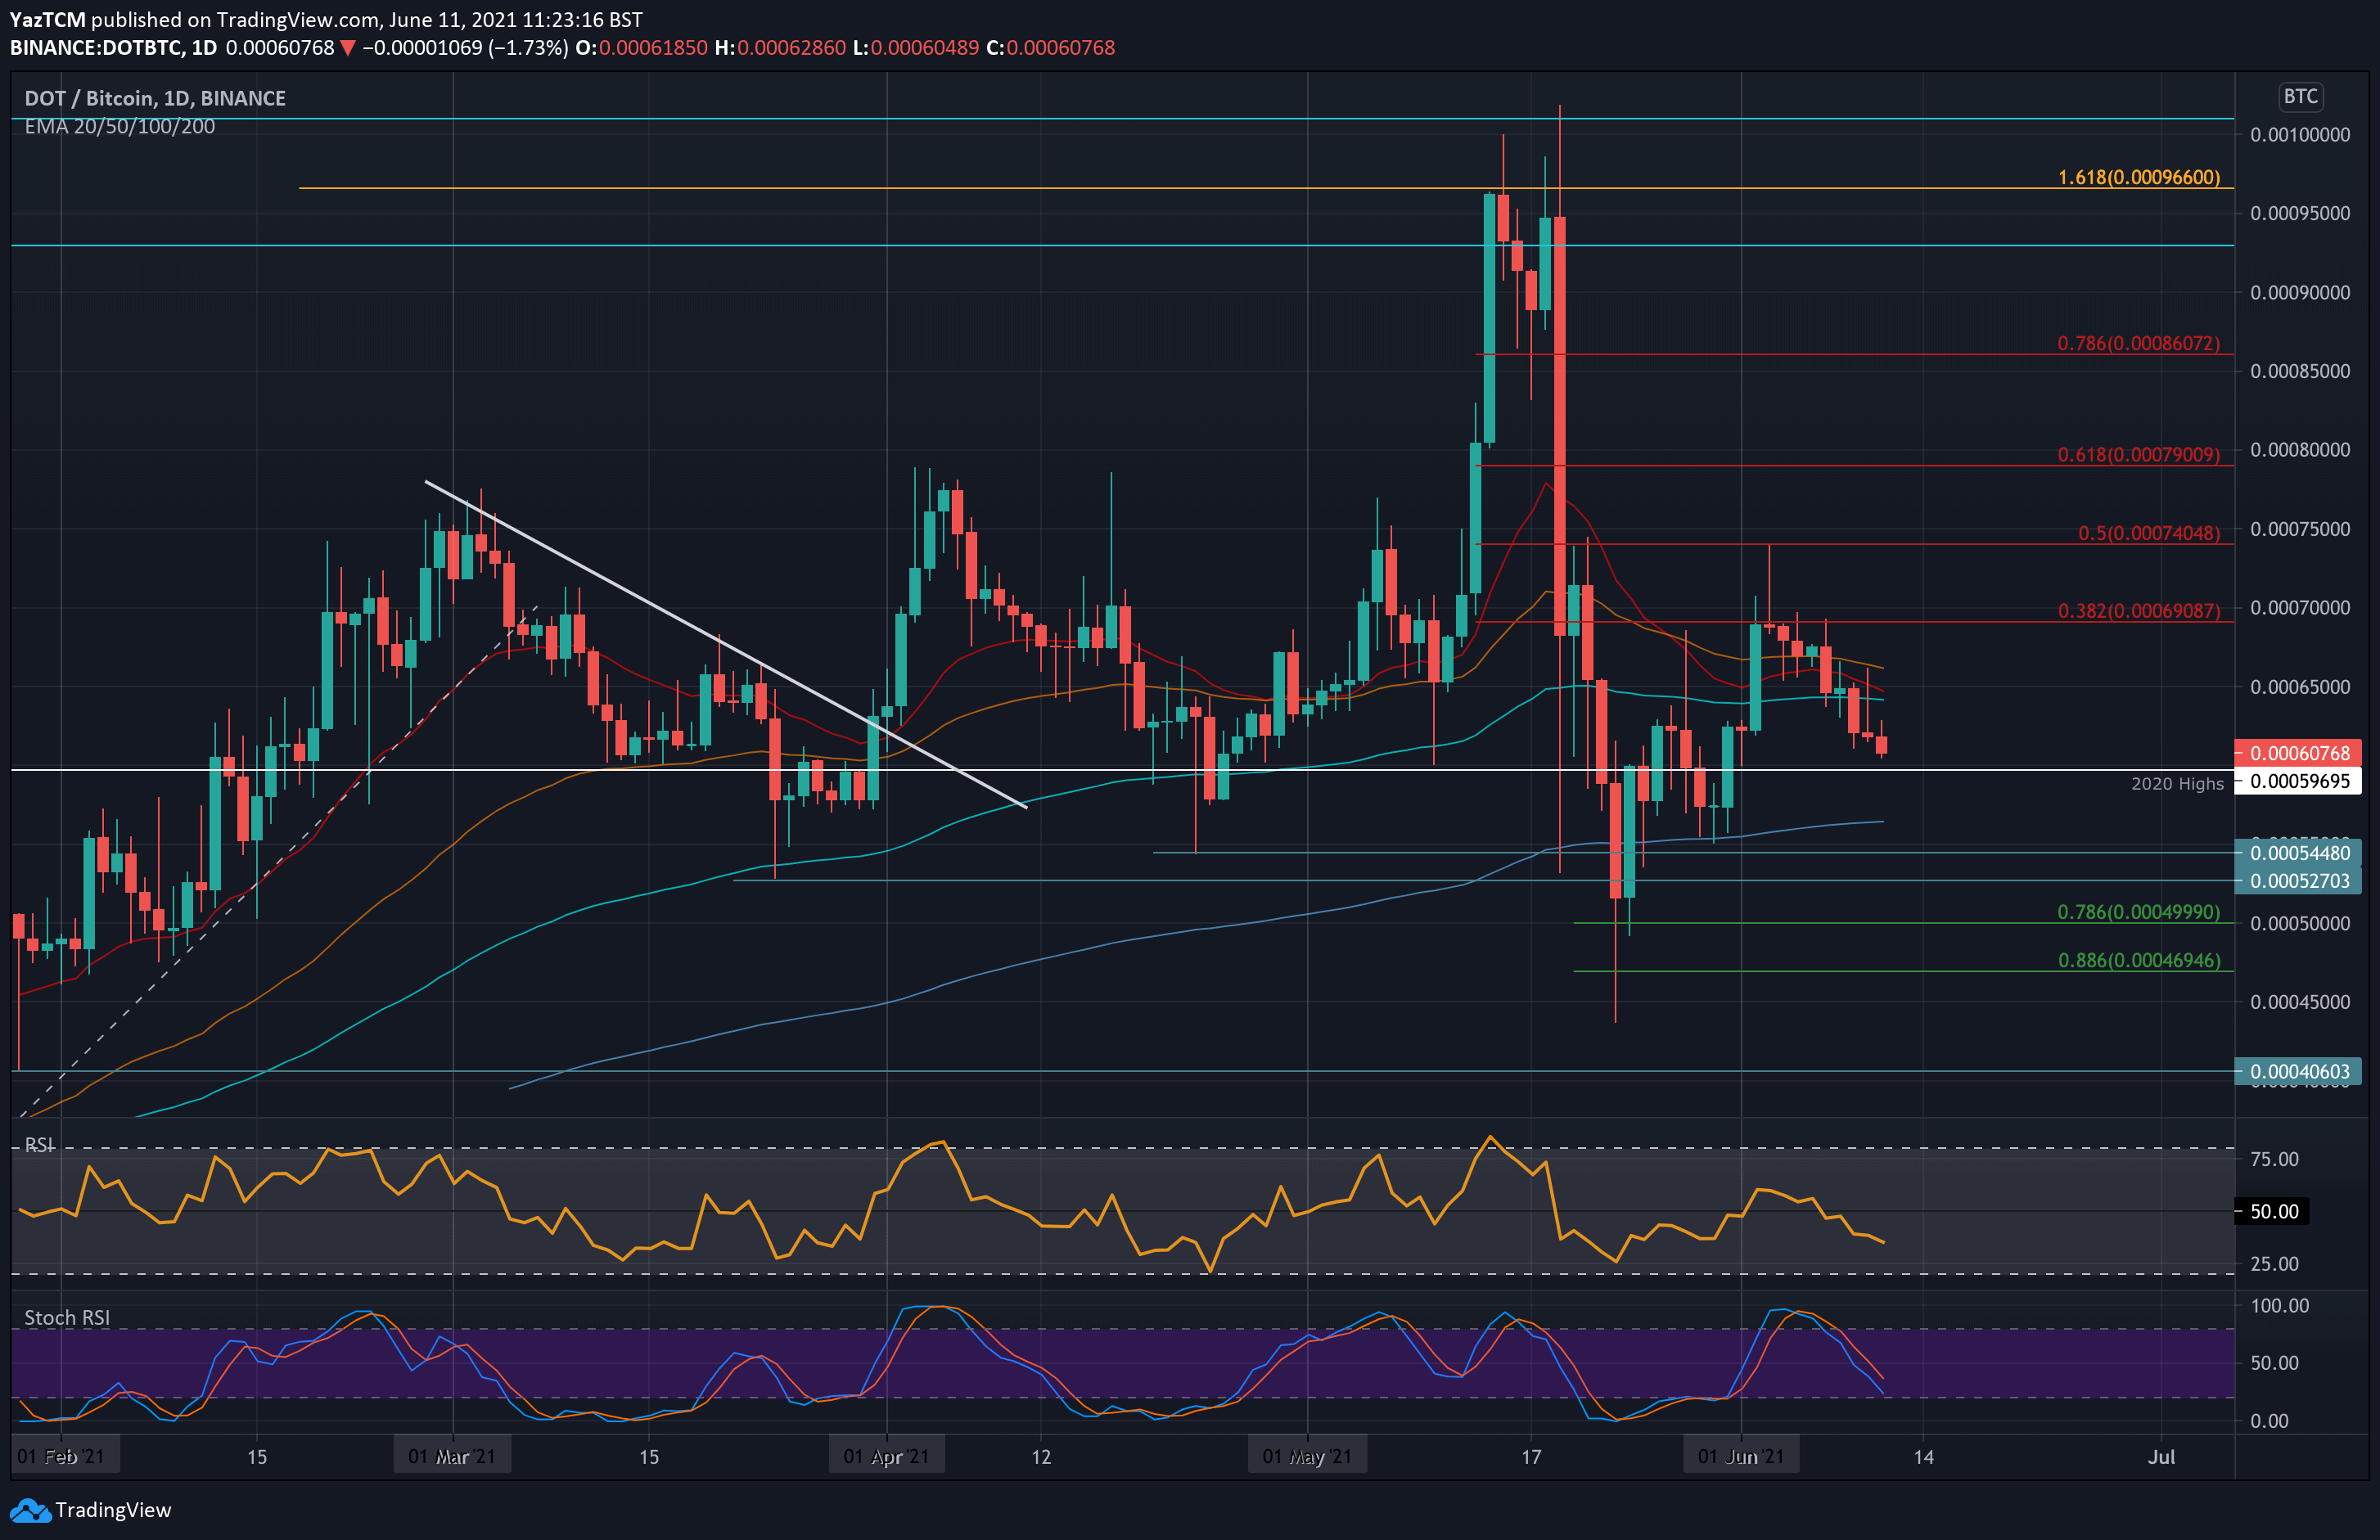
Against BTC, DOT was testing resistance at around 0.00069 BTC (bearish .382 Fib) last week but was unable to overcome the level. It started to head lower from there and eventually broke beneath the 100-day MA at 0.00065 BTC on Wednesday.
It continued further and is now trading at 0.000607 BTC.
Looking ahead, the first support lies at 0.000696 (2020 highs). This is followed by 0.00056 BTC (200-day MA0, 0.000544 BTC, and 0.000527 BTC. Added support lies at 0.0005 BTC.
On the other side, the first resistance lies at 0.00065 BTC (100-day MA). This is followed by 0.00069 BTC (bearish .382 Fib), 0.0007 BTC, and 0.00074 BTC (bearish .5 Fib).
Polygon
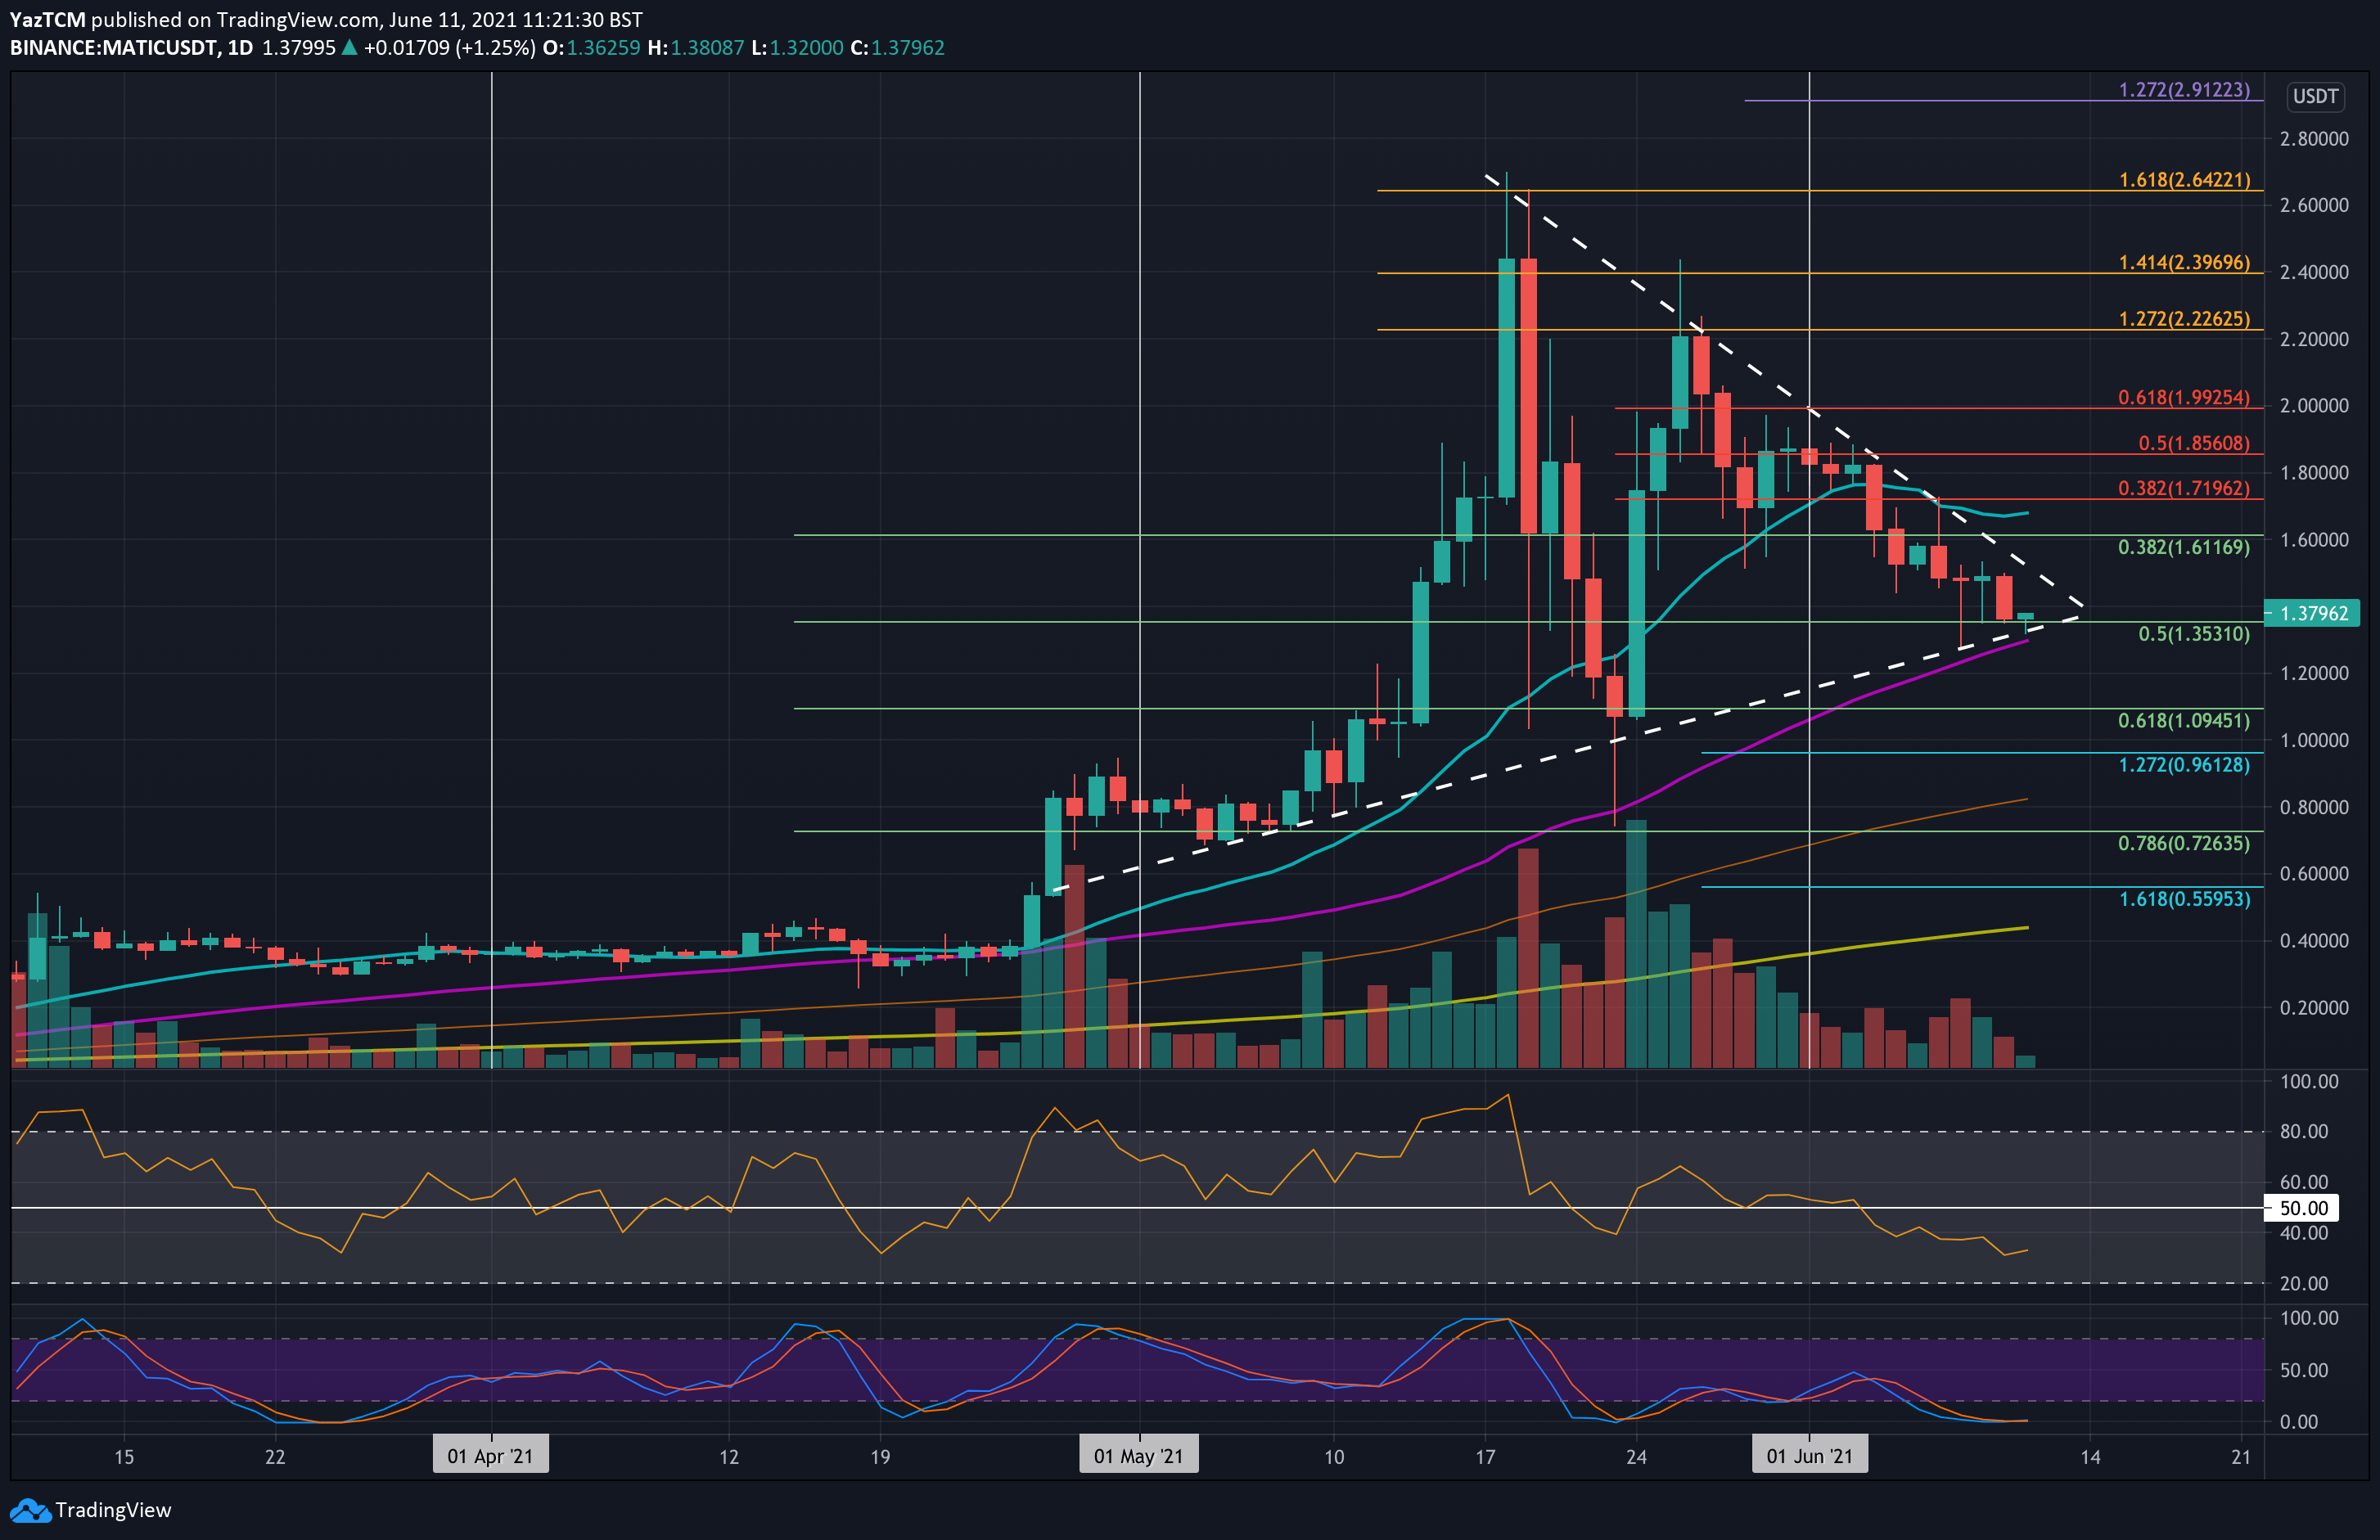
MATIC is down by a sharp 25% this week as the coin drops into support at $1.35 (.5 Fib Retracement). The coin is trading inside a very large symmetrical triangle pattern and is very close to the apex of the triangle.
With the current bearish momentum within the market, it is highly likely that MATIC is going to break toward the downside of this triangle unless some positive sentiment quickly emerges this week.
Looking ahead, the first support lies at the lower boundary of the triangle, around $1.30 (50-day MA). This is followed by $1.10 (.618 Fib), $0.96, $0.8 (100-day MA), and $0.726 (.786 Fib).
On the other side, the first resistance lies at the triangle’s upper boundary, around $1.50. This is followed by $1.70 (20-day MA &bearish .382 Fib), $1.85 (bearish .5 Fib), and $2.00 (bearish .618 Fib).
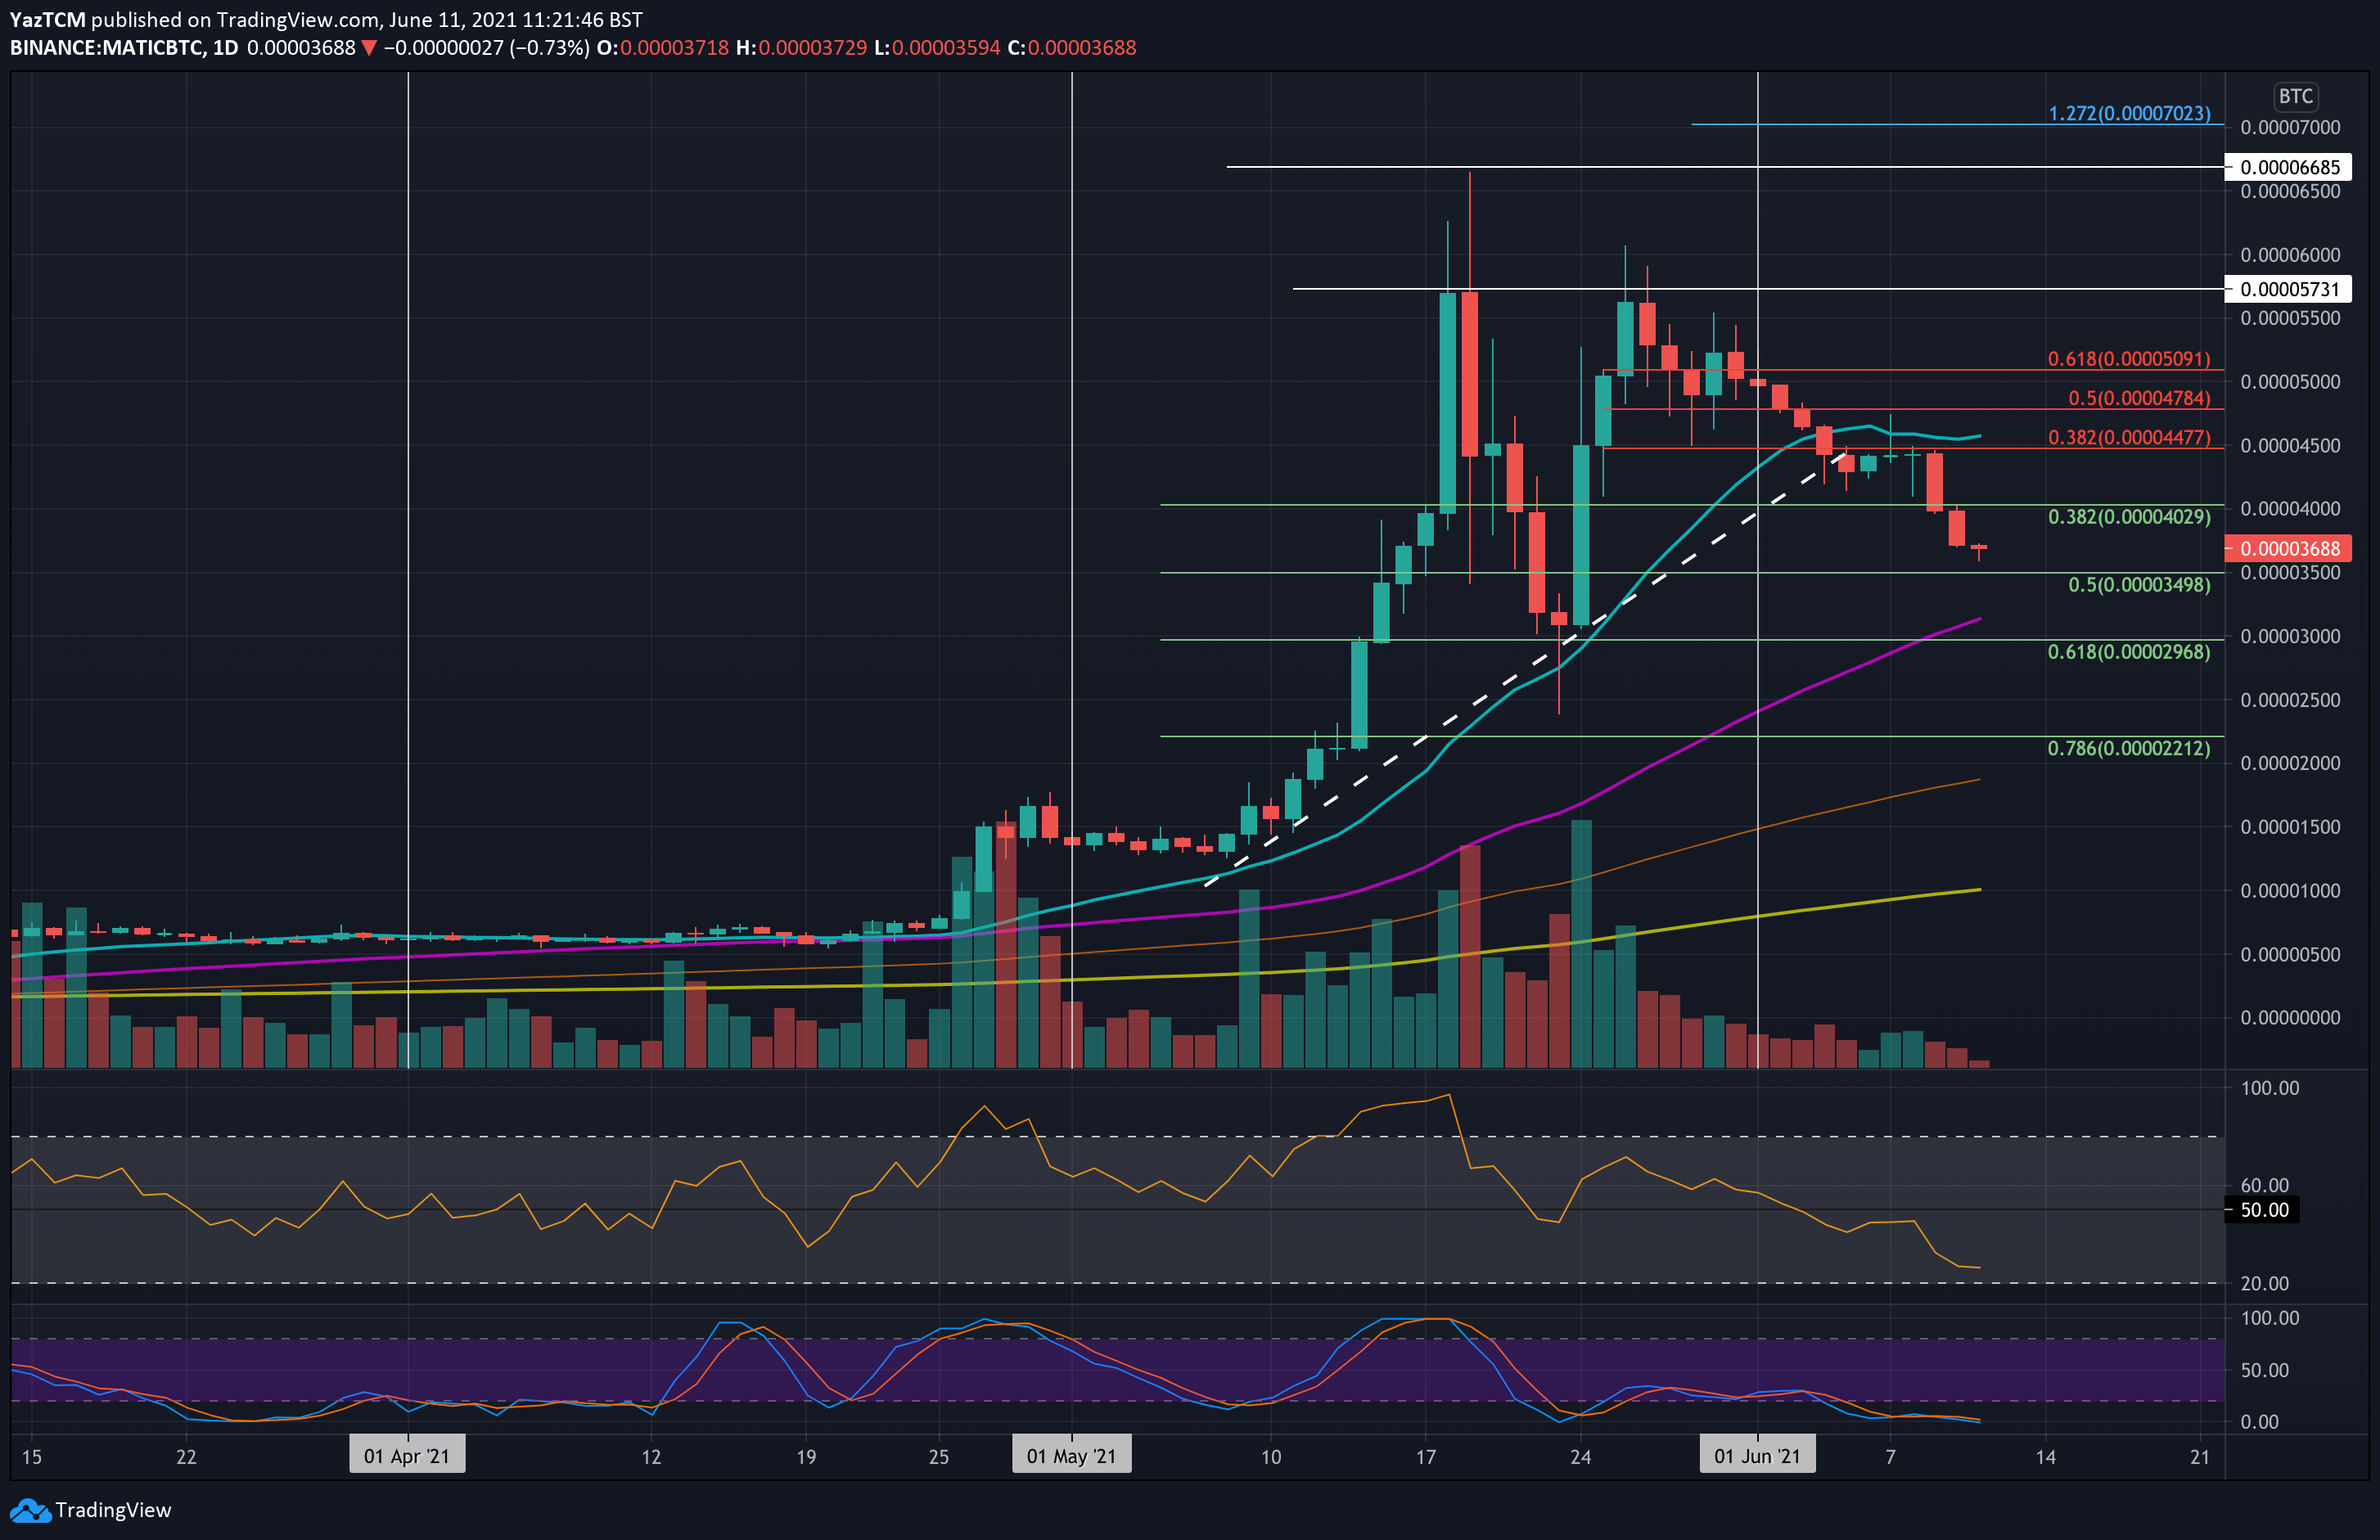
Against BTC, MATIC struggled to break resistance at around 4500 SAT at the start of the week. On Wednesday, it headed lower from this resistance and dropped to 4000 SAT.
Over the past two days, MATIC continued lower to reach the current 3690 SAT level.
Looking ahead, the first support lies at 3500 SAT (.5 Fib). This is followed by 3100 SAT (50-day MA), 3000 SAT (.618 Fib), and 2500 SAT.
On the other side, the first resistance lies at 4000 SAT. This is followed by 4500 SAT (bearish .382 Fib), 4785 SAT (bearish .5 Fib), 5000 SAT, and 5100 SAT.
