Crypto Price Analysis & Overview June 11: Bitcoin, Ethereum, Ripple, Litecoin and Grin
Bitcoin
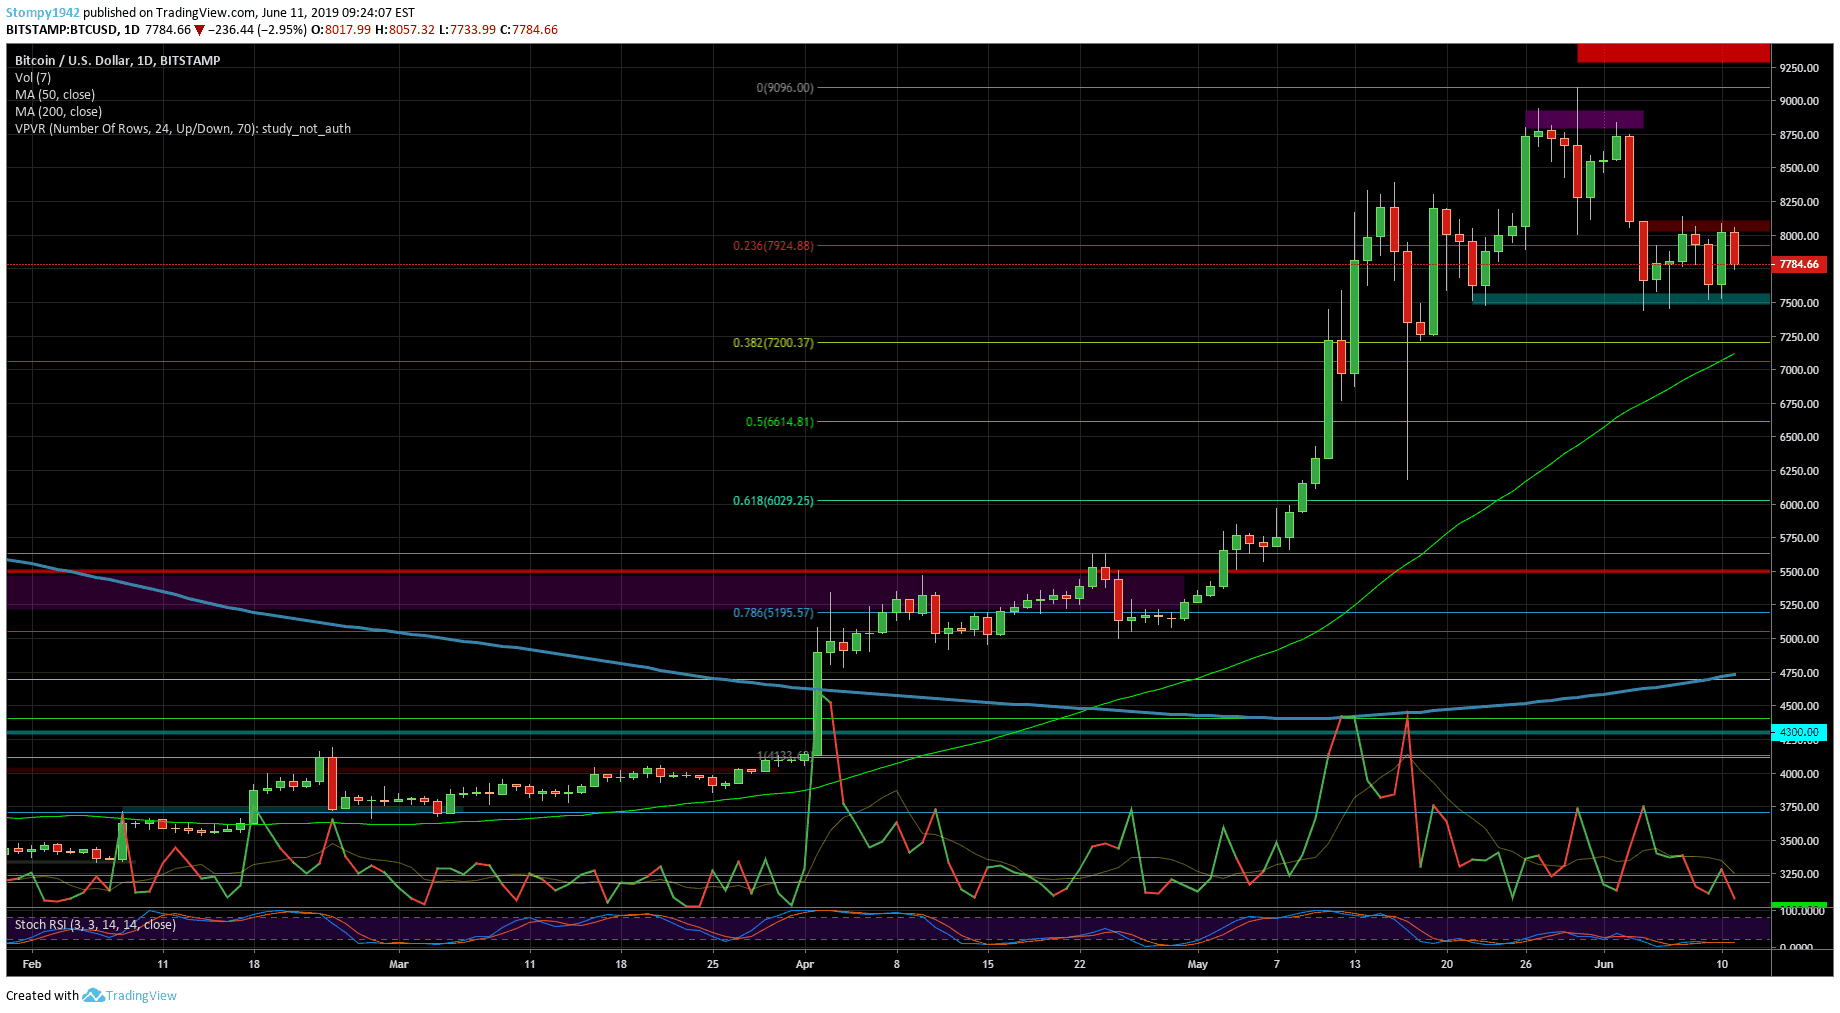
The support in Bitcoin’s price holds around $7500 in this range, resistance lies at $8000 and seems a bit like a Head and Shoulders pattern is forming up, the volatility has increased, and the RSI is down. The volume has also been reduced. The same pattern has been developed in the range of $5000, but there is no certainty that history will repeat itself.
Ethereum
Against the USD, the resistance level around $280 is substantial. Support is being built around $225 since ETH suffered from the correction rejecting the $250 resistance range. If the price holds the $225 support, this might be a proof or strength in ETH for the future.
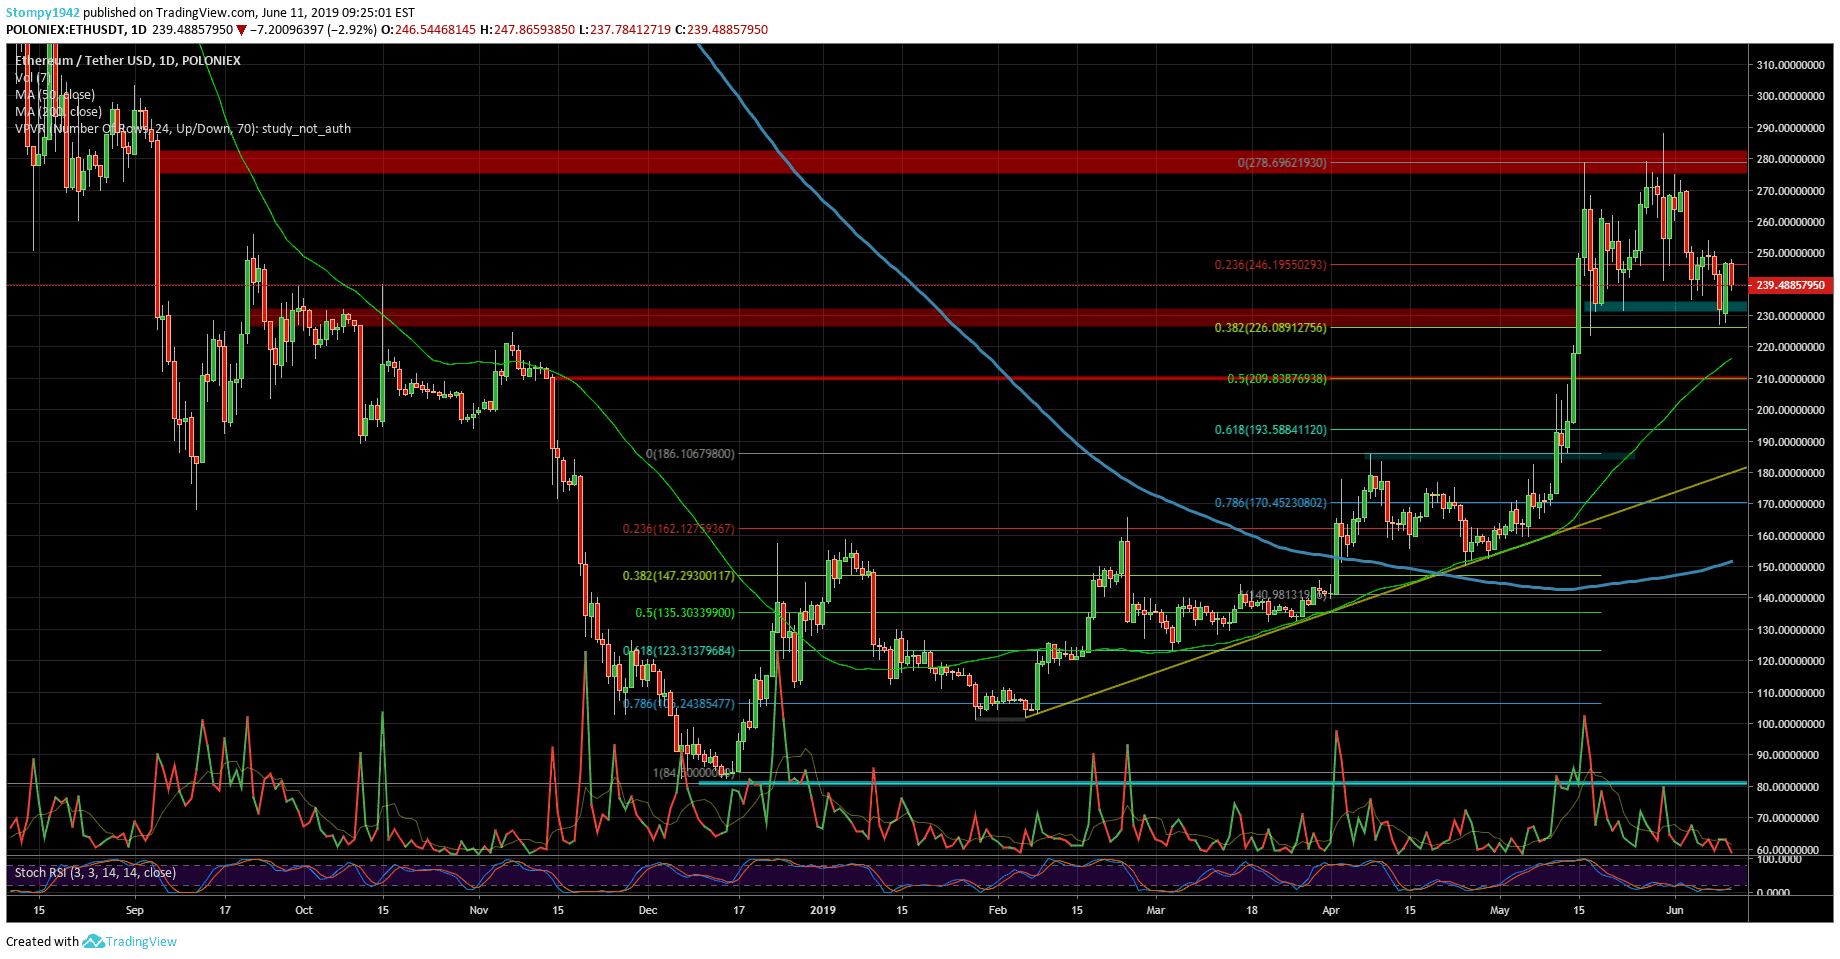
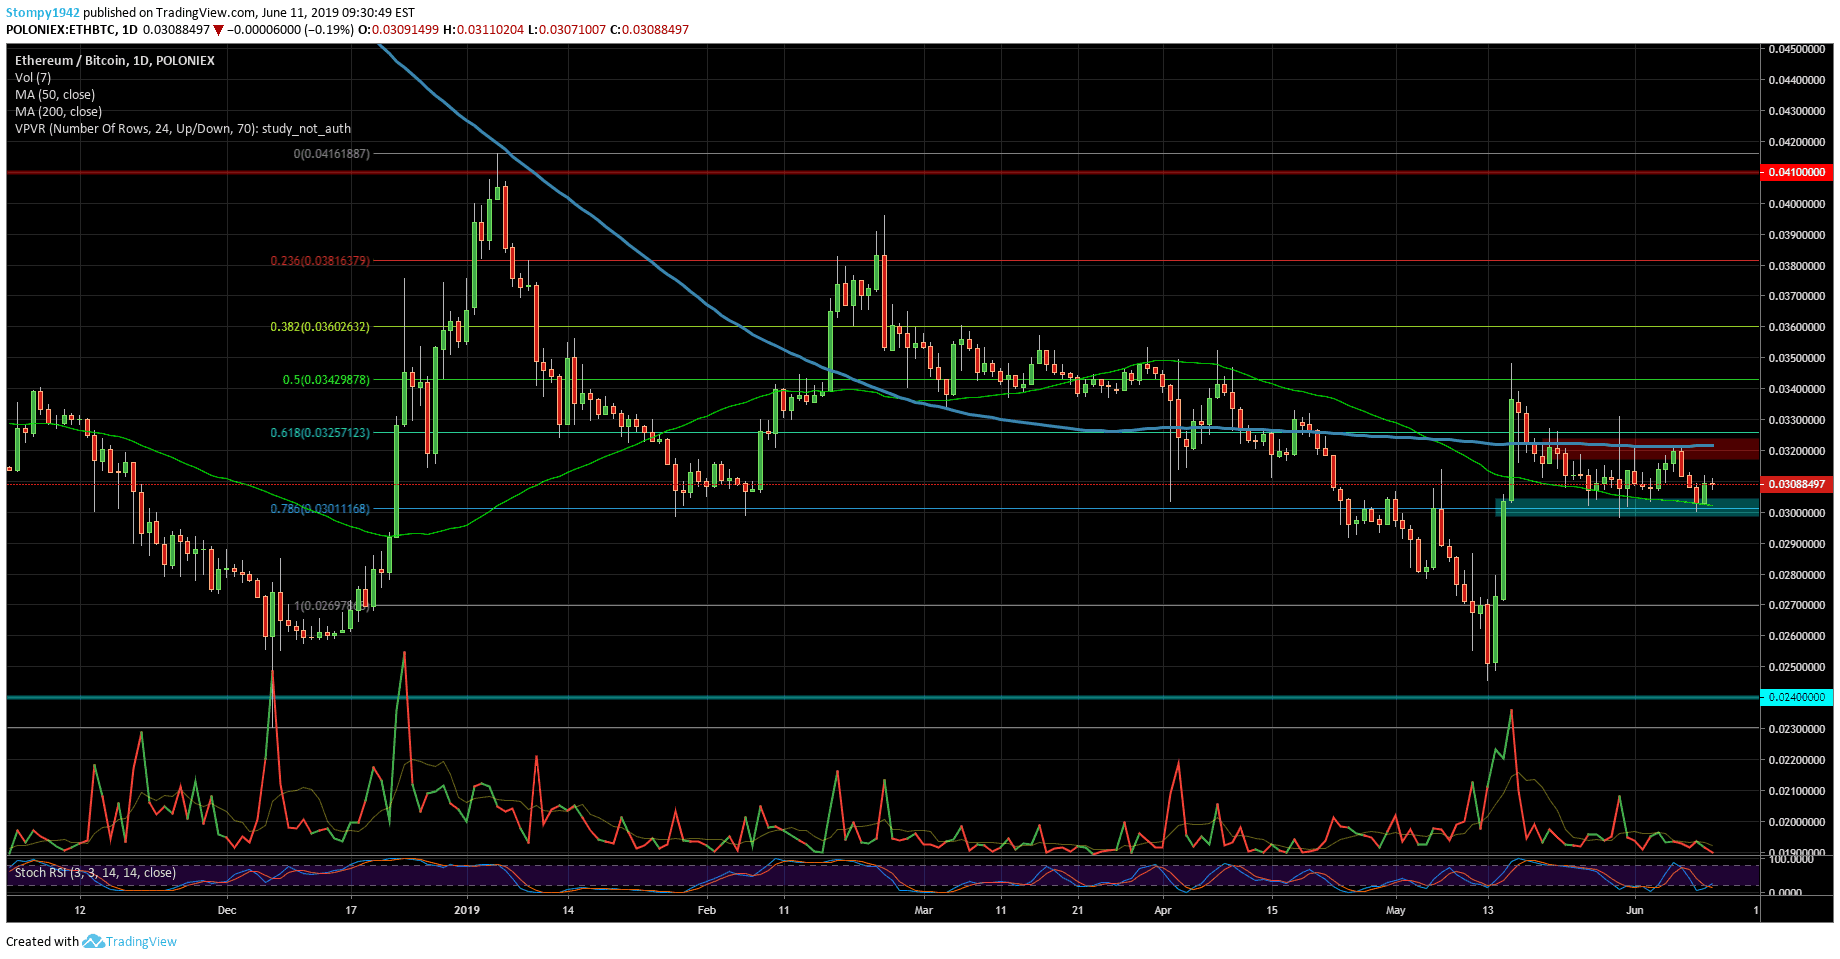
Against Bitcoin, ETH had reached old support at 0.03 BTC and again marked it as floor. Resistance in this range is located at 0.032 BTC.
The previous breakout last week failed (false breakout), and since then the volume has dropped. It looks like the market is waiting for confirmation from the chart, to understand the direction of ETH/BTC better.
Ripple
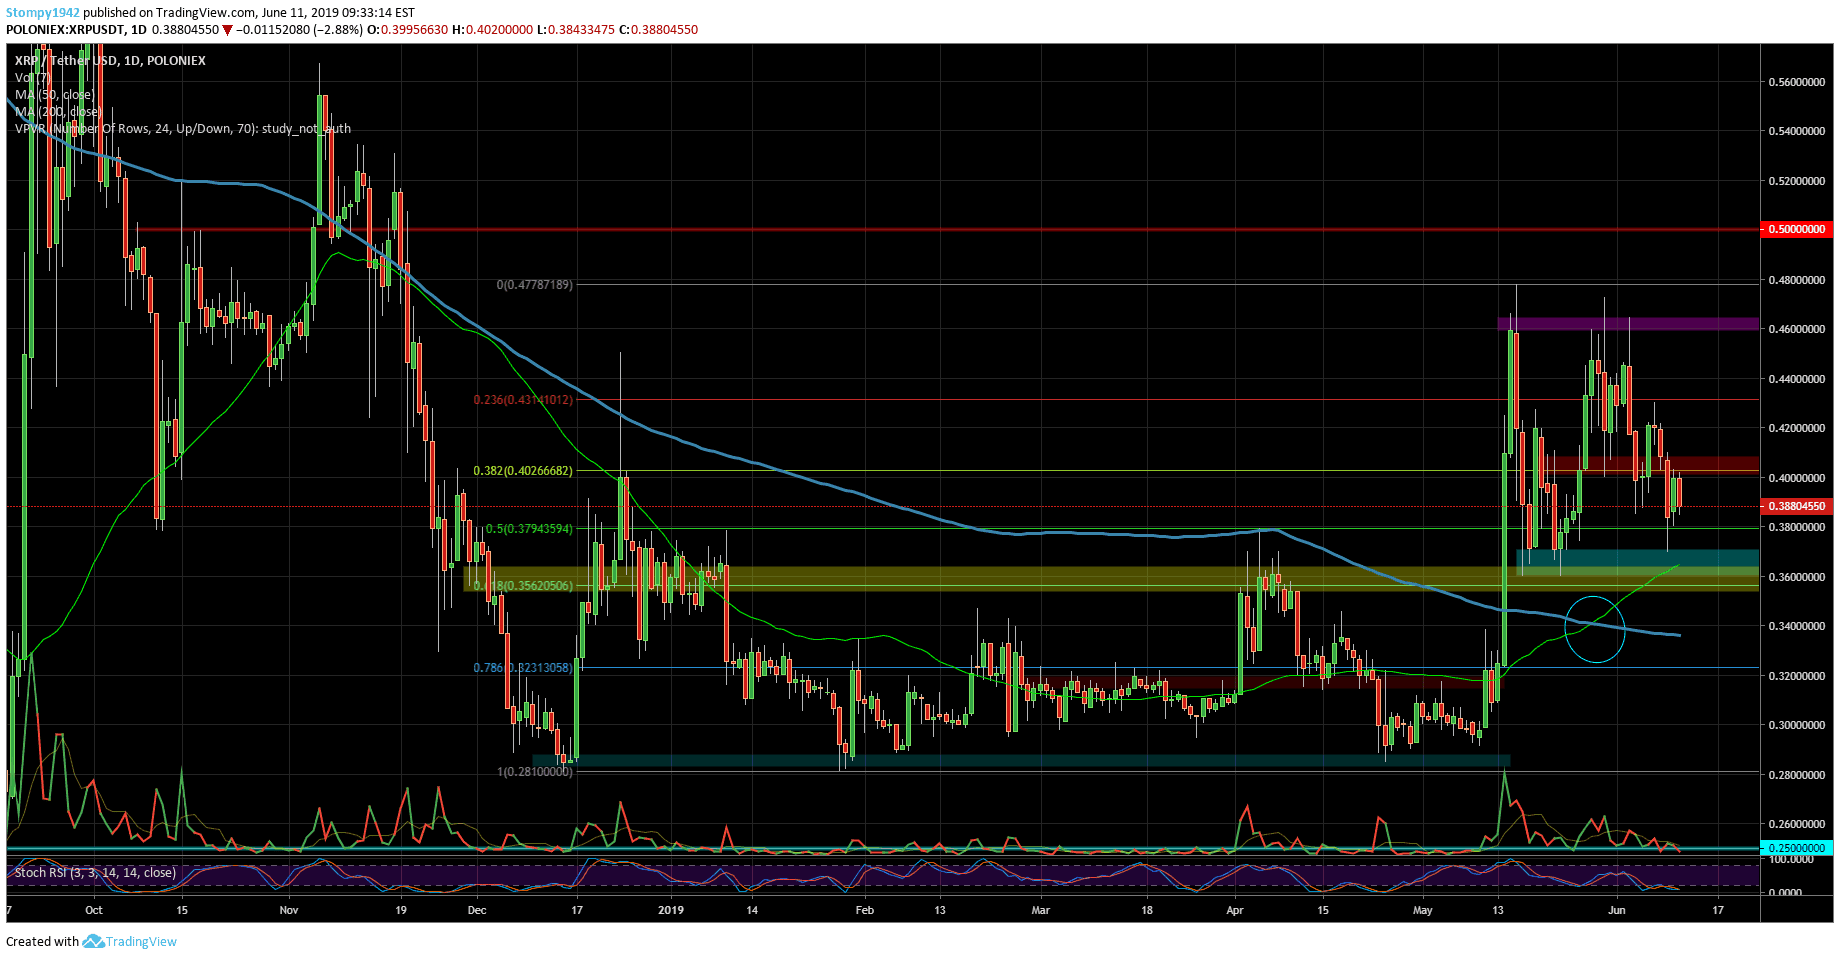
Against the USD, 2019 had started with a sharp correction and an attempt to break down the 40 cents XRP price, recording the floor around 28 cents. Since mid-May, a reasonable effort has broken through the resistance at 40 cents since the price had encountered stiff resistance at 46 cents. From there, we see a correction down (again).
It seems that support at 40 cents does not hold anymore. However, the next level shown on the following chart, 36 cents, might be strong support.
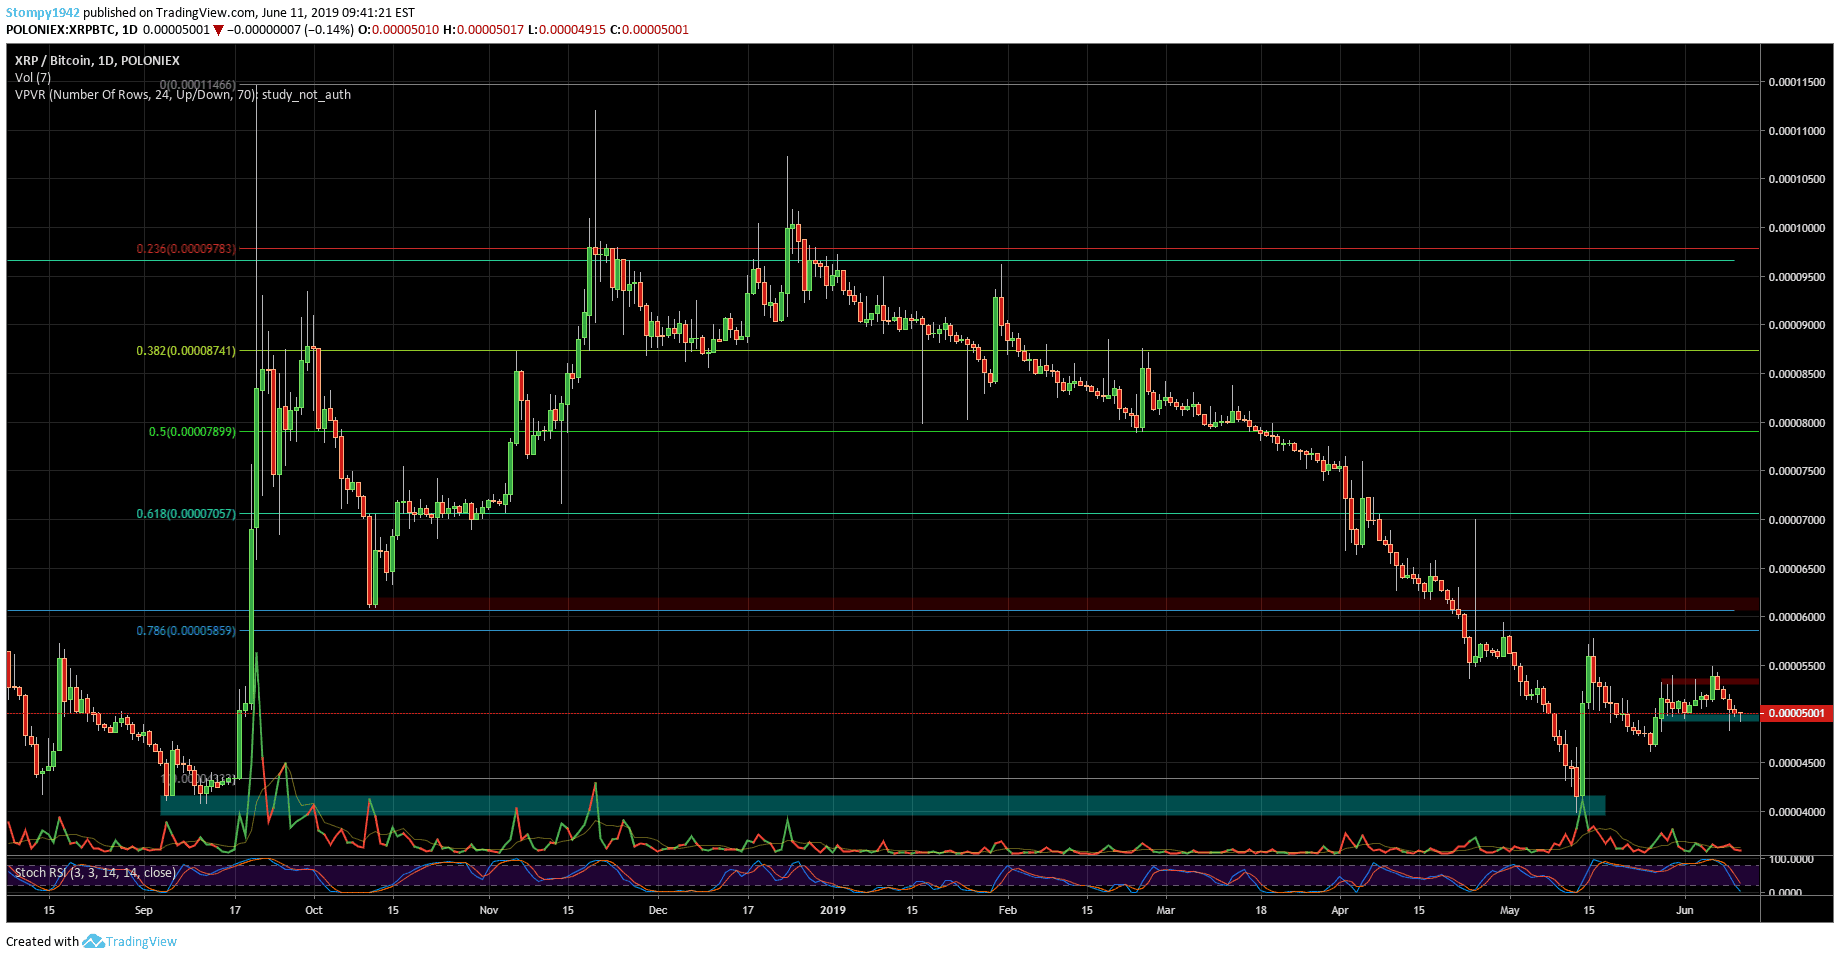
Against Bitcoin, the support built around 5000 SAT holds (as of now), while resistance in this range lies at 5300 SAT. Against Bitcoin, it was a stable week for XRP with a failed attempt to break through the resistance level.
Litecoin
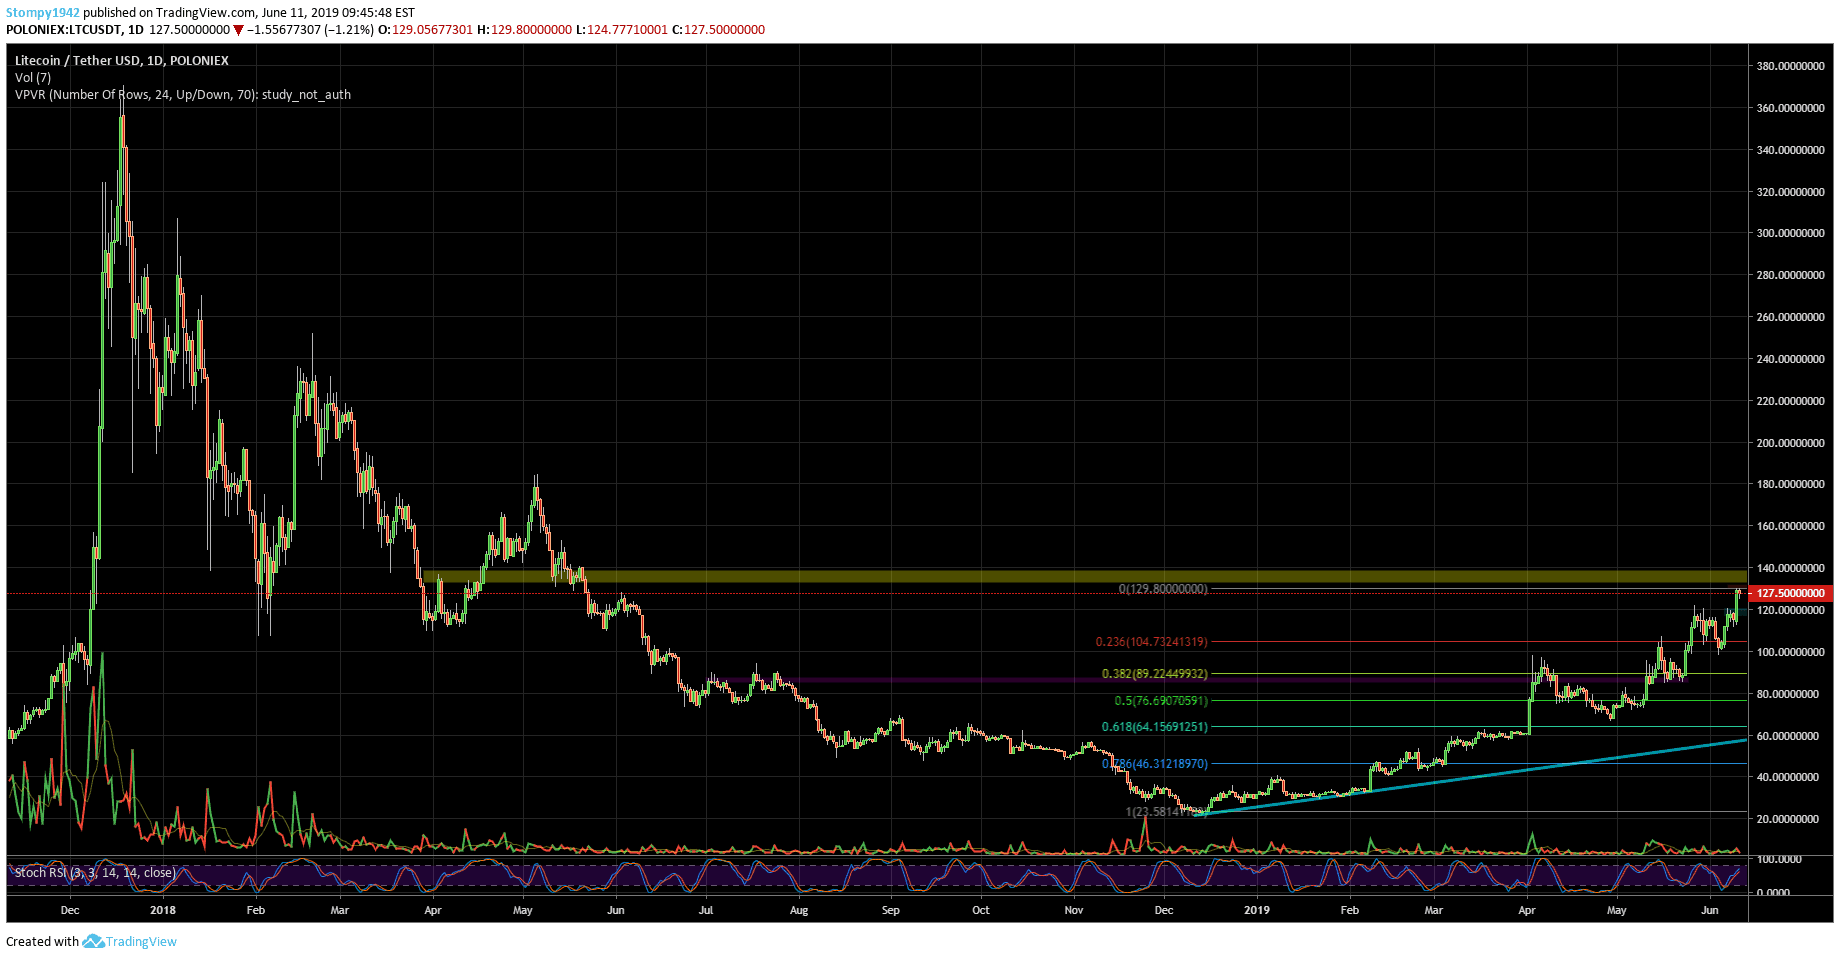
Against the USD, the trend of Litecoin is rising and approaching resistance at $140. Support for this range is around $120; some of the reasons can be the hype around Litecoin’s coming up halving. Technically, the LTC chart looks like the Bitcoin chart before the sharp parabolic rise of 2017.
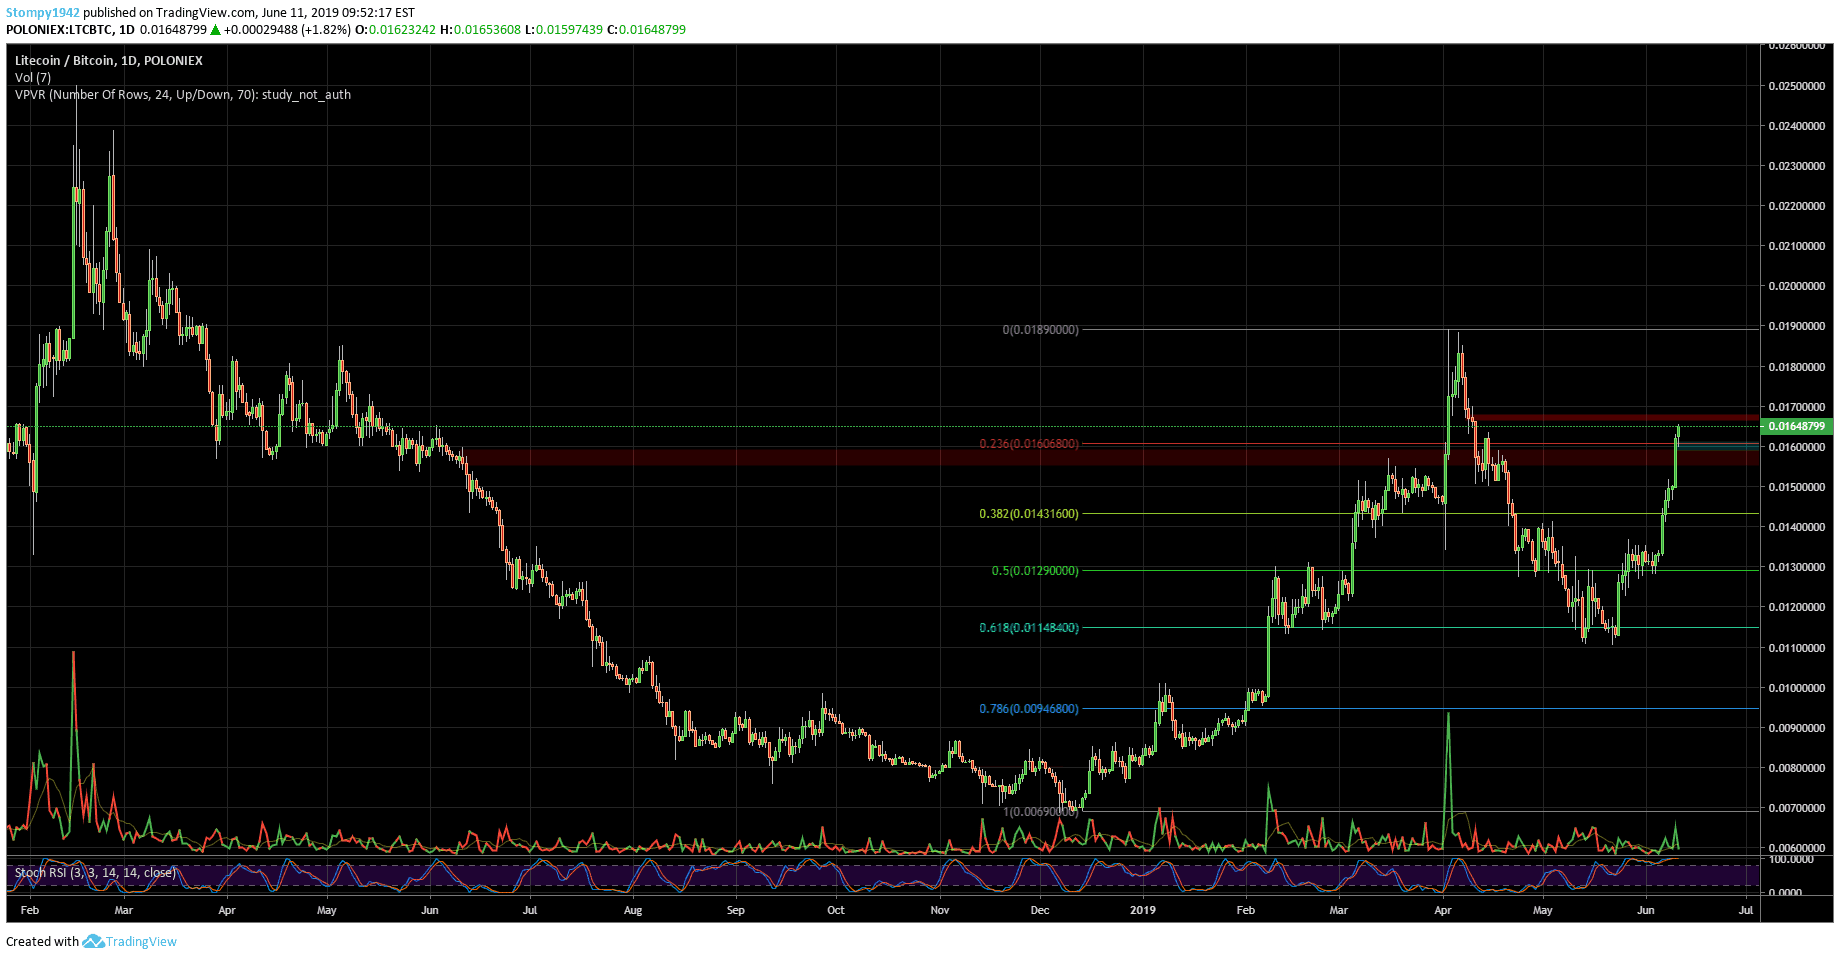
Against BTC, a cup and handle pattern on the daily chart reveals the bigger picture. Resistance in this range at 0.017 BTC, support at 0.016 BTC.
GRIN
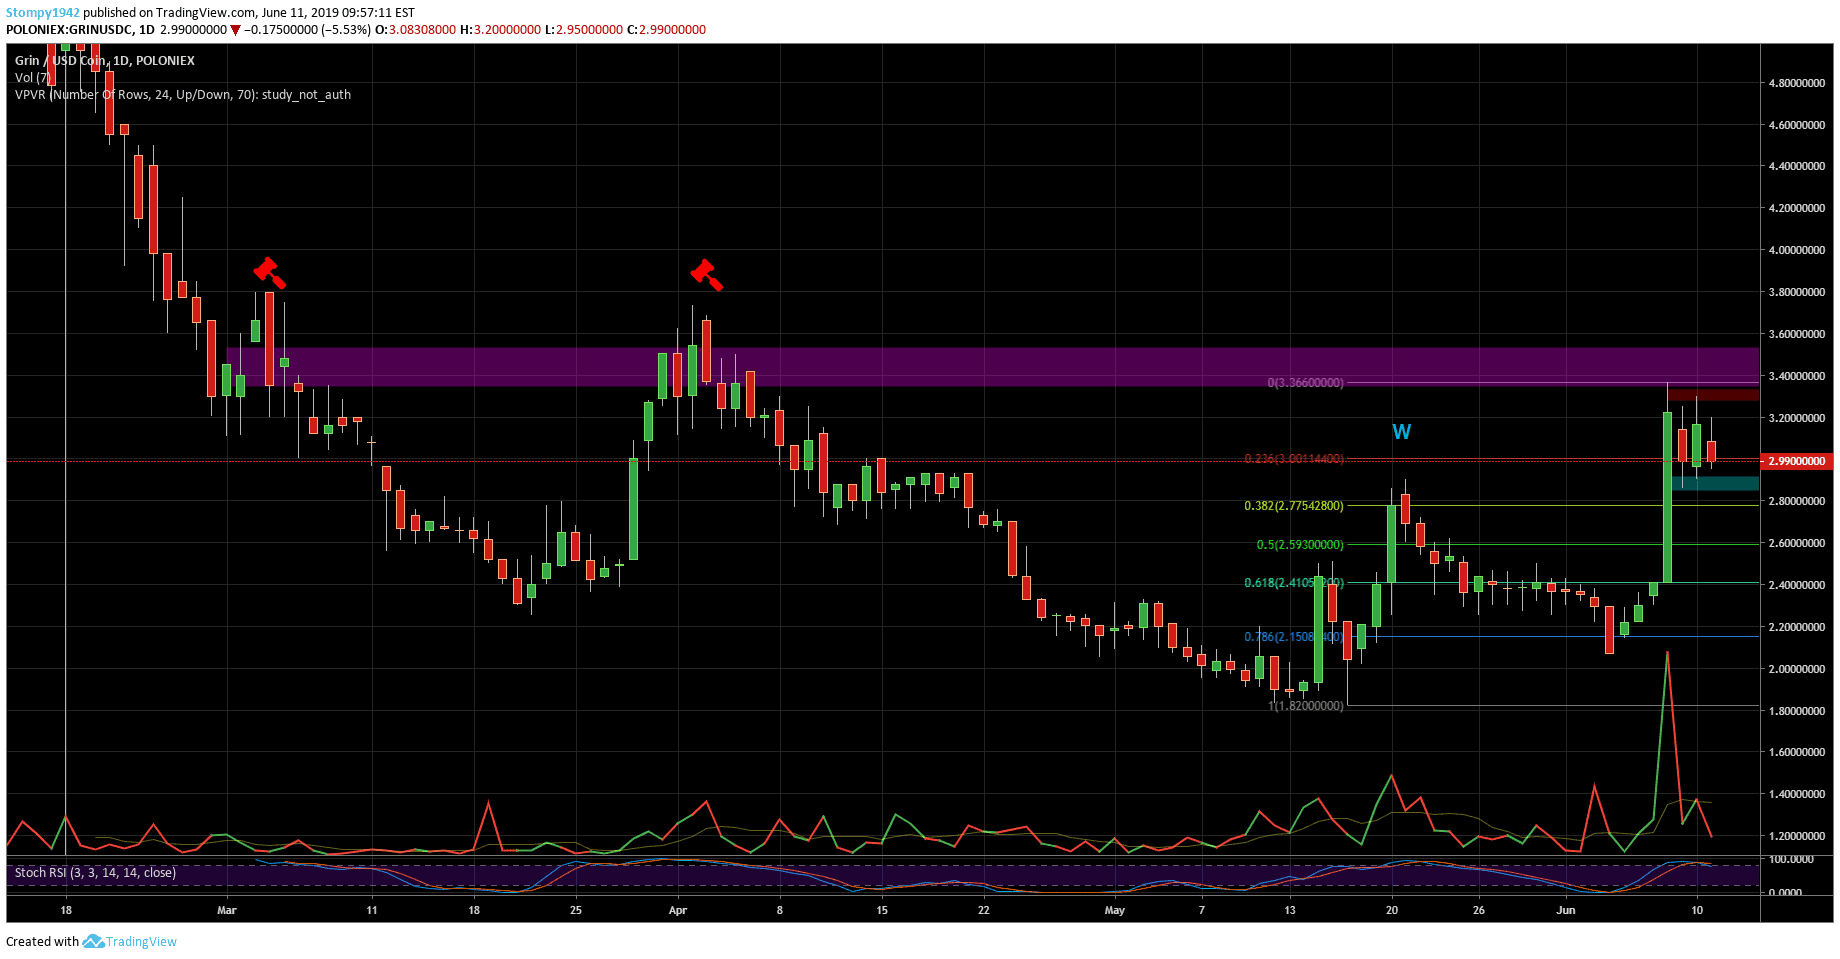
Against the USD, since started trading on major exchanges, the price has been set down and attempts to break resistance levels around $3.4 had been rejected. This is true until this week’s sharp rise to retest resistance levels. The closest support is being built around $2.8.
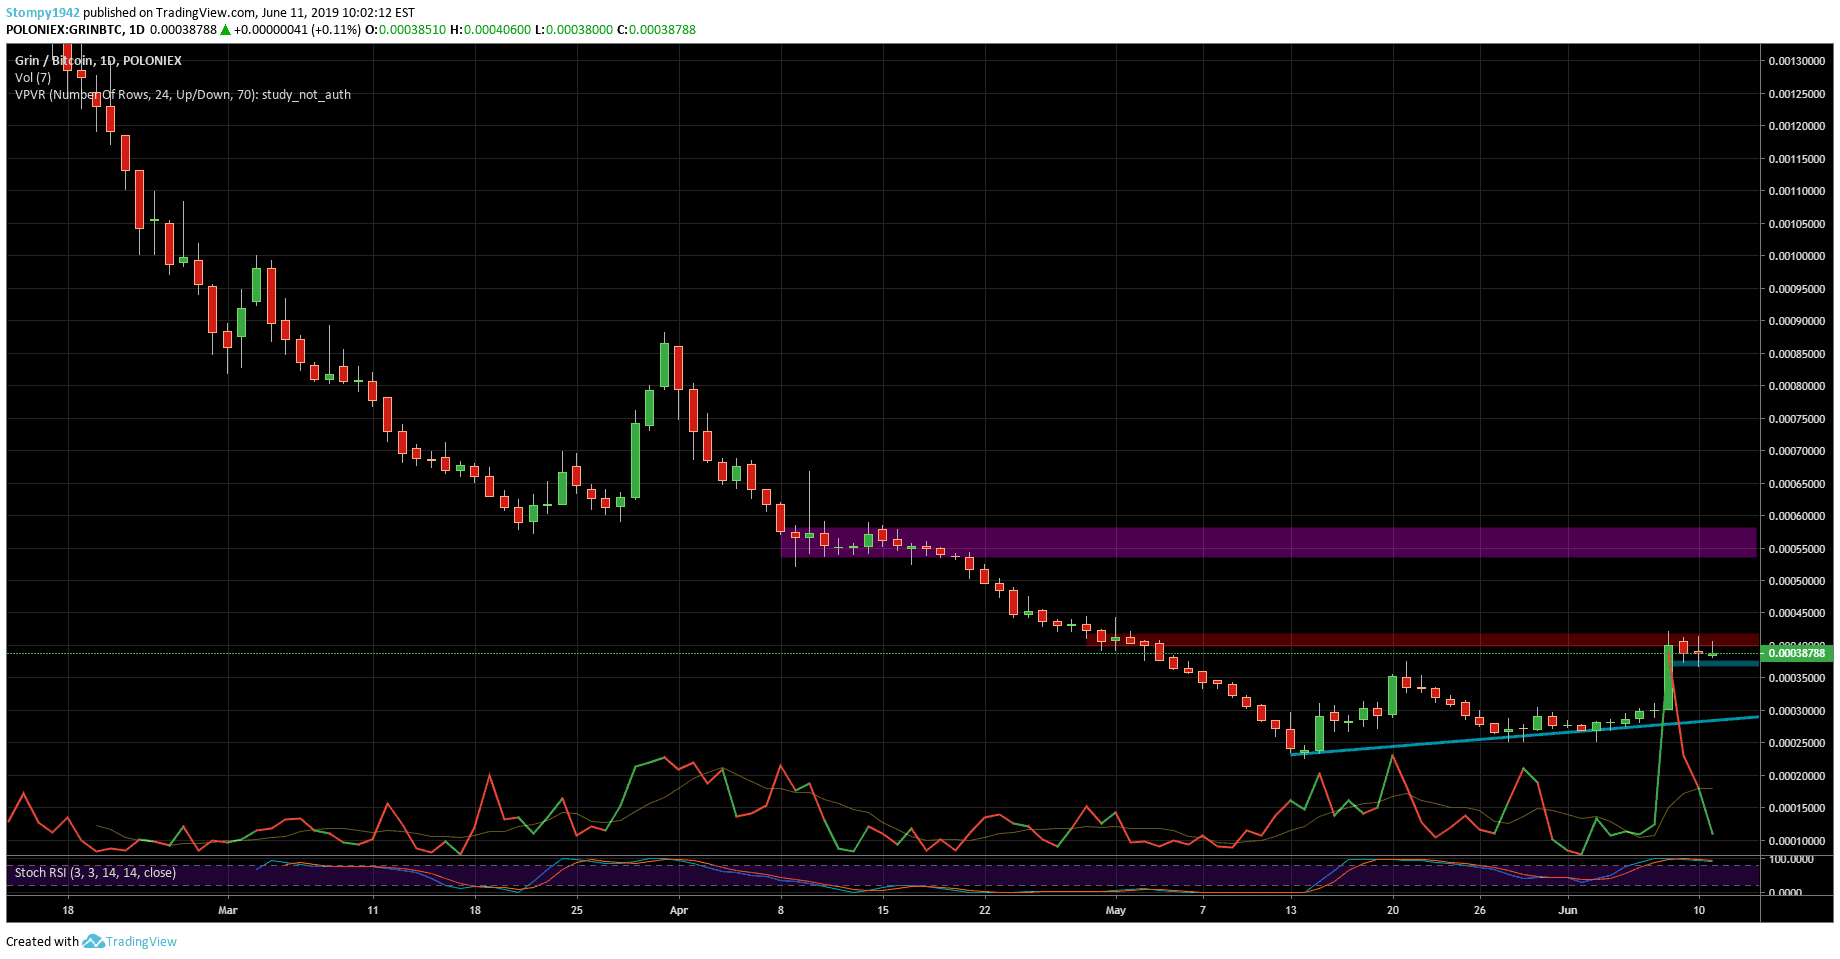
Against BTC, The correction similarly to Grin’s USD market. The bottom holds, and an attempt to break through 0.00041 BTC resistance might end up retesting next levels at 0.00055 BTC. Support is built around 0.00036 BTC in this range.
The post Crypto Price Analysis & Overview June 11: Bitcoin, Ethereum, Ripple, Litecoin and Grin appeared first on CryptoPotato.