Crypto Price Analysis & Overview January 29th: Bitcoin, Ethereum, Ripple, Stellar, and Uniswap
Bitcoin
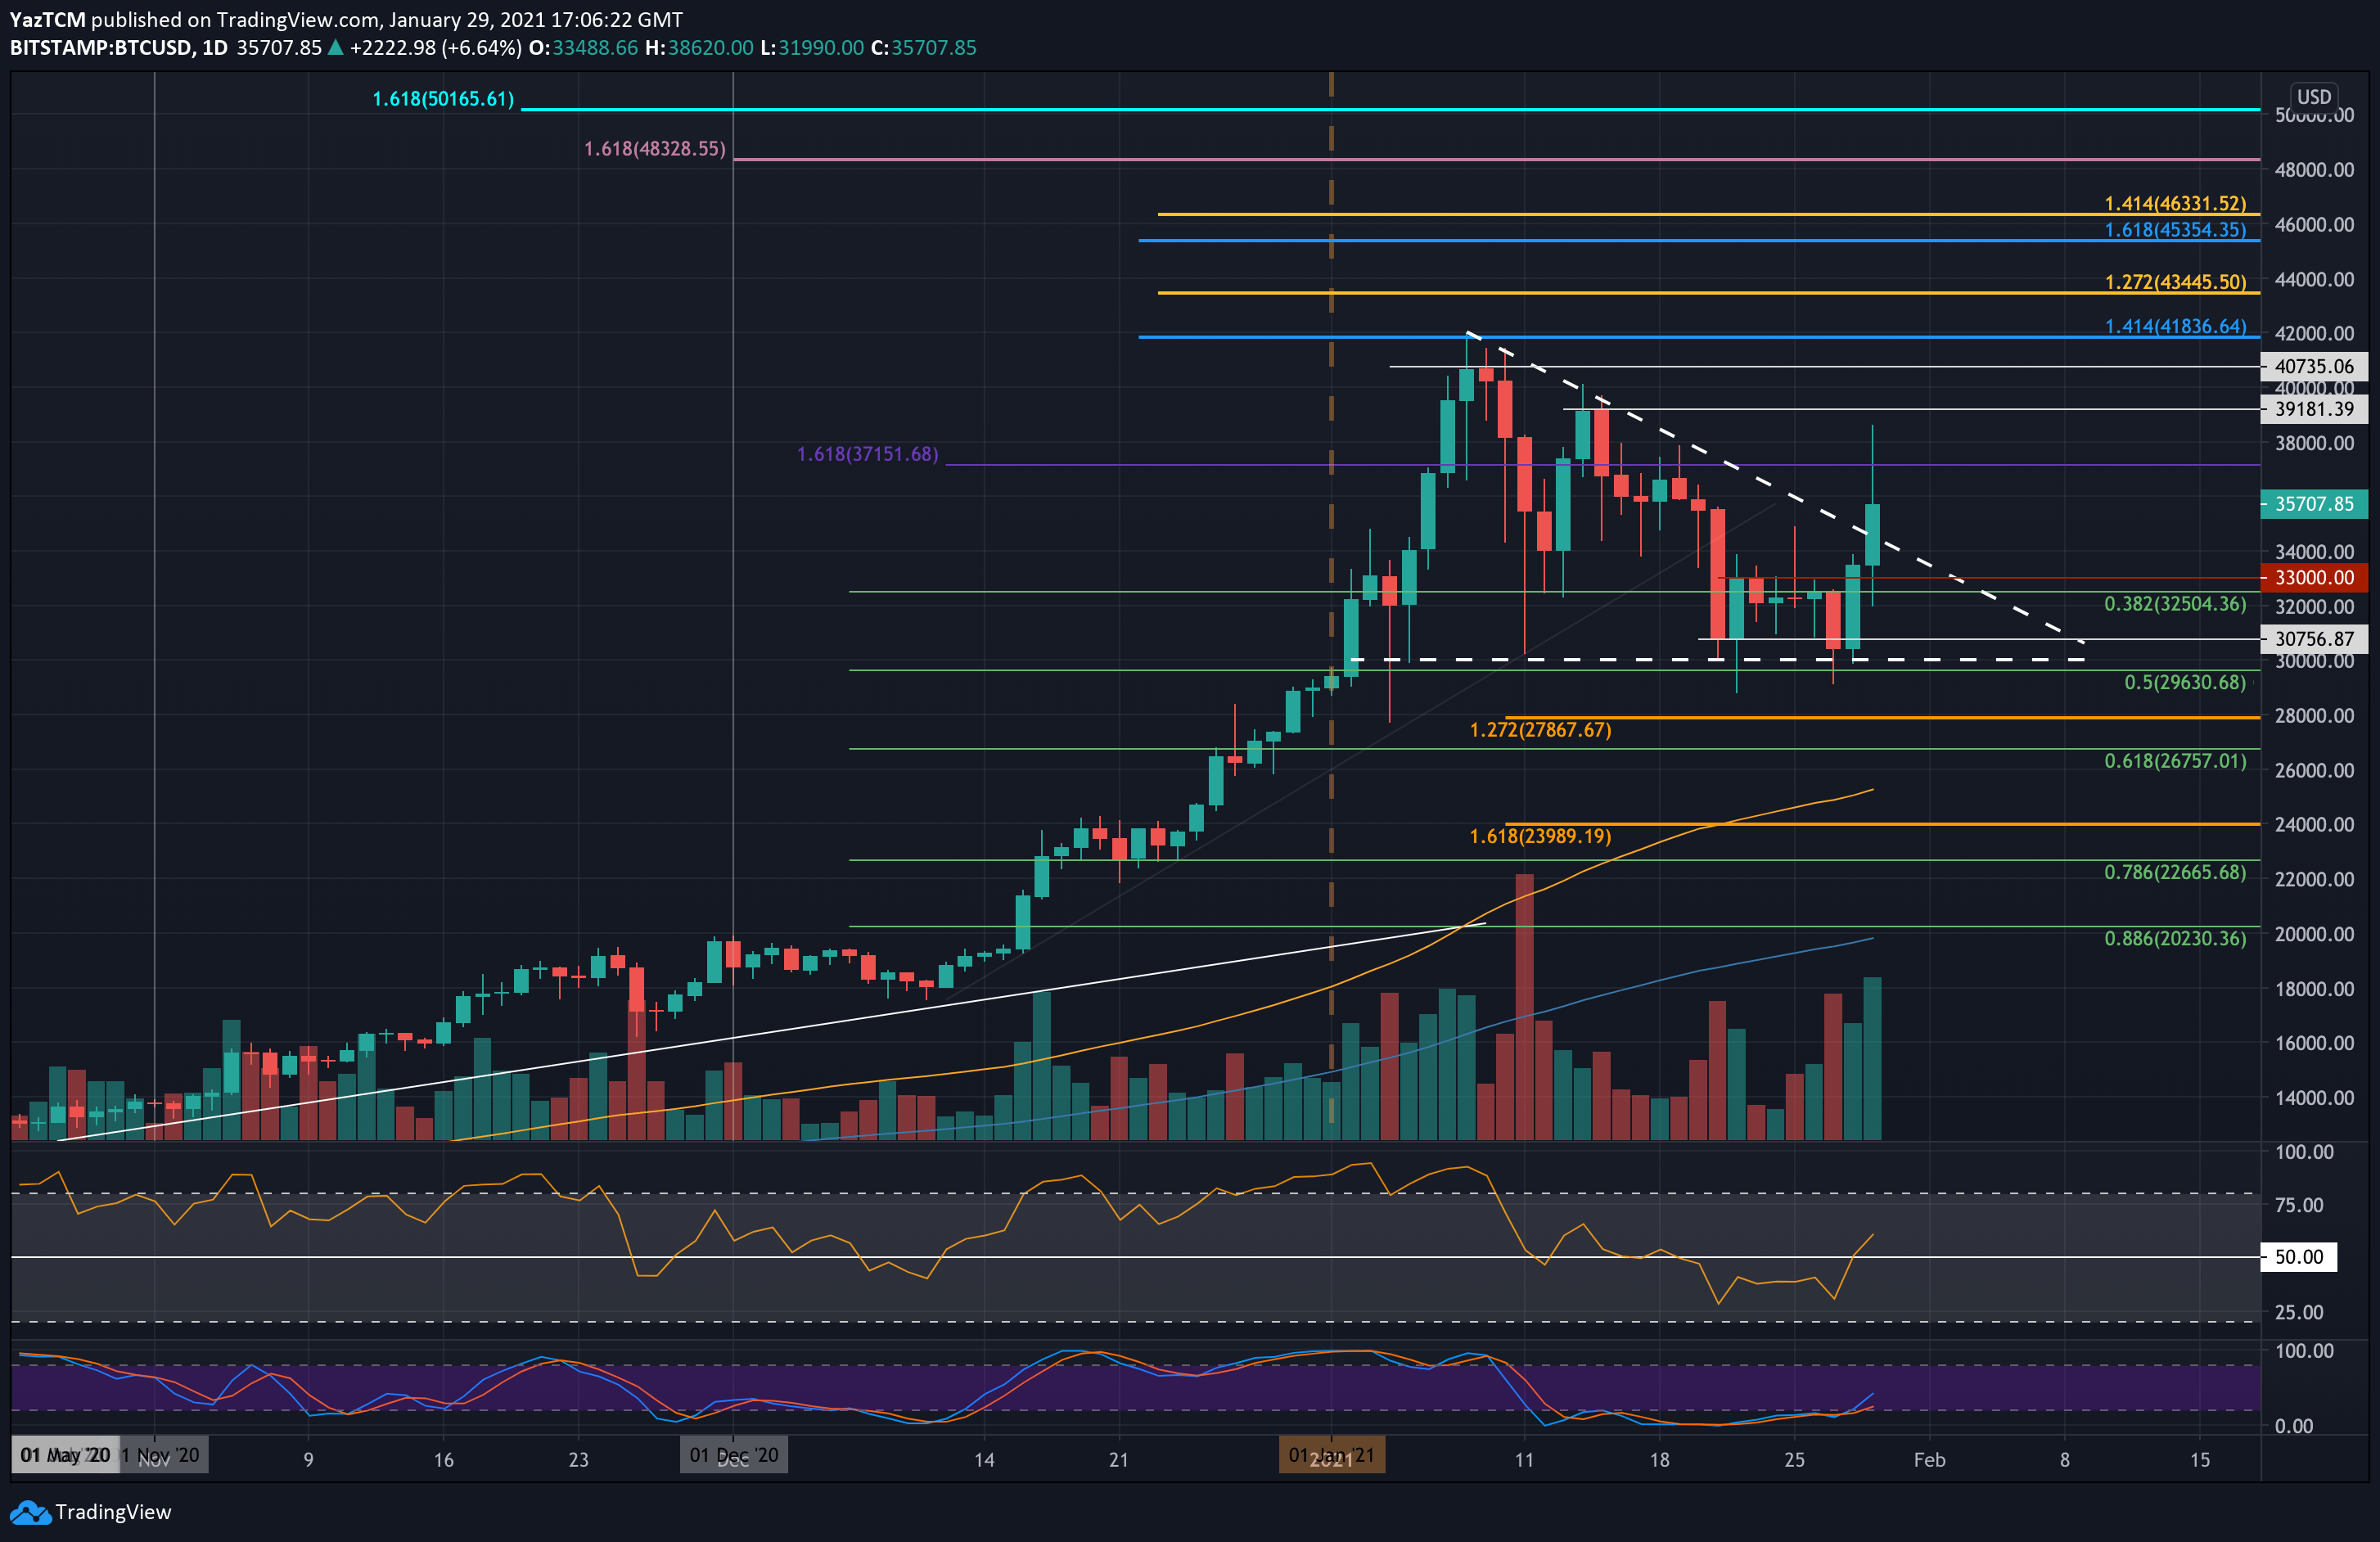
Bitcoin is up by a cool 20% over the past week as it currently trades near the $35,700 handle. The number 1 ranked cryptocurrency had been trapped within a range for the majority of the week as it oscillated between $33,000 and $30,000.
Looking at the larger picture, Bitcoin was trading within a descending triangle pattern since hitting the new ATH price at $42,000 in early January 2021. It had spiked beneath the lower boundary of this triangle at $30,000 throughout the week but managed to close each daily candle inside it.
Yesterday, Bitcoin started to rebound from $30,000 as it broke the previous week’s trading range as it broke above $33,000 to hit $34,000. Today, the surge continued higher, allowing Bitcoin to break the upper boundary of the triangle and end the current consolidation phase.
Looking ahead, the first level of resistance lies at $37,151. This is followed by $38,000, $39,190, $40,000, and $40,732. Beyond $41,000, resistance is found at $41,836, $42,000 (ATH), and $43,445 (1.272 Fib Extension).
On the other side, the first level of support lies at $36,000. This is followed by $34,000, $33,000, $32,500 (.382 Fib), $30,756, and $30,000.
Ethereum
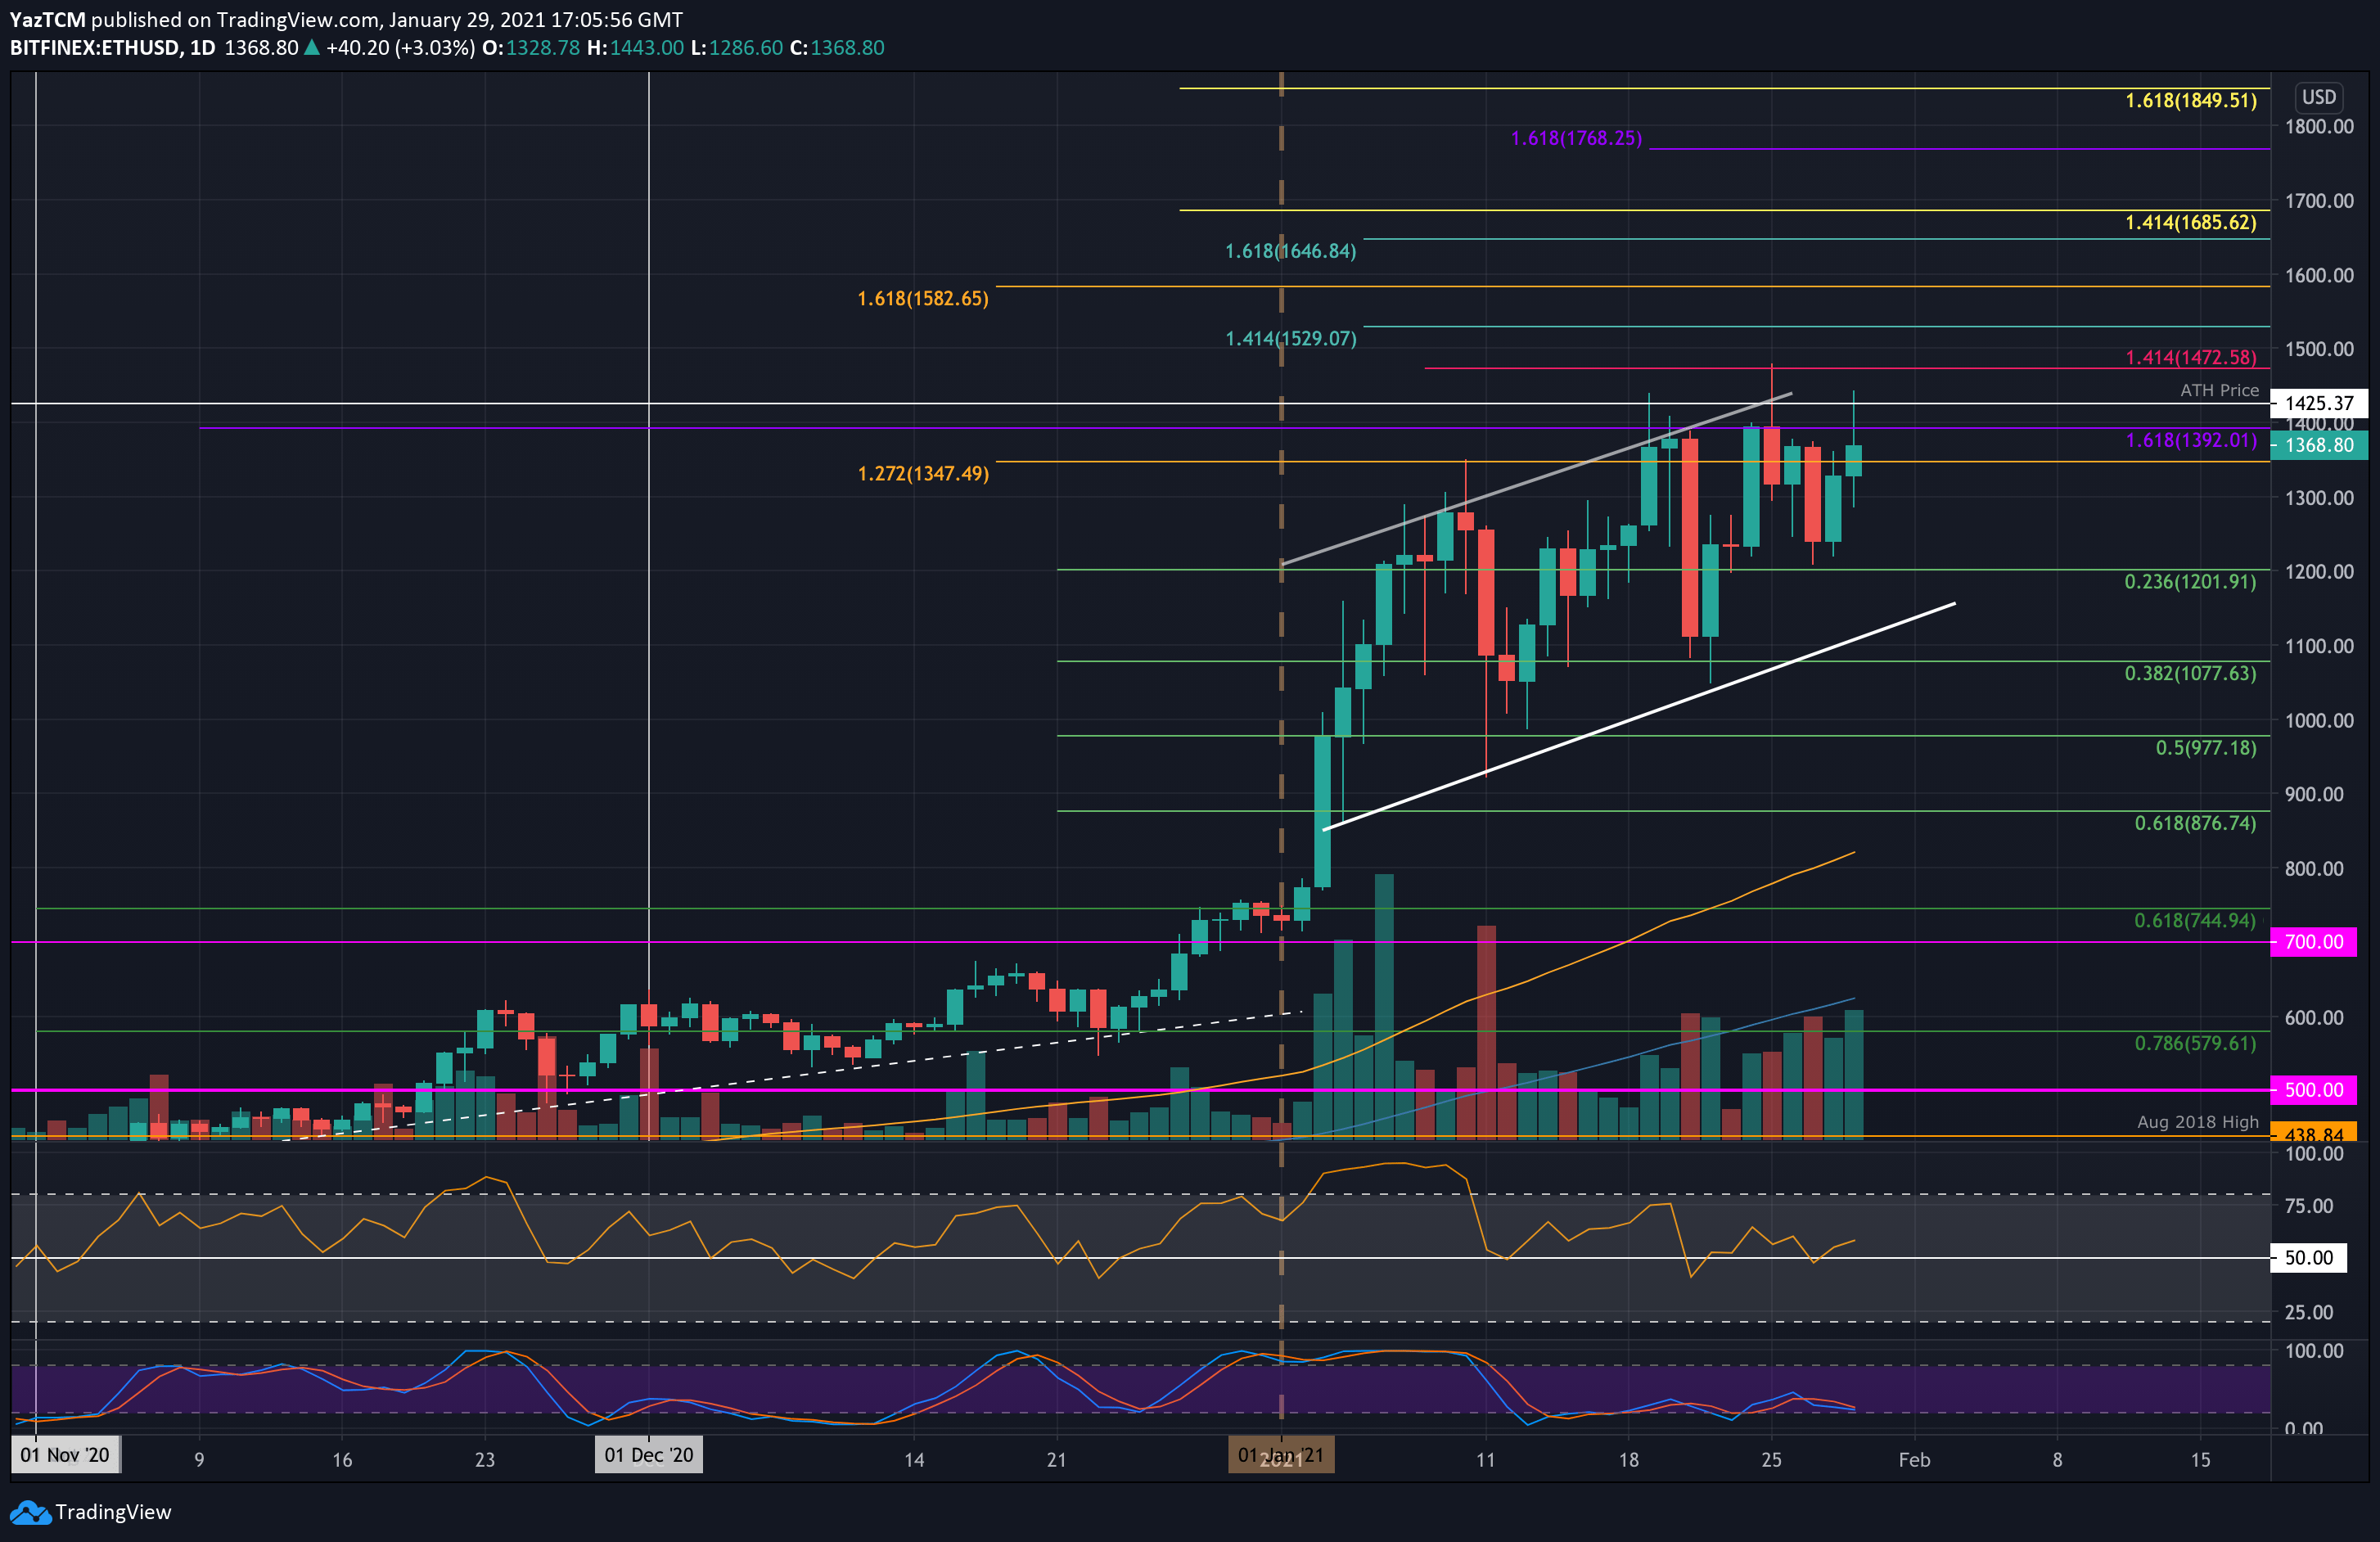
Ethereum is up by a total of 23.7% over the past week as it currently trades at the $1370 level. It started the week by trading at the $1200 support (.236 Fib) as it started to push higher.
On Monday, Etherrum managed to clock in a new ATH price at $1472 but still could not close a daily candle above the $1390 resistance level. It dropped from there over the course of the week until it found support at $12000 again and rebounded to return to the $1390 resistance today.
Looking ahead, the first level of resistance lies at $1425. This is followed by $1472 (ATH), $1530 (1.414 Fib Extension), $1580, and $1600. Additional resistance lies at $16446 (1.618 Fib Extension), $1685, and $1768.
On the other side, the first level of support lies at $1350. This is followed by $1300, $1200 (.236 Fib), $1100 (.382 Fib), and the rising support channel. Added support lies at $1000 and $977 (.5 Fib).
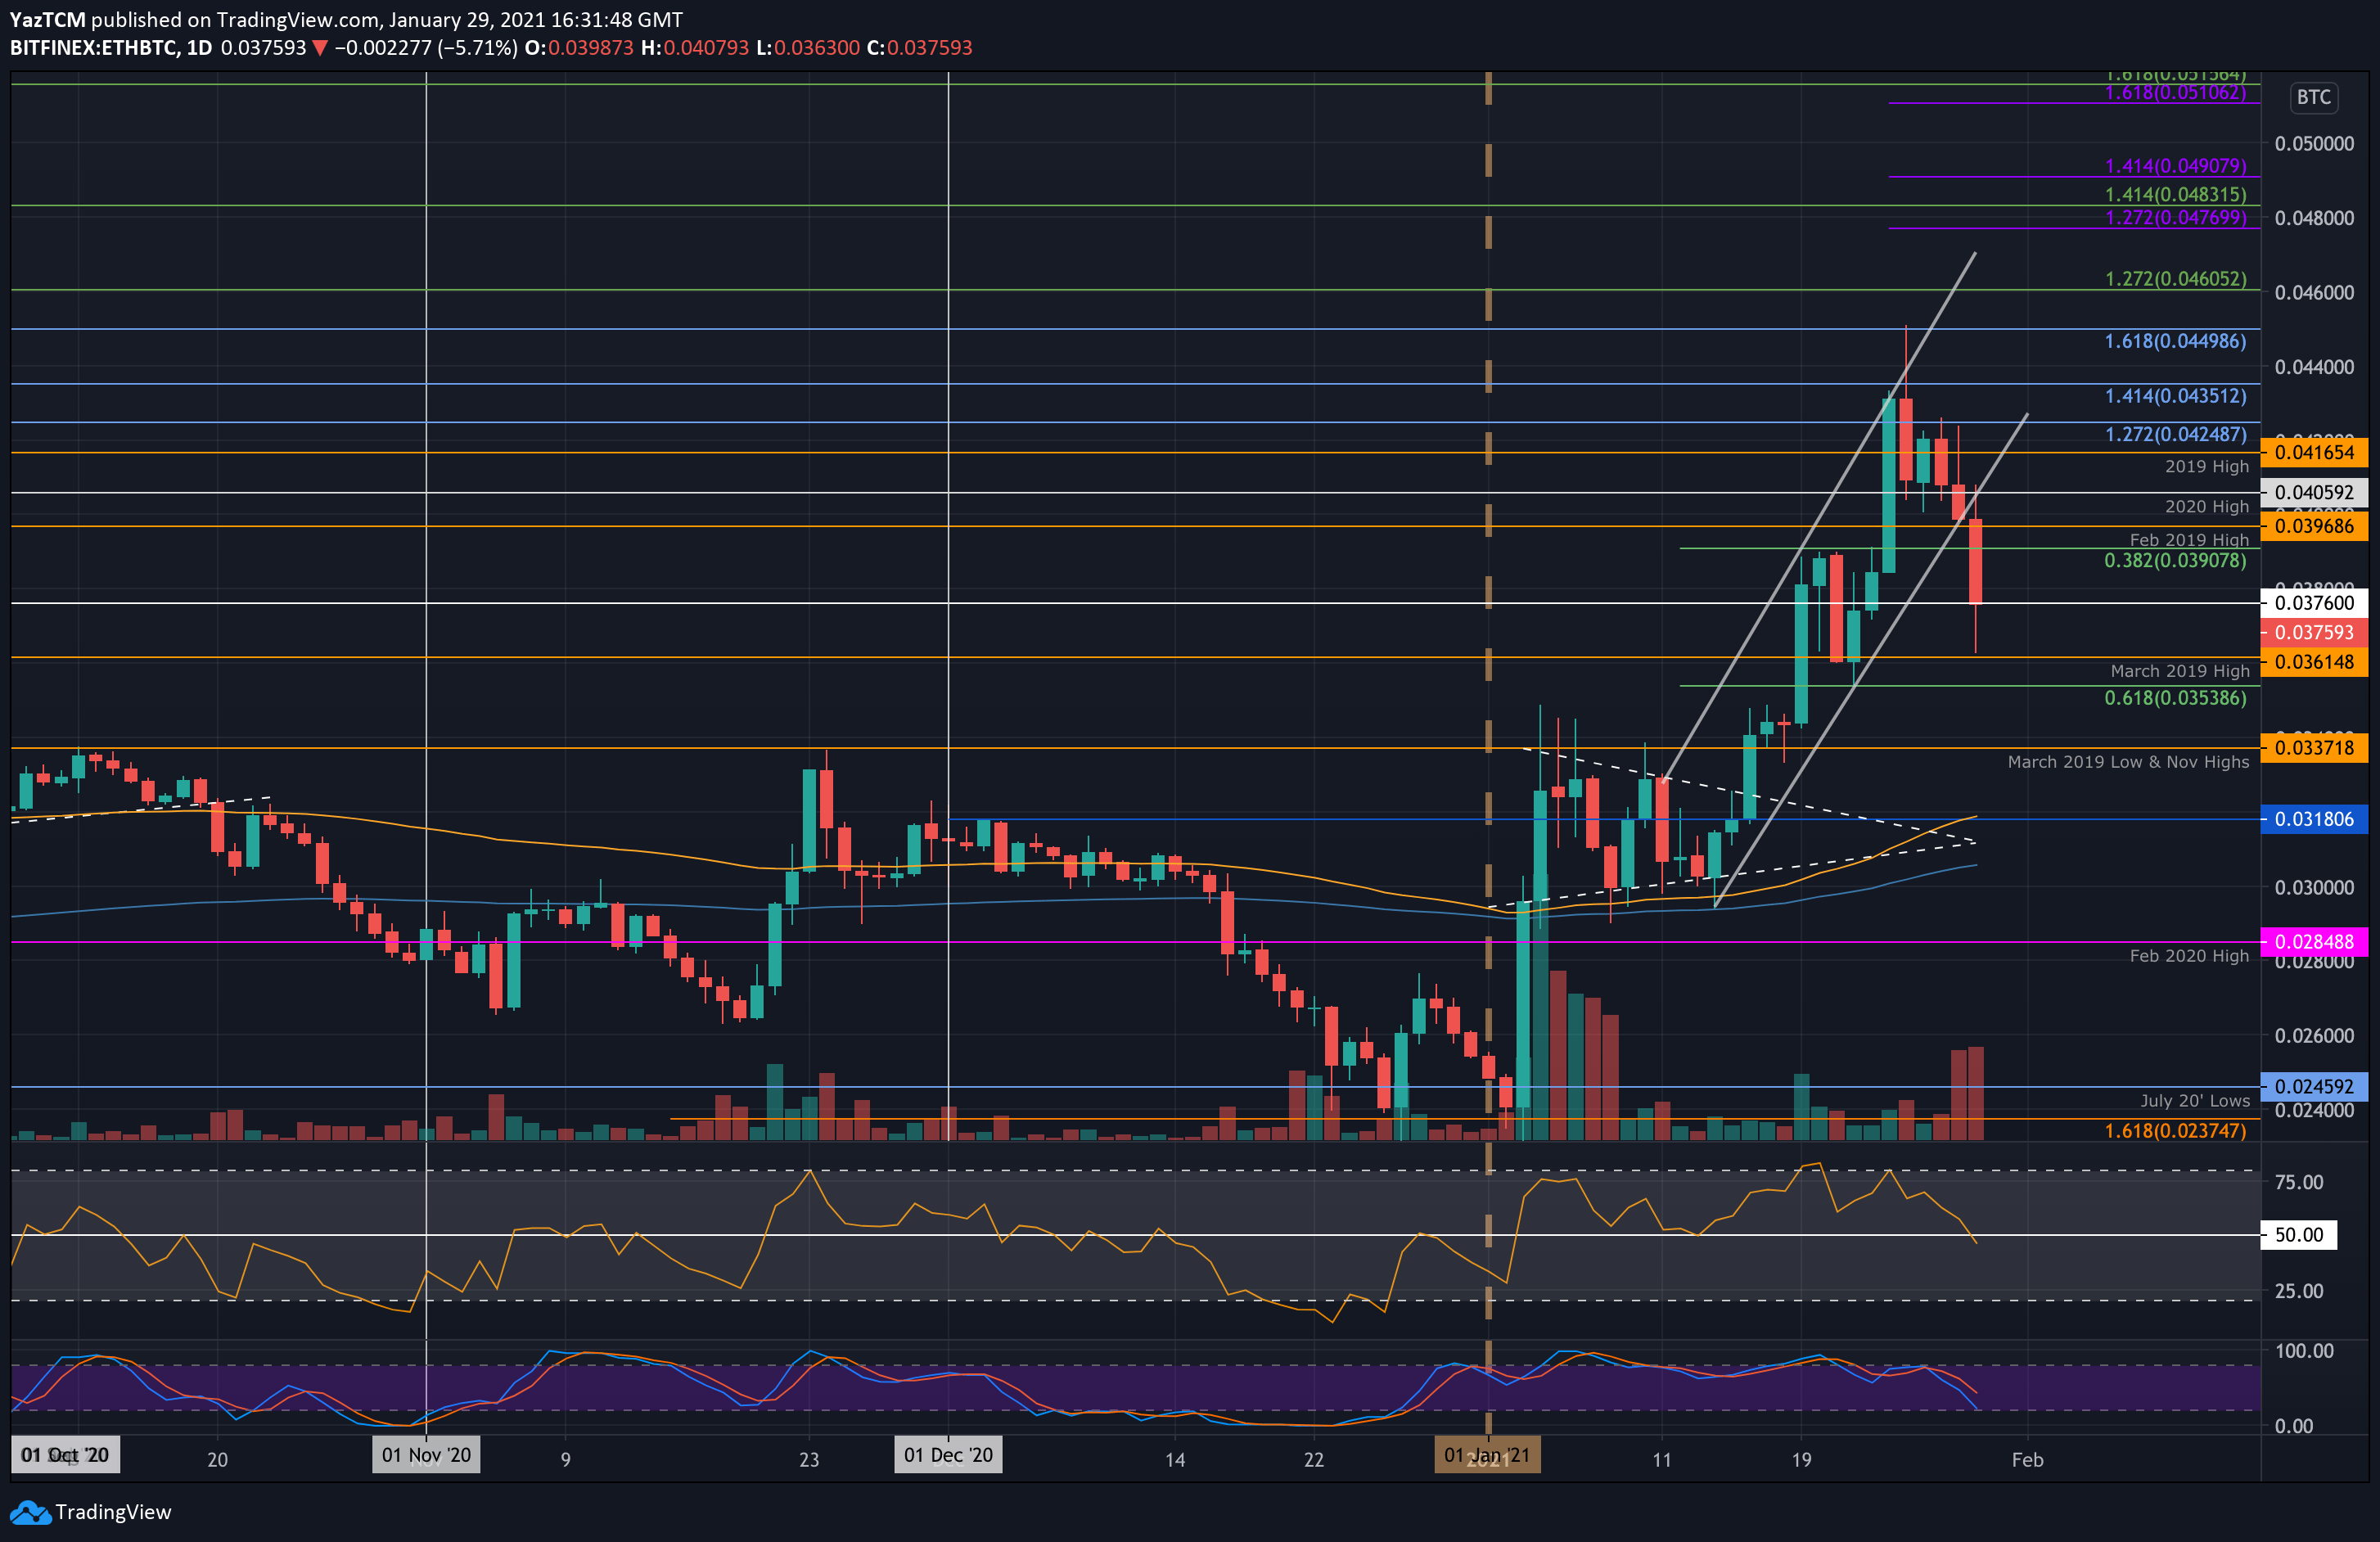
Against Bitcoin, Ethereum had pushed higher at the start of the week to create a 2021 high price at 0.045 BTC. It fell lower from there over the course of the week until support was found at 0.0405 BTC on Wednesday. This support was broken yesterday as ETH slipped into the lower boundary of the rising price channel.
Today, ETH plummeted beneath the channel as it dropped as low as 0.0361 BTC (March 2019 High). It has since rebounded slightly and is trading around 0.0376 BTC.
Looking ahead, the first level of support beneath 0.0376 BTC lies at 0.0361 BTC. This is followed by 0.0353 (.618 Fib), 0.0337 BTC (Nov 2020 Highs), and 0.0318 BTC (100-day EMA).
On the other side, resistance lies at 0.0390 BTC. This is followed by 0.0396 BTC (Feb 2019 High), 0.0405 BTC (2020 High), and 0.0416 BTC (2019 High).
Ripple
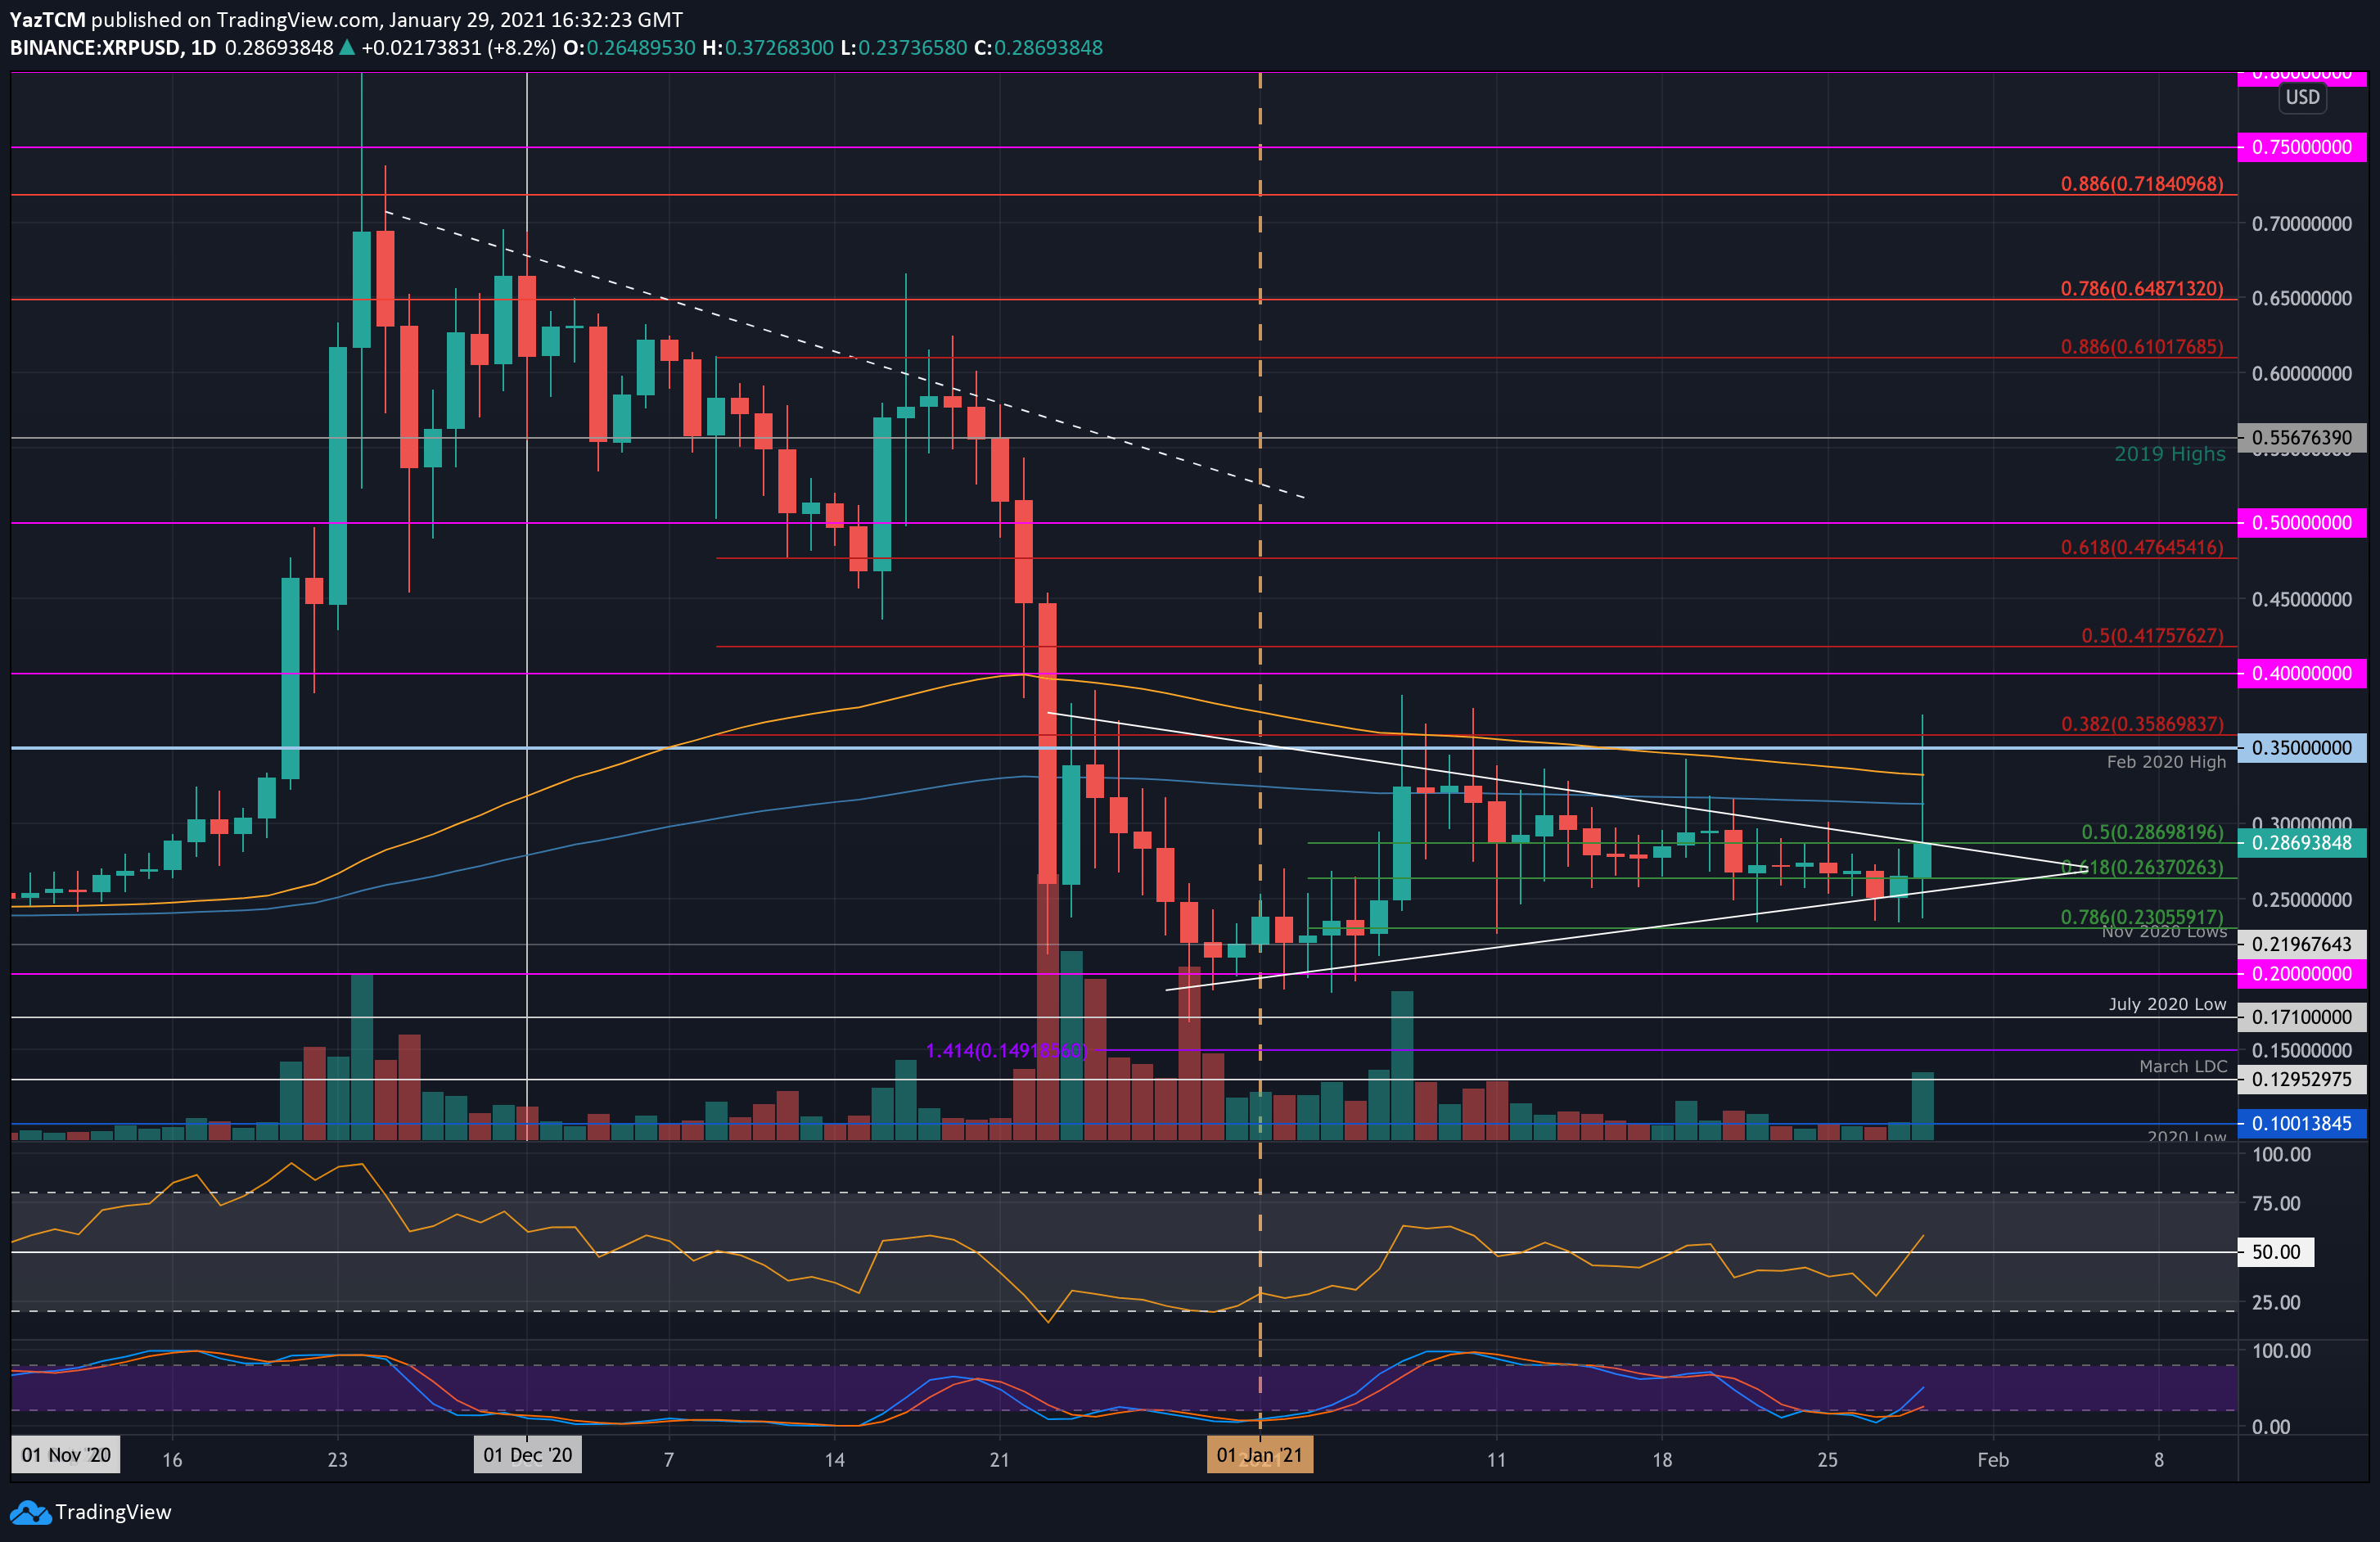
XRP is up by a small 6.5% this week but continues to trade within the symmetrical triangle pattern established in January 2021. The cryptocurrency was holding support at $0.263 (.618 Fib) for the majority of the past three weeks but slipped beneath here on Wednesday.
It managed to find support at the lower boundary of the triangle and rebounded from there. Today, XRP spiked higher above the triangle, reaching as high as $0.36 but has since dropped lower to trade back inside the boundaries of this triangle.
Looking ahead, if the bulls can break back above the triangle, the first level of resistance lies at $0.3. This is followed by resistance at $0.35 (Feb 2020 highs), $0.358 (bearish .382 Fib), and $0.4. Added resistance lies at $0.417 (bearish .5 Fib) and $0.45.
On the other side, the first support lies at $0.263 (.618 Fib). This is followed by the lower boundary of the triangle, $0.23 (.786 Fib), $0.219 (Nov 2020 lows), and $0.2.
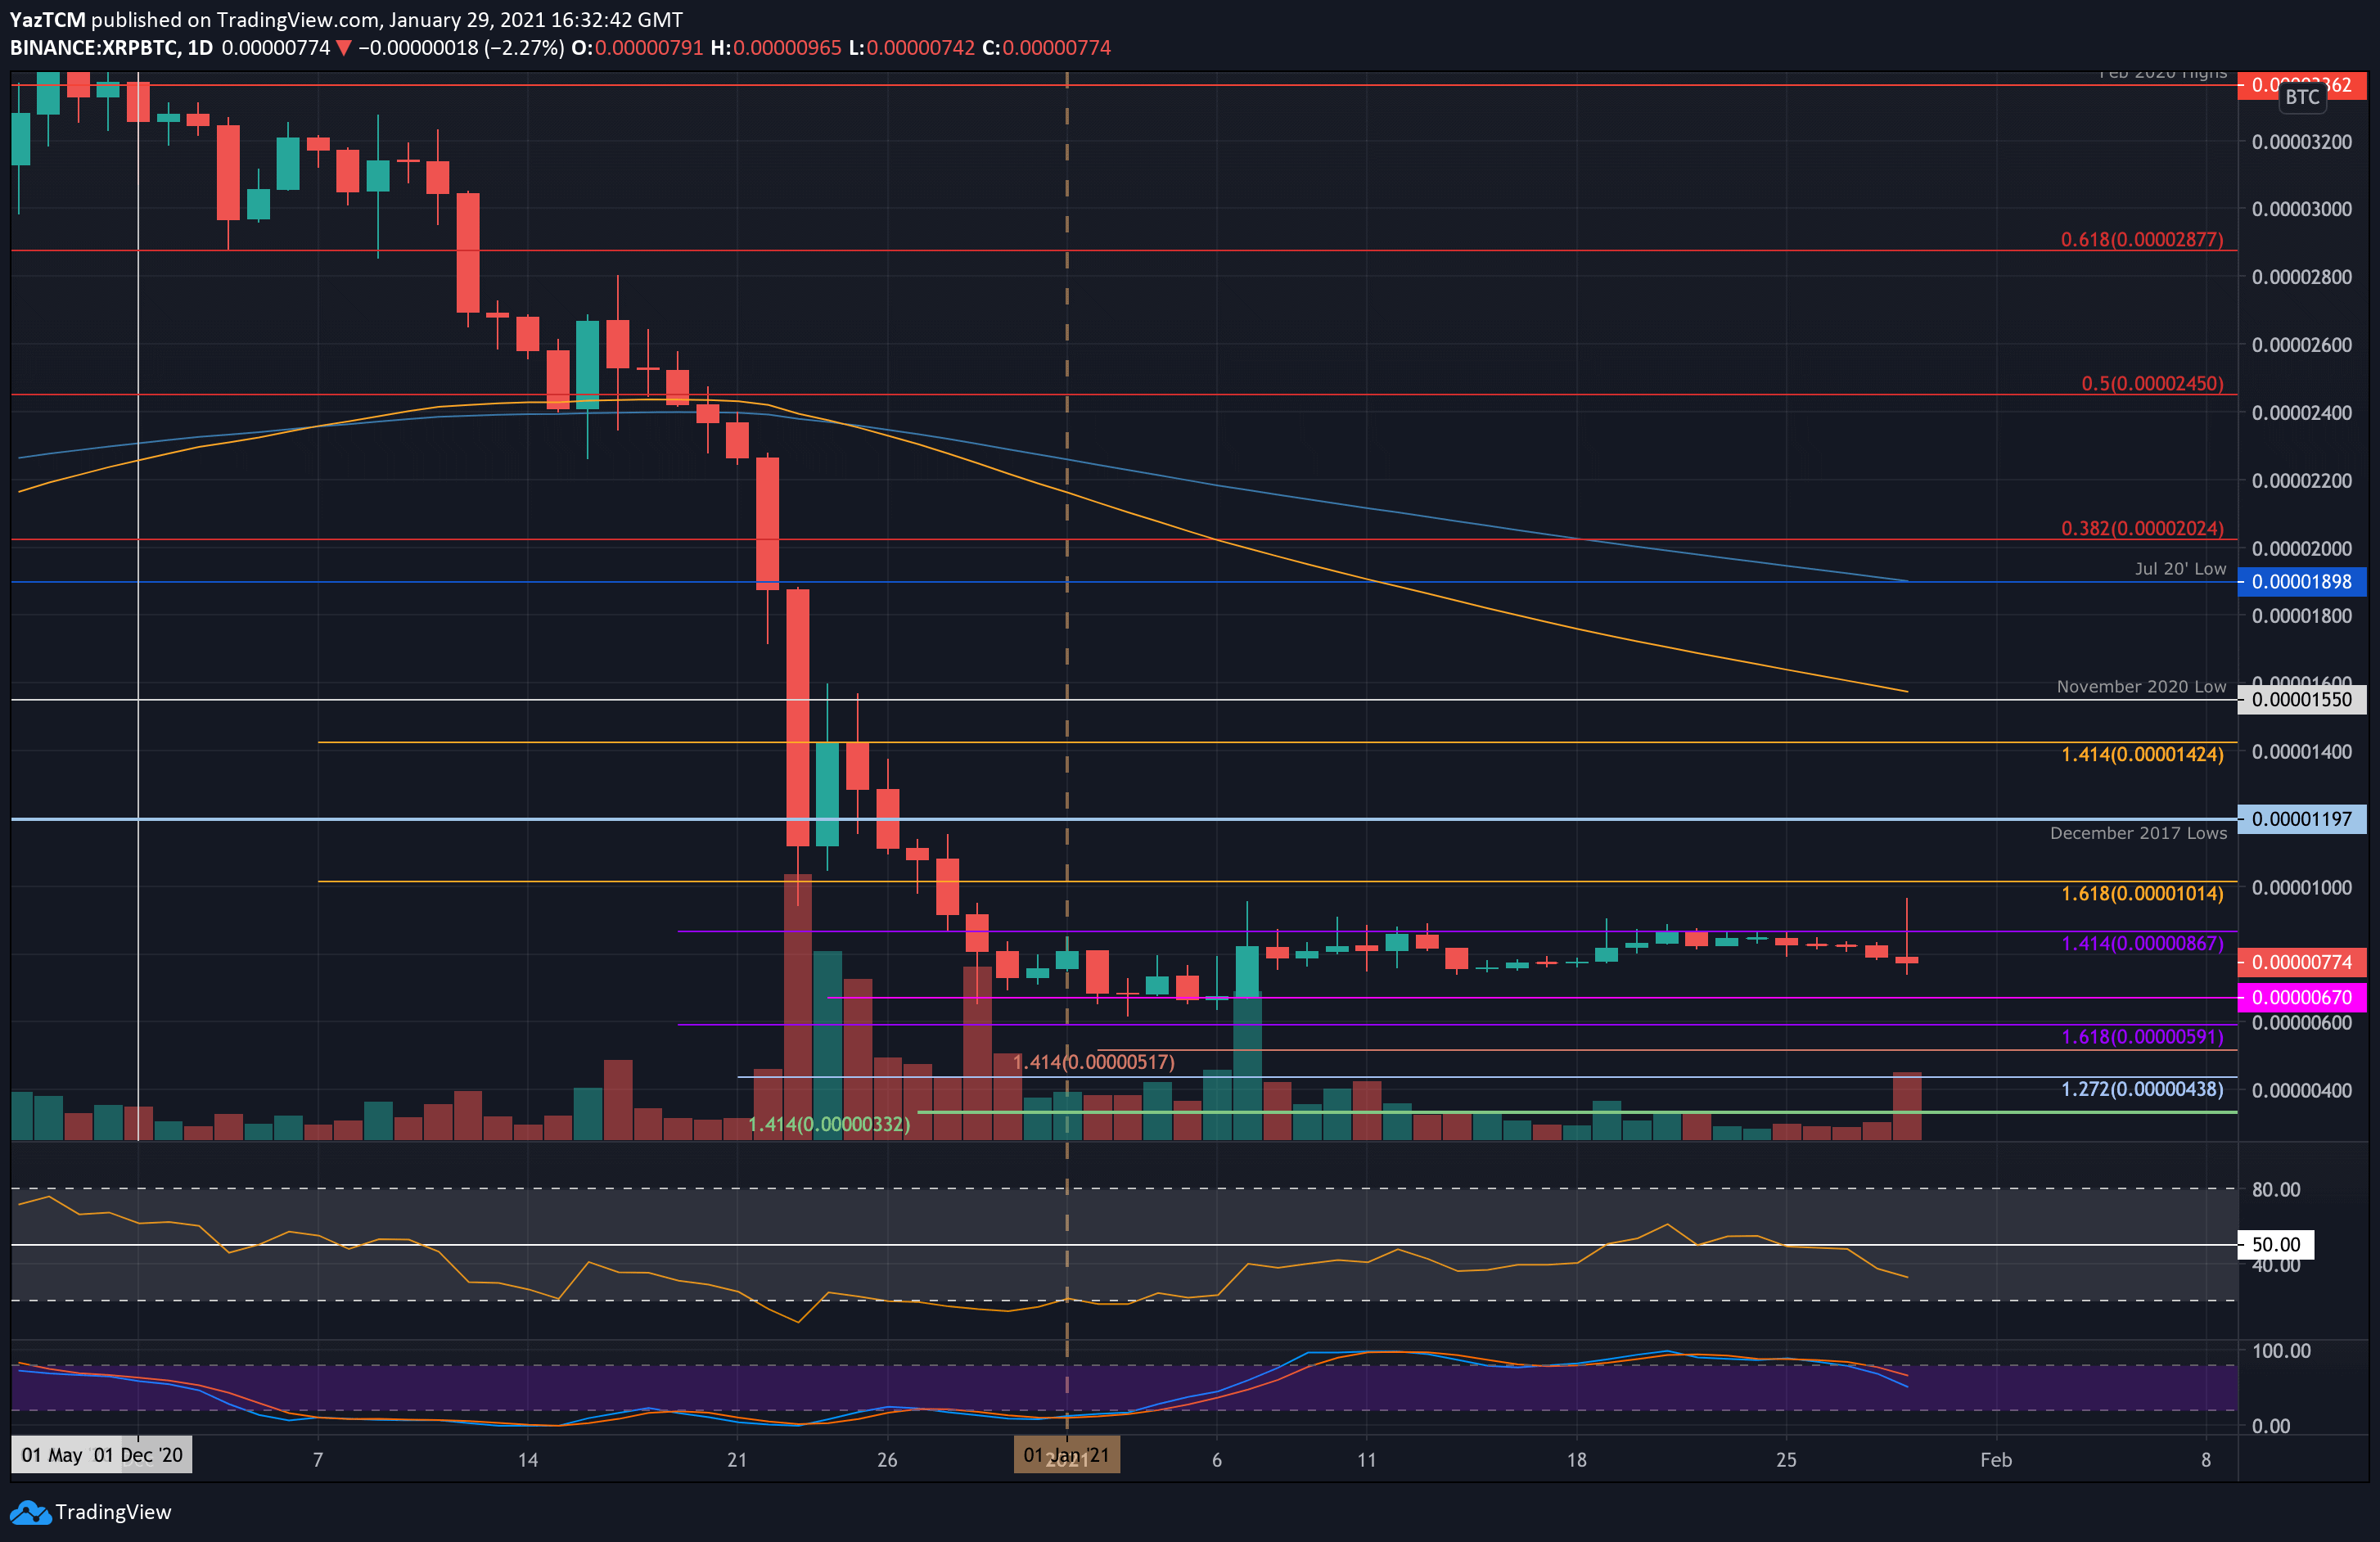
Against Bitcoin, XRP continues to trade in the narrow range that it has been trading within throughout January 2021. The boundaries lie at 867 SAT and 670 SAT.
XRP attempted to break the upper boundary today, almost reaching as high as 1000 SAT, but has since dropped lower to trade at 774 SAT.
Moving forward, the first level of resistance lies at 867 SAT. This is followed by 1015 SAT, 1200 SAT (Dec 2017 lows), 1425 SAT, and 1550 SAT (Nov 2020 low & 100-day EMA).
On the other side, the first support lies at 700 SAT. This is followed by 670 SAT, 600 SAT, 590 SAT, and 500 SAT.
Stellar
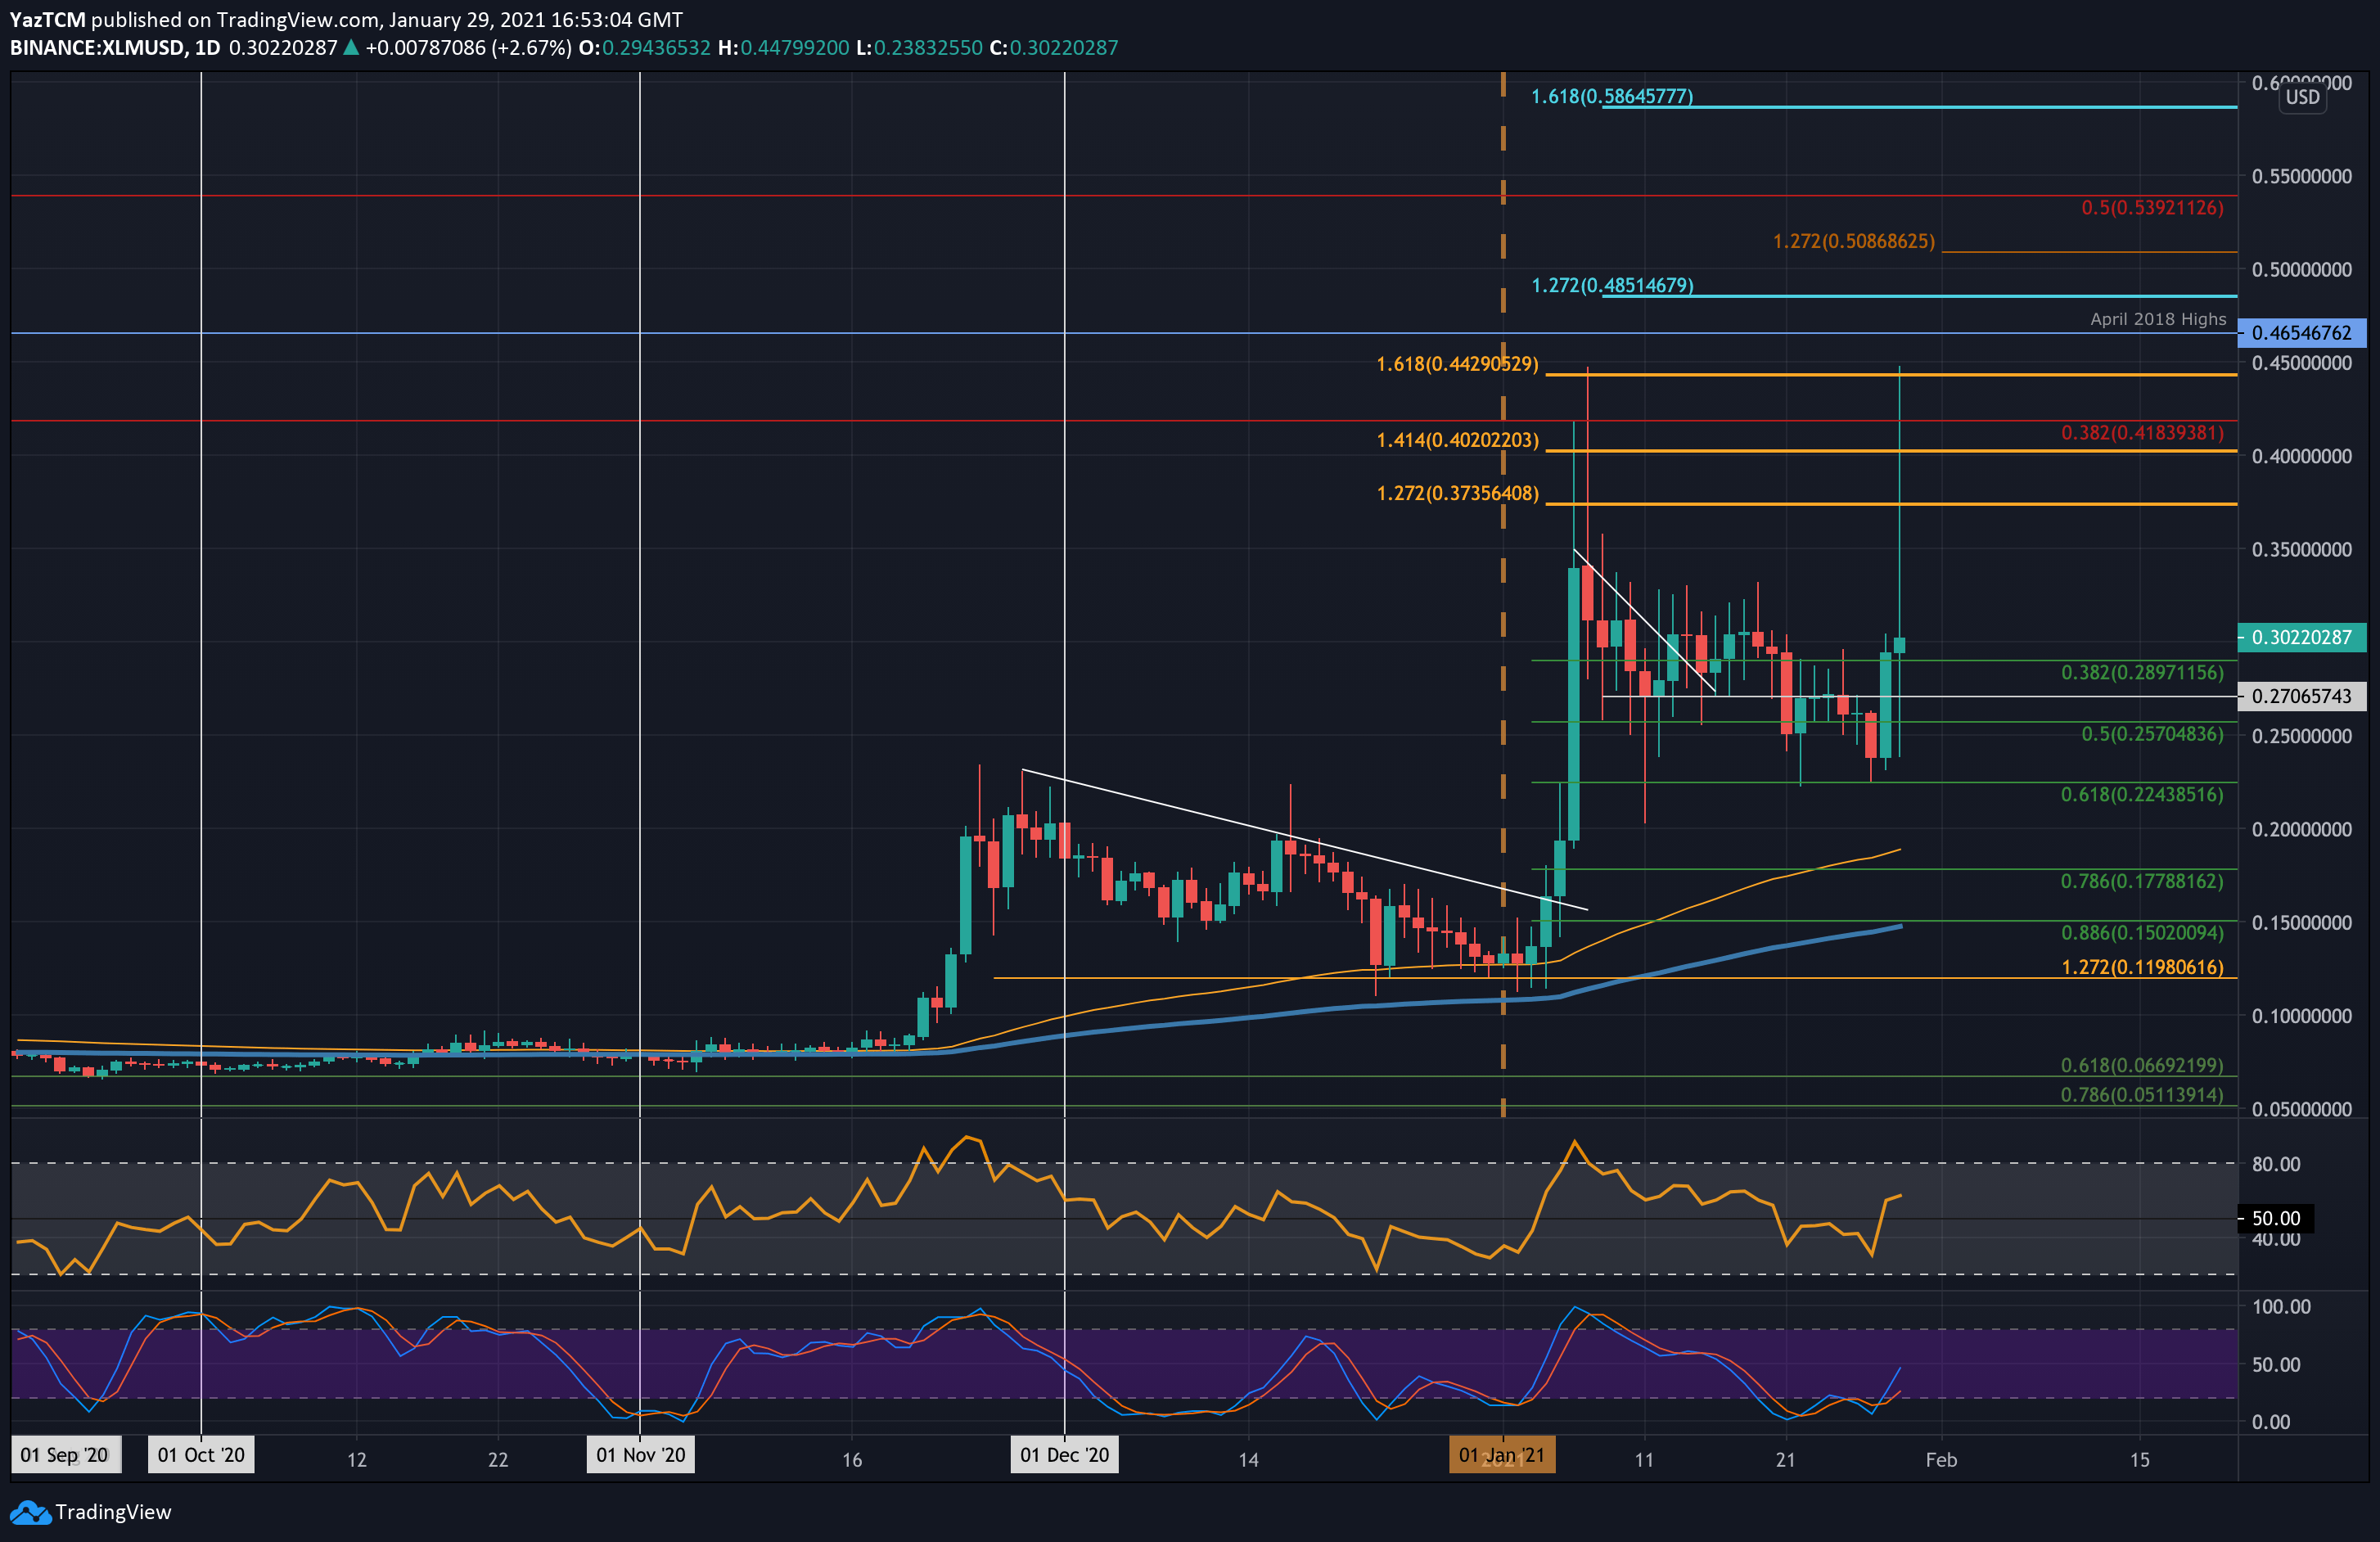
XLM is up by a total of 21.4% over the past week as the coin currently trades at $0.3. The coin started the week at $0.27 and started to head lower from there. It continued to fall until support was met at $0.225 (.618 Fib) on Wednesday, which allowed it to rebound.
After rebounding, XLM surged to $0.3 yesterday. Today, it surged as much as 50% to reach as high as $0.447 but quickly came back down to trade at the current $0.3 level.
Looking ahead, if the bulls kick into gear again, the first level of solid resistance lies at $0.35. This is followed by $373 (1.272 Fib Extnesion), $0.4, and $0.418 (bearish .382 Fib). Additional resistance lies at $0.442 (1.618 Fib Extension), $0.464 (April 2018 highs), $0.485 (1.272 Fib Extension – blue), and $0.5.
On the other side, the first support lies at $0.289 (.382 Fib). This is followed by $0.27, $0.257 (.5 Fib), $0.224 (.618 Fib), and $0.2 (100-day EMA).
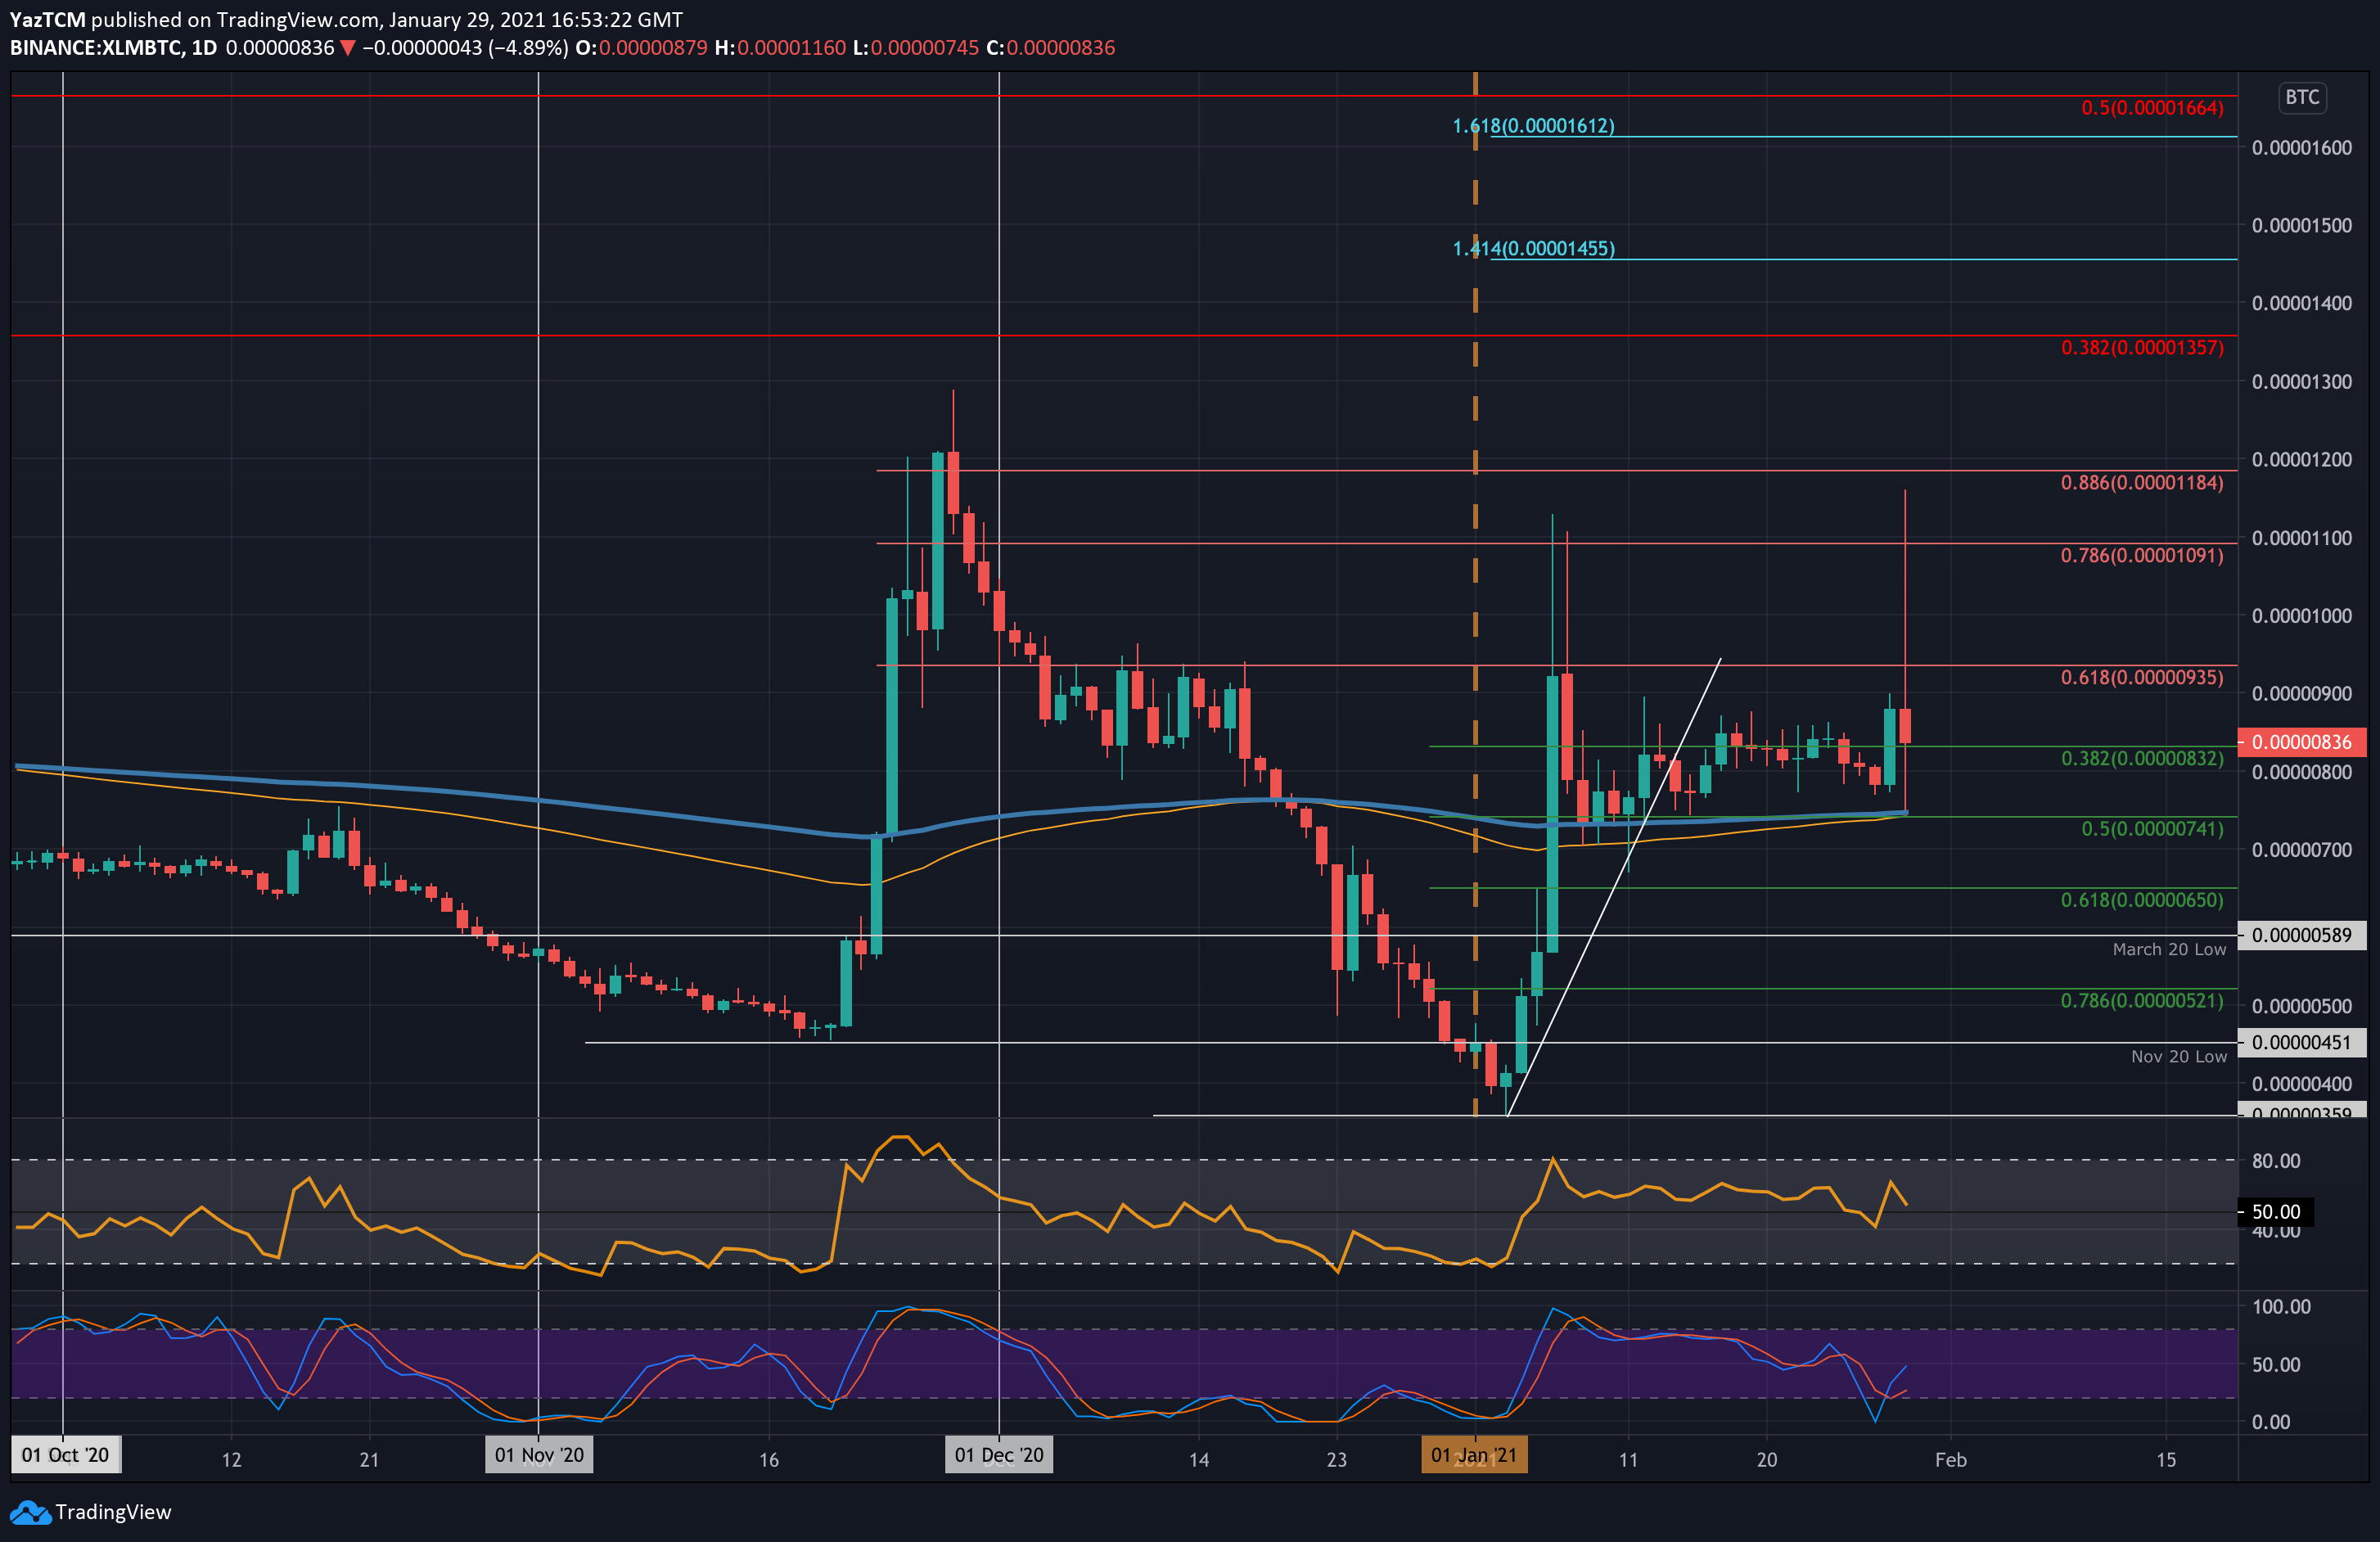
Against Bitcoin, XLM has traded sideways this week. Yesterday, it bounced from 775 SAT as it pushed higher into 900 SAT. Today, it surged as high as 1180 SAT before coming back down to trade at the current 836 SAT level.
Looking ahead, the first level of resistance lies at 900 SAT. This is followed by 935 SAT (bearish .618 Fib), 1000 SAT, 1091 SAT (Bearish .786 Fib), 1180 SAT (today’s high), and 1185 SAT (bearish .886 Fib). Added resistance lies at 1200 SAT and 1300 SAT.
On the other side, support is first expected at 832 SAT (.382 Fib). This is followed by 775 SAT, 741 SAT (.5 Fib & 200-days EMA), 700 SAT, and 650 SAT (.618 Fib).
Uniswap
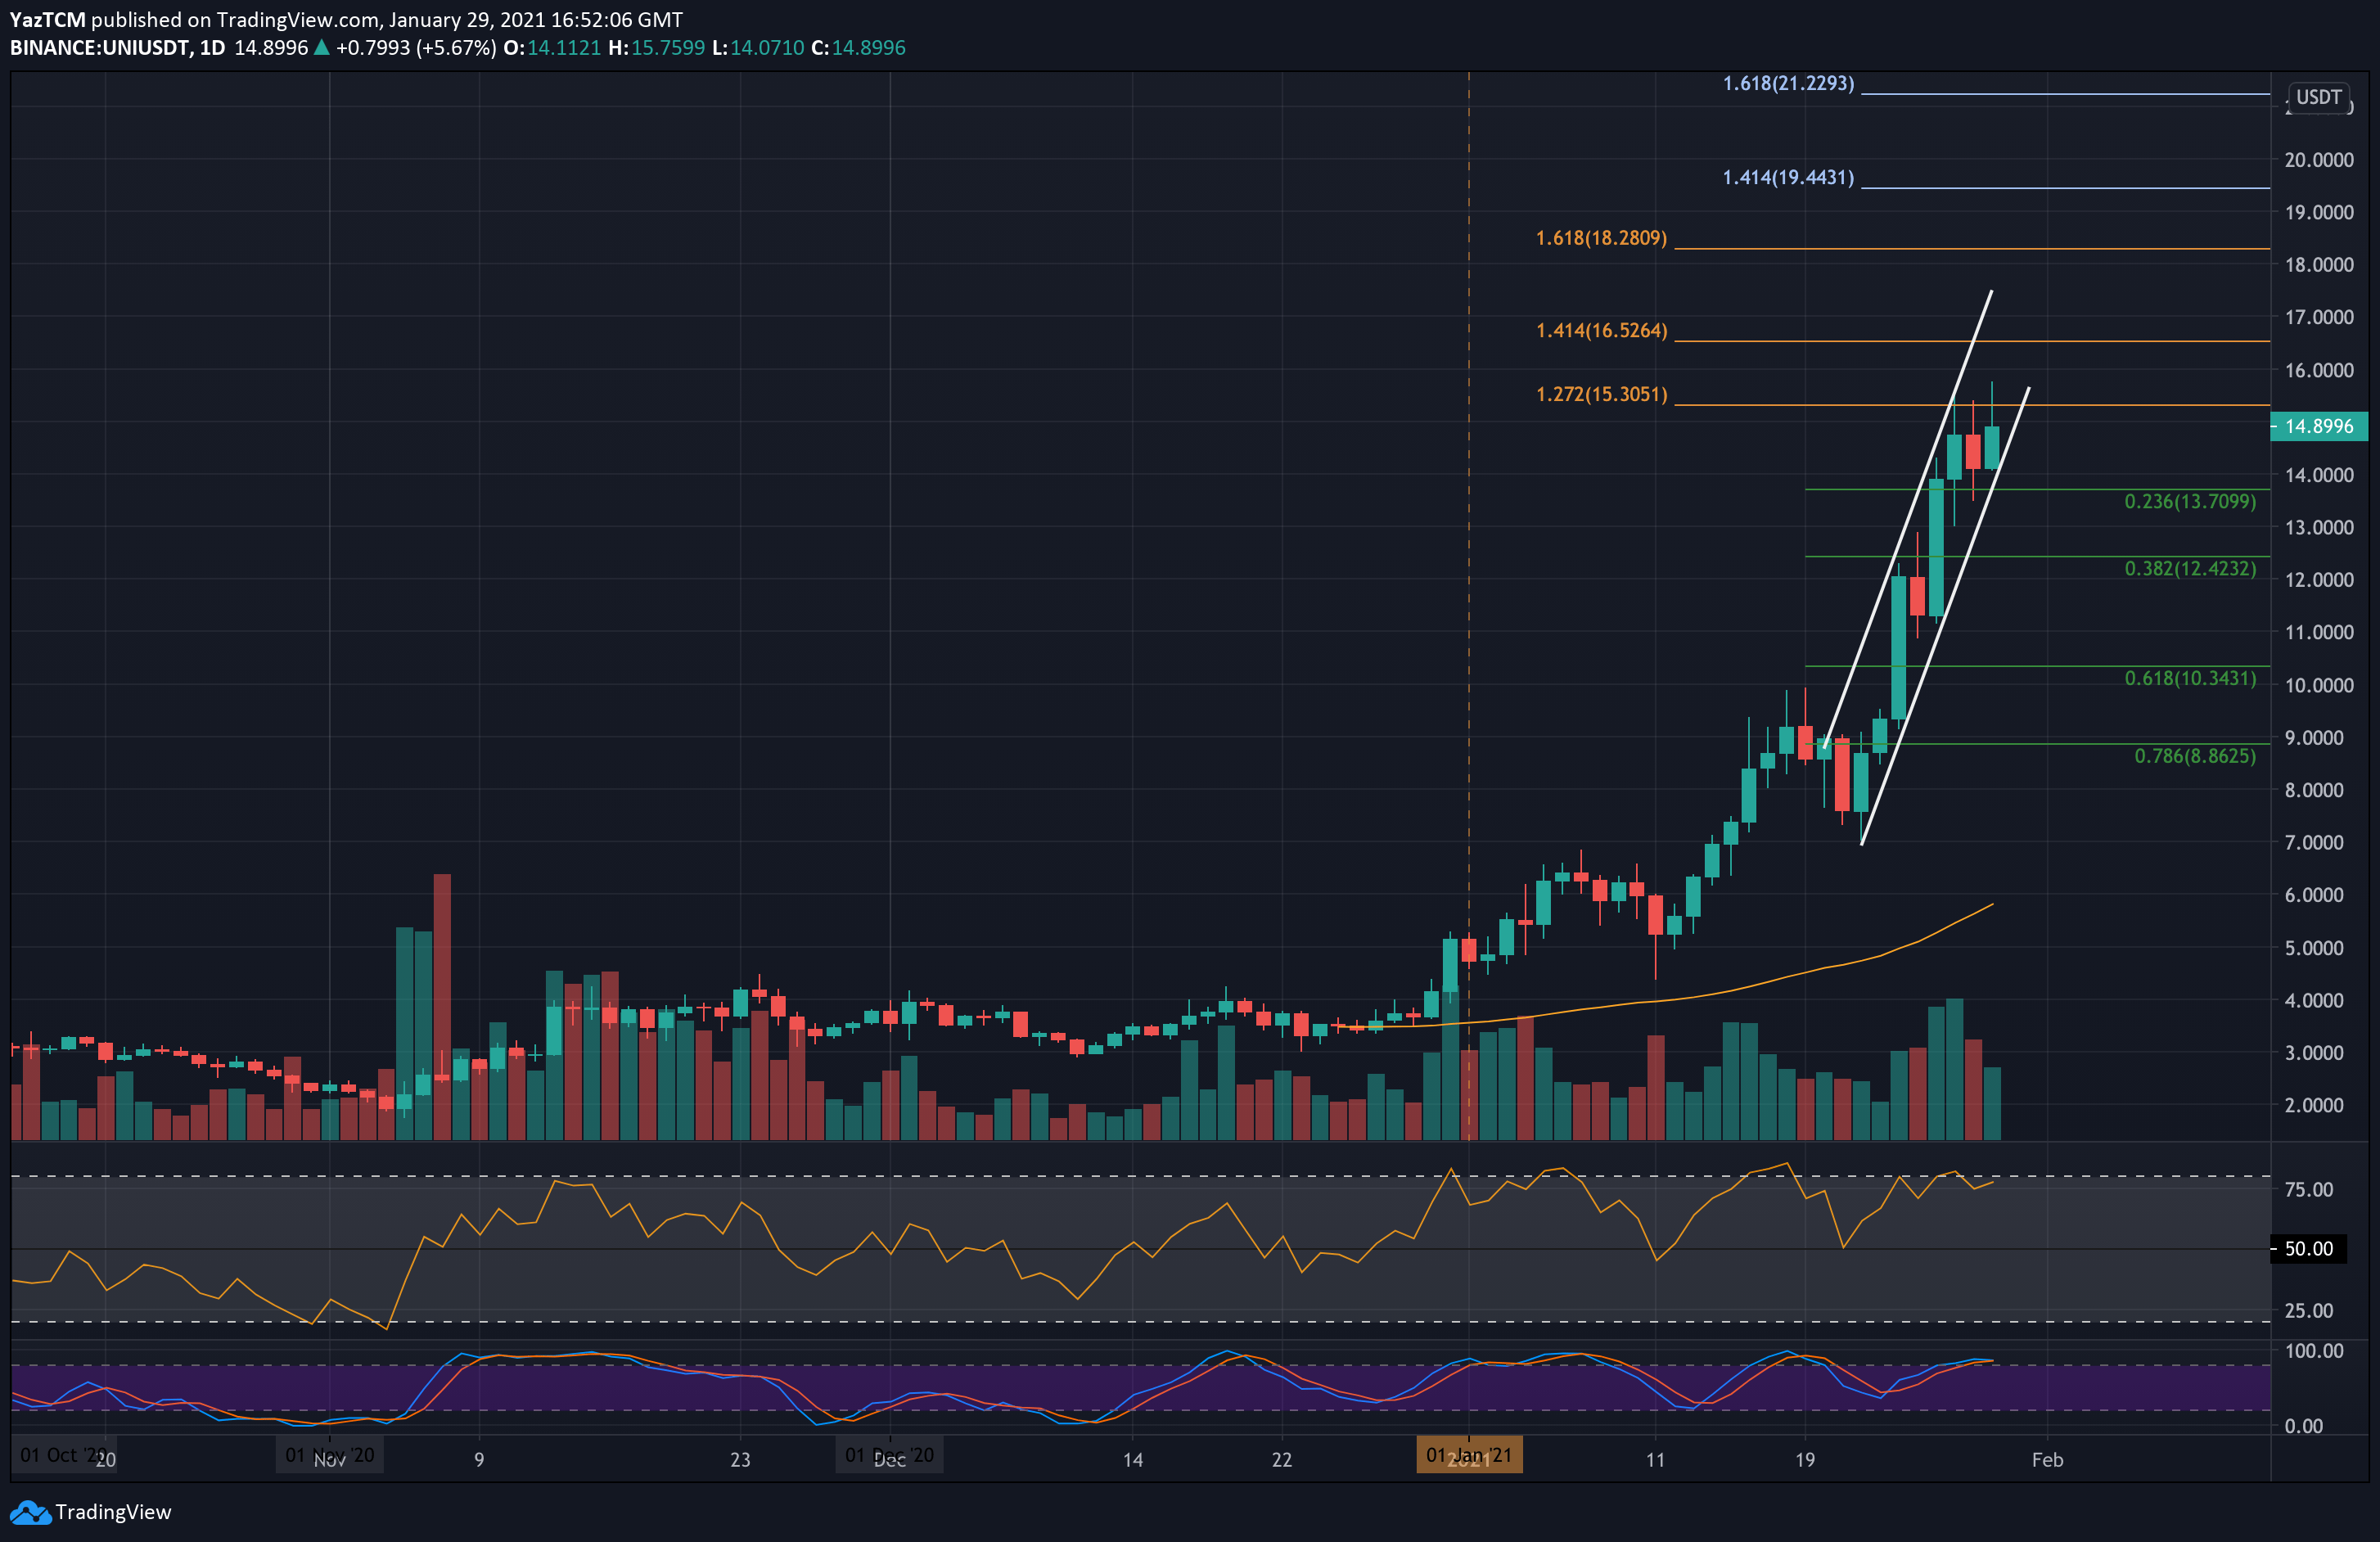
Uniswap is up by an epic 88% over the past week as it trades around $14.90. The coin started the week by pushing higher from $8 as it started making a steeply ascending price channel. The cryptocurrency surge continued throughout the week until meeting resistance at $15.30 (1.272 Fib Extension & upper boundary of the channel) on Wednesday.
It stalled around $14 yesterday but pushed as high as $15.75 today. It has since dropped back beneath $15.
Looking ahead, the first level of resistance lies at $15.30 (1.272 Fib Extension). This is followed by $16, $16.52 (1.414 Fib Extension), $17, and $18. Added resistance lies at $18.20 (1.618 Fib Extension), $19.45, and $20.
On the other side, the first level of support lies at $14 (lower boundary of the channel). This is followed by $13.70 (.236 Fib), $13, $12.42 (.382 Fib), and $11.
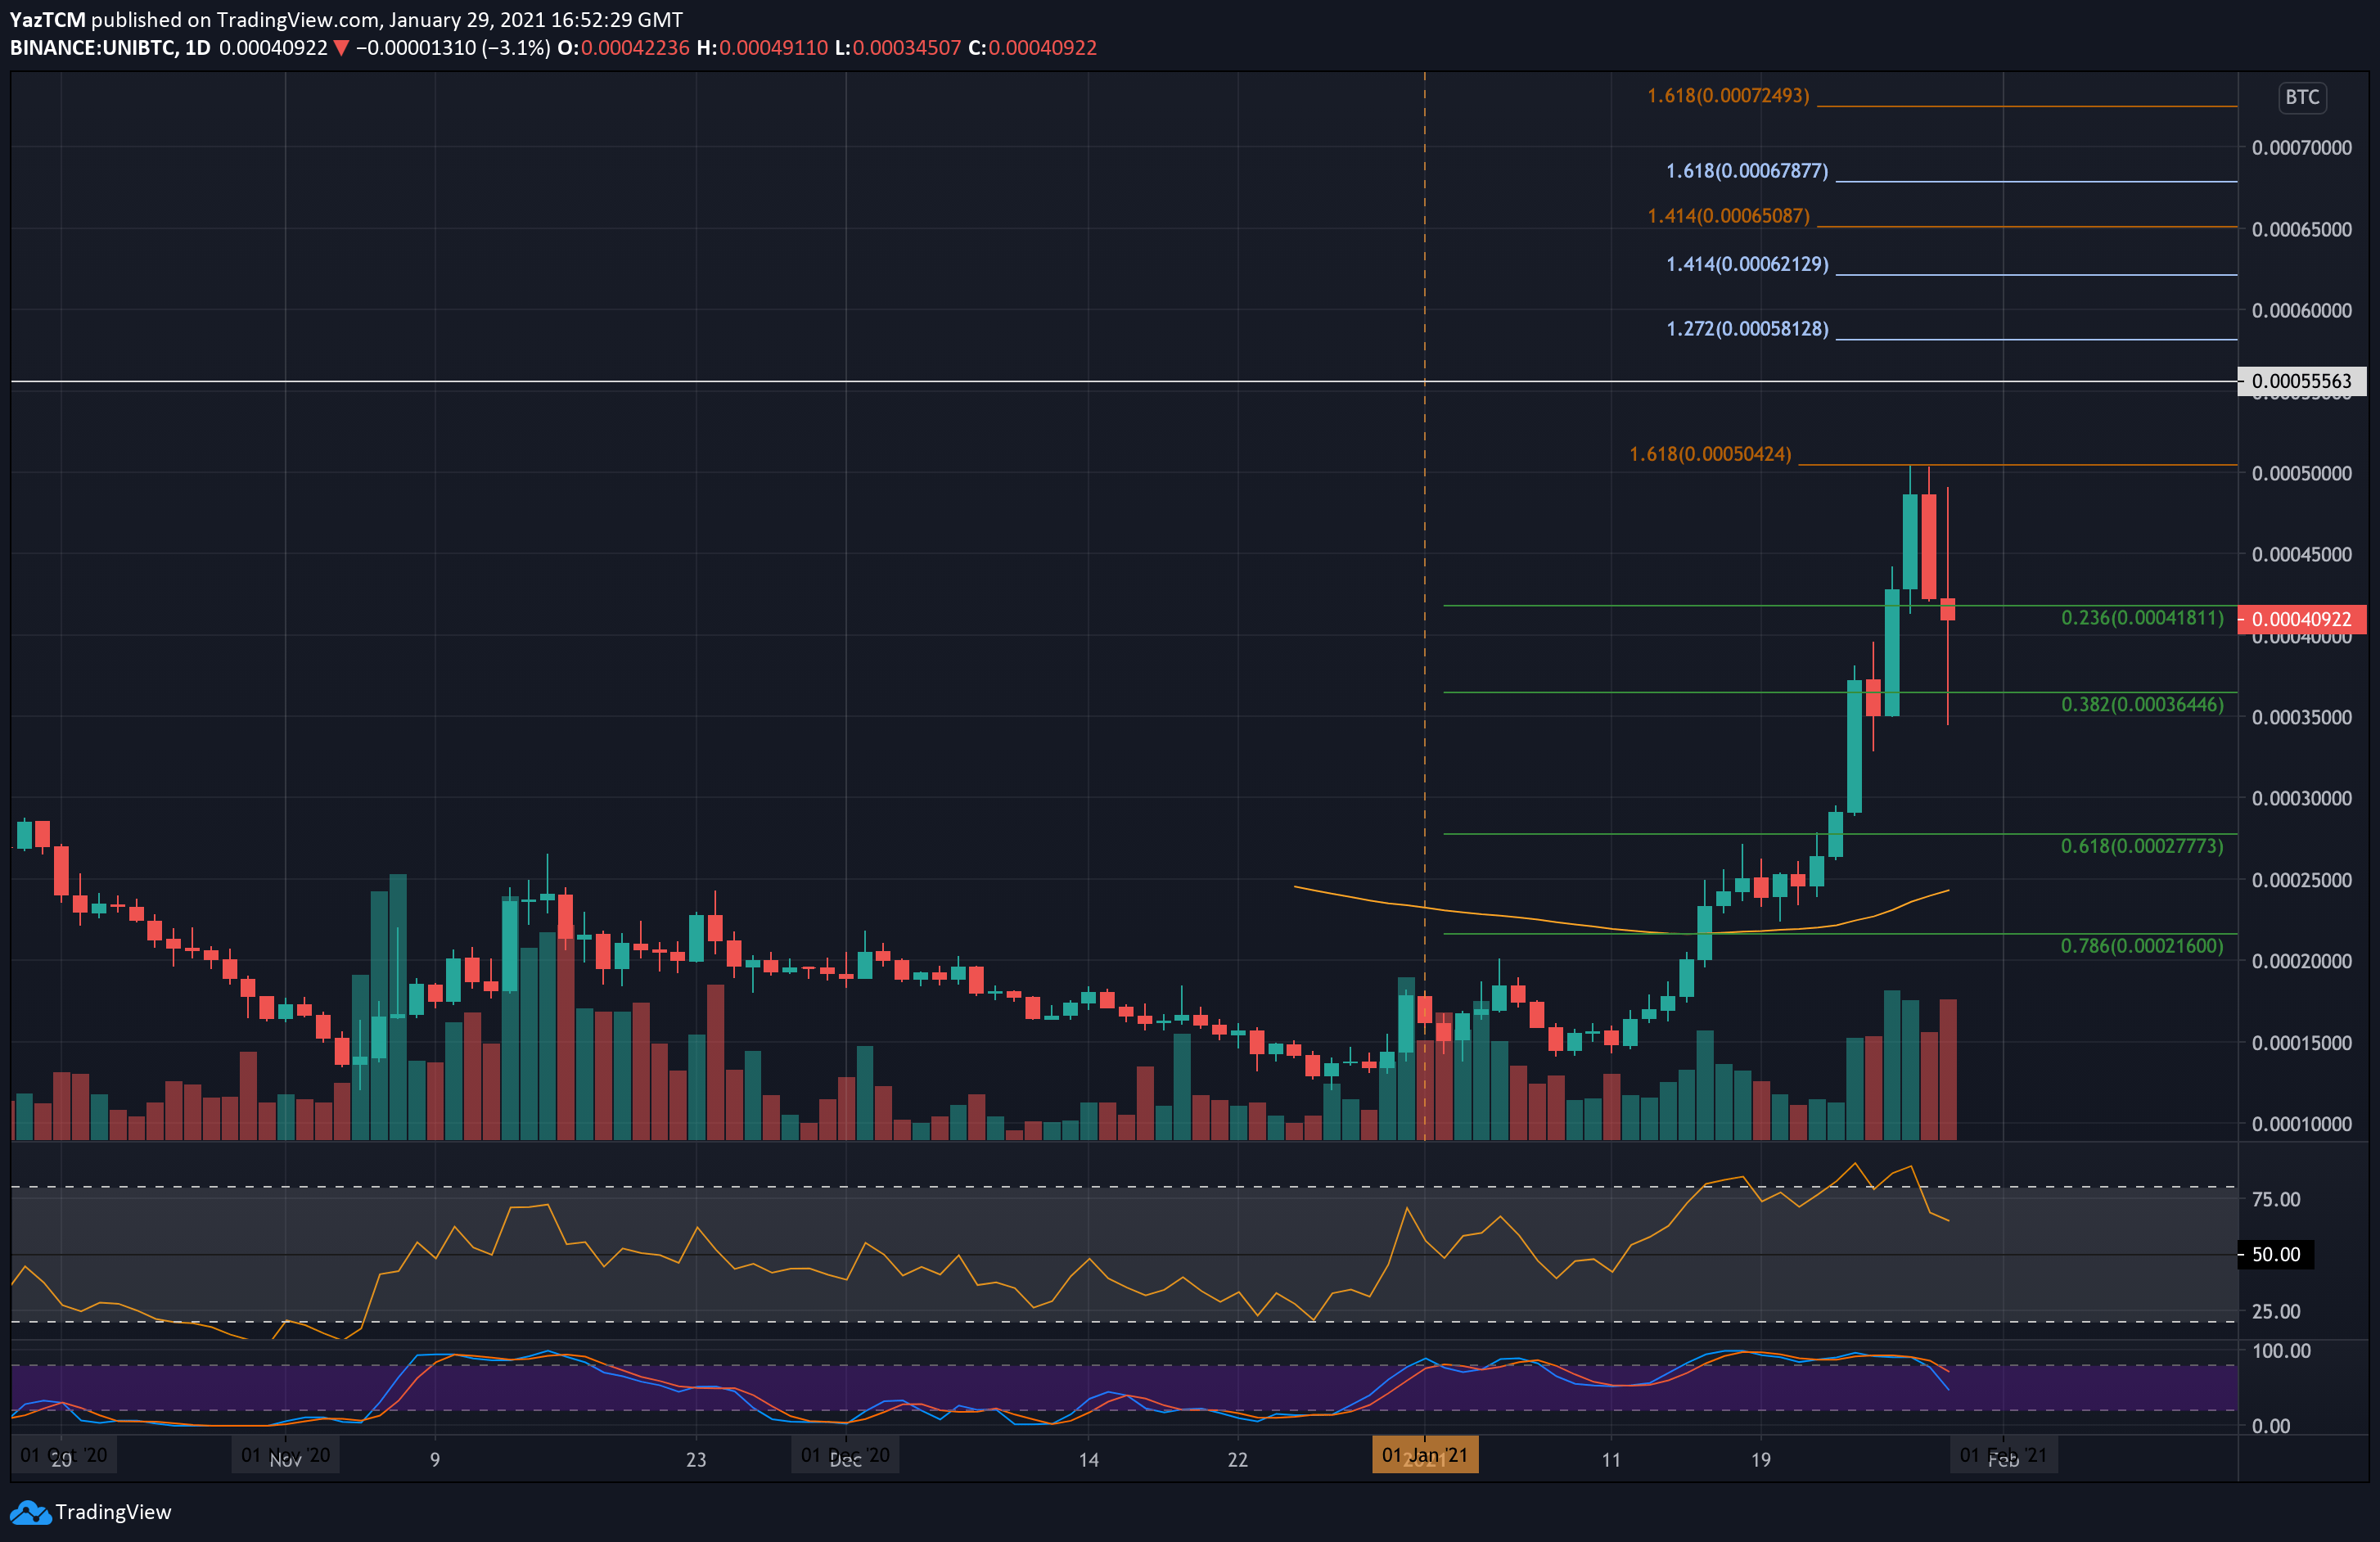
Against Bitcoin, UNI has also been surging this week. It started by breaking the 0.0003 BTC resistance level and continued to surge until resistance was met at 0.000504 BTC (1.618 Fib Extension) on Wednesday.
It has since dropped lower from there, spiking to 0.00035 BTC today before returning to the current 0.000409 BTC level.
Looking ahead, the first level of support lies at 0.0004 BTC. This is followed by 0.000364 BTC (.382 Fib), 0.00035 BTC, 0.0003 BTC, and 0.000277 BTC (.618 Fib).
Alternatievley, resistance lies at 0.00045 BTC, 0.000504 BTC (1.618 Fib Extension), 0.00055 BTC, and 0.000581 BTC (1.272 Fib Extension). Added resistance lies at 0.00062 BTC and 0.00065 BTC.
