Crypto Price Analysis Nov-26: Ethereum, Binance Coin, Solana, Avalanche, and CryptoCom
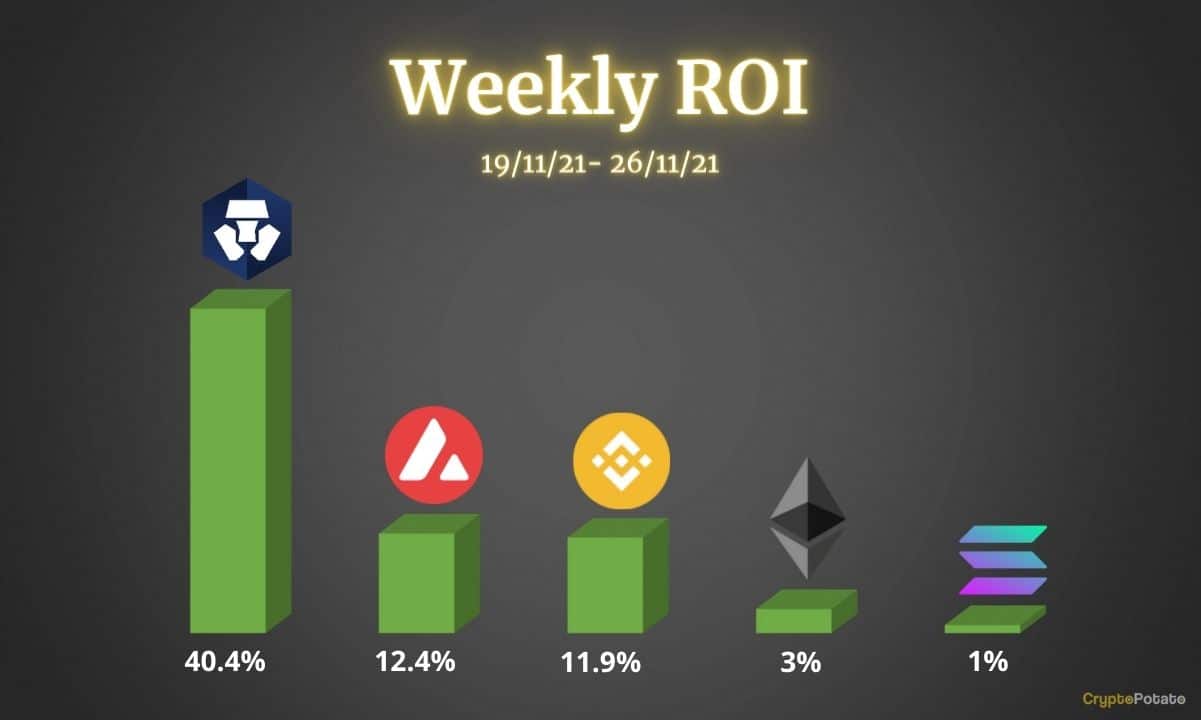
This week, the market correction continued with most cryptocurrencies suffering significant losses, particularly today when Bitcoin dropped 10% in 12 hours, and altcoins charted double-digit losses. In what follows, we take a look at Ethereum, Binance Coin, Solana, Avalanche, and CryptoCom’s CRO.
Ethereum (ETH)
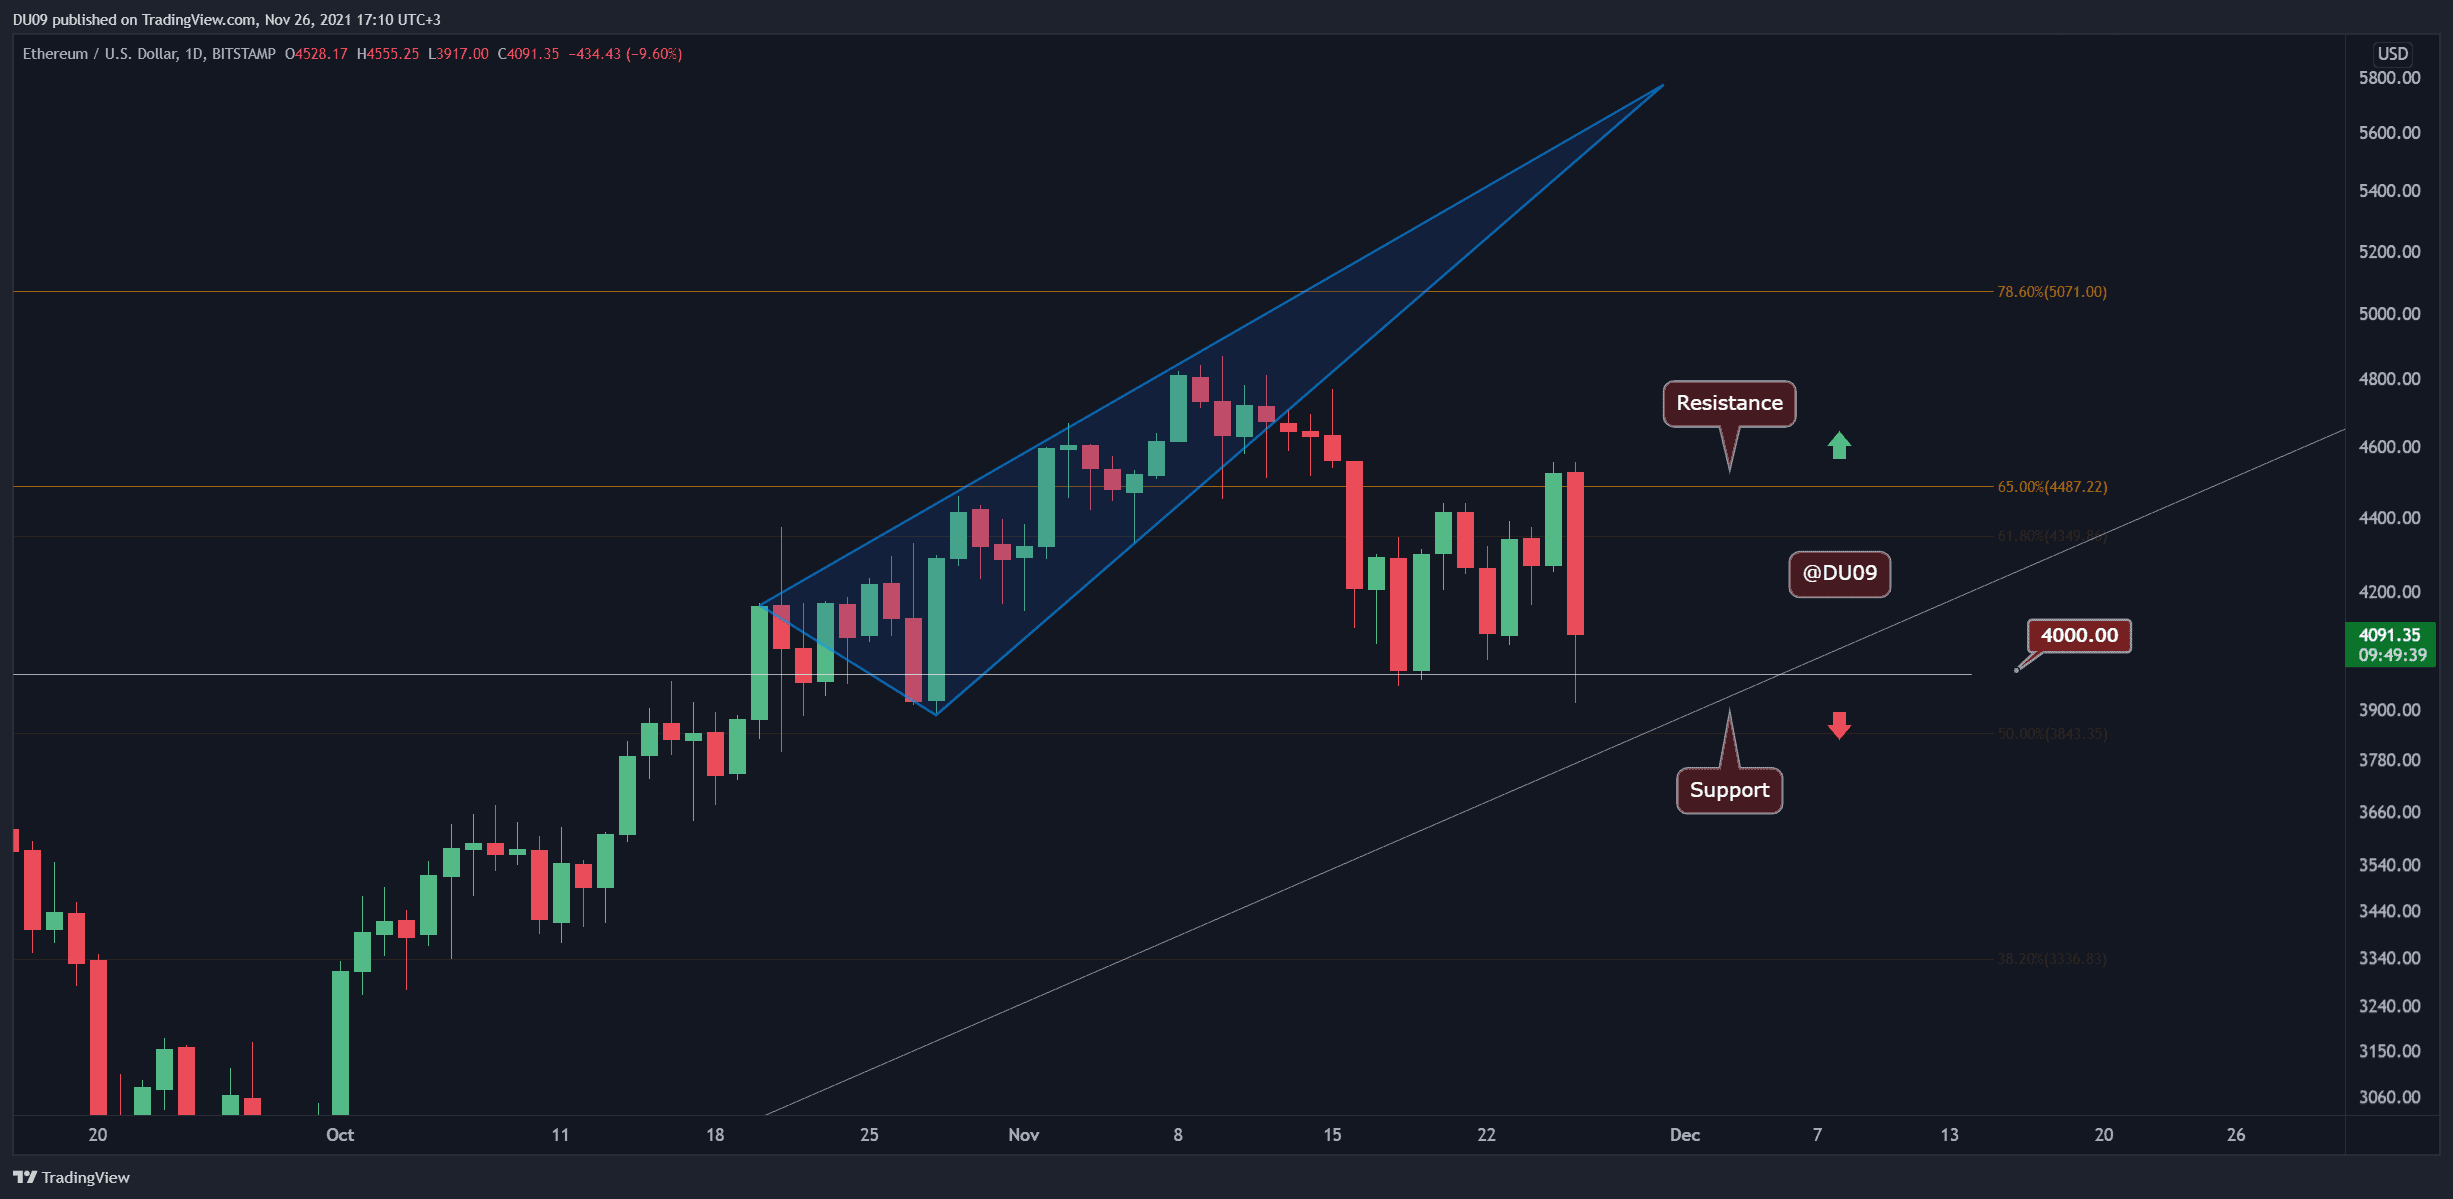
Ethereum had a nice rally this past few days and gave hope of a major breakout. However, today’s price action has re-set ETH back to $4,000 ending the past seven days in green at only 3%.
The $4000 level is also key support, and it would be surprising to see ETH close below it. Bulls are likely to defend it well and may not allow ETH to drop further outside of a wick.
The resistance sits at $4,500, and it might take a while for bulls to push the price back there as the crash from today has been significant at over 10%. Looking ahead, ETH seems likely to consolidate around the key support level before bulls gather strength for another push higher. Until then, watch out for the bears as they may attempt another try at breaking the $4,000 support.
Binance Coin (BNB)
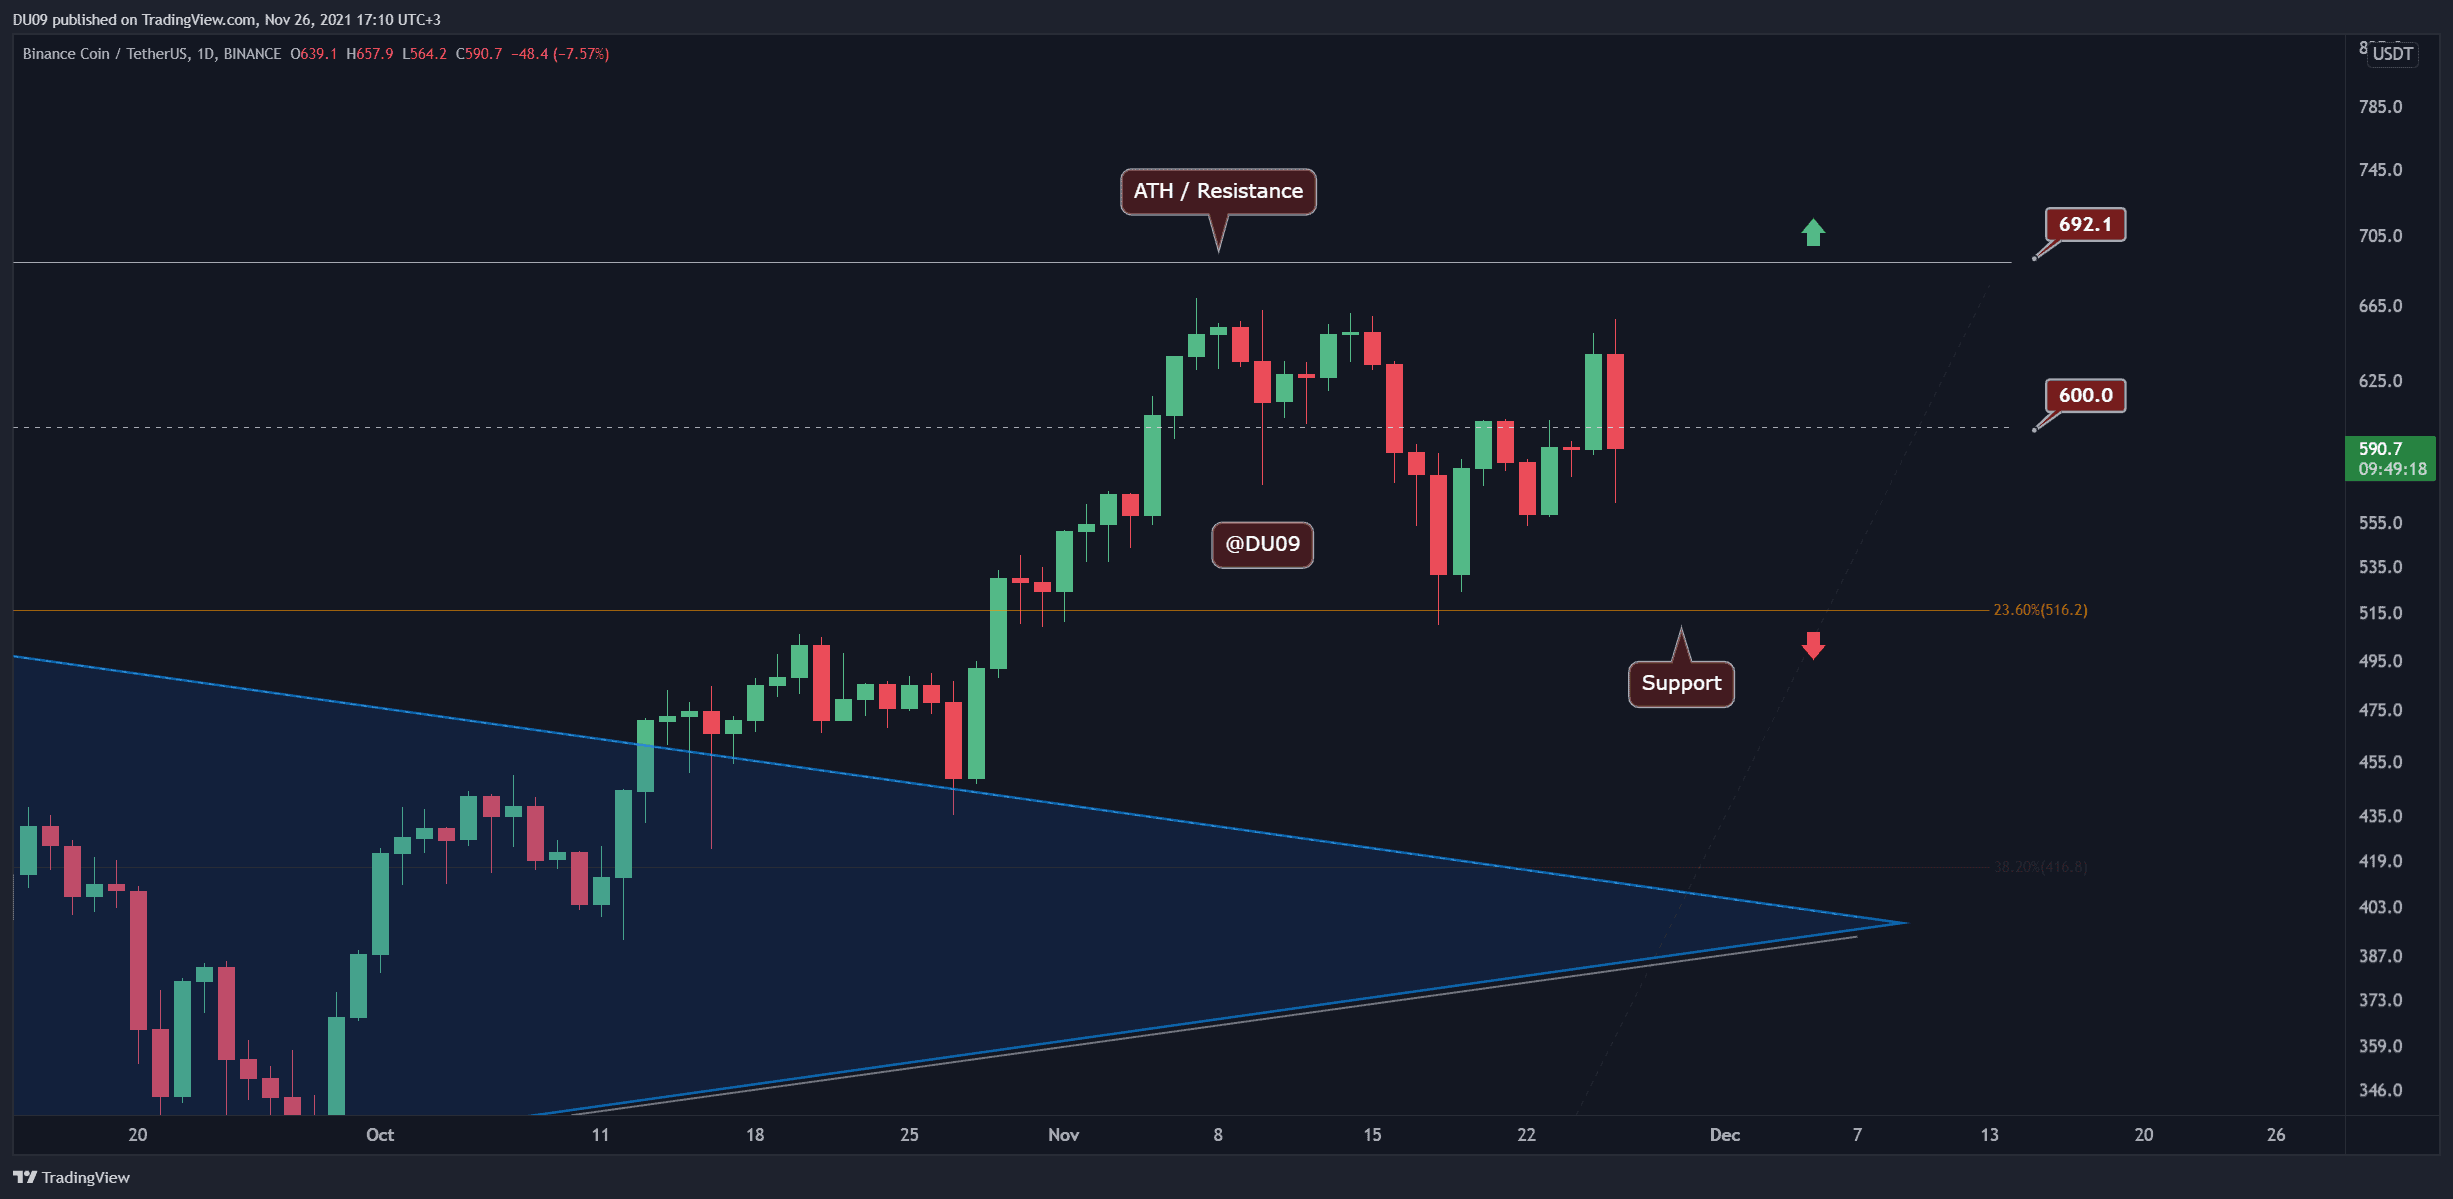
Binance Coin broke above $600 yesterday and was giving a strong bullish signal. But the positivity was short-lived as bears took control of the price today and pushed it back below this key psychological level. Still, BNB remains about 12% up on the weekly, despite today’s bloodbath.
BNB has strong support, just above $500, and despite the current drop, it has made a higher low. It is very important to see how BNB closes today’s candle because if the higher low is maintained, then this correction might have been one more dip before higher prices are reached.
Looking ahead, the indicators for BNB are trying to curve back up on the daily timeframe, and today’s correction has delayed a possible bullish cross. The bias remains somewhat bullish for BNB as long as it holds above the key support at $516.
Solana (SOL)
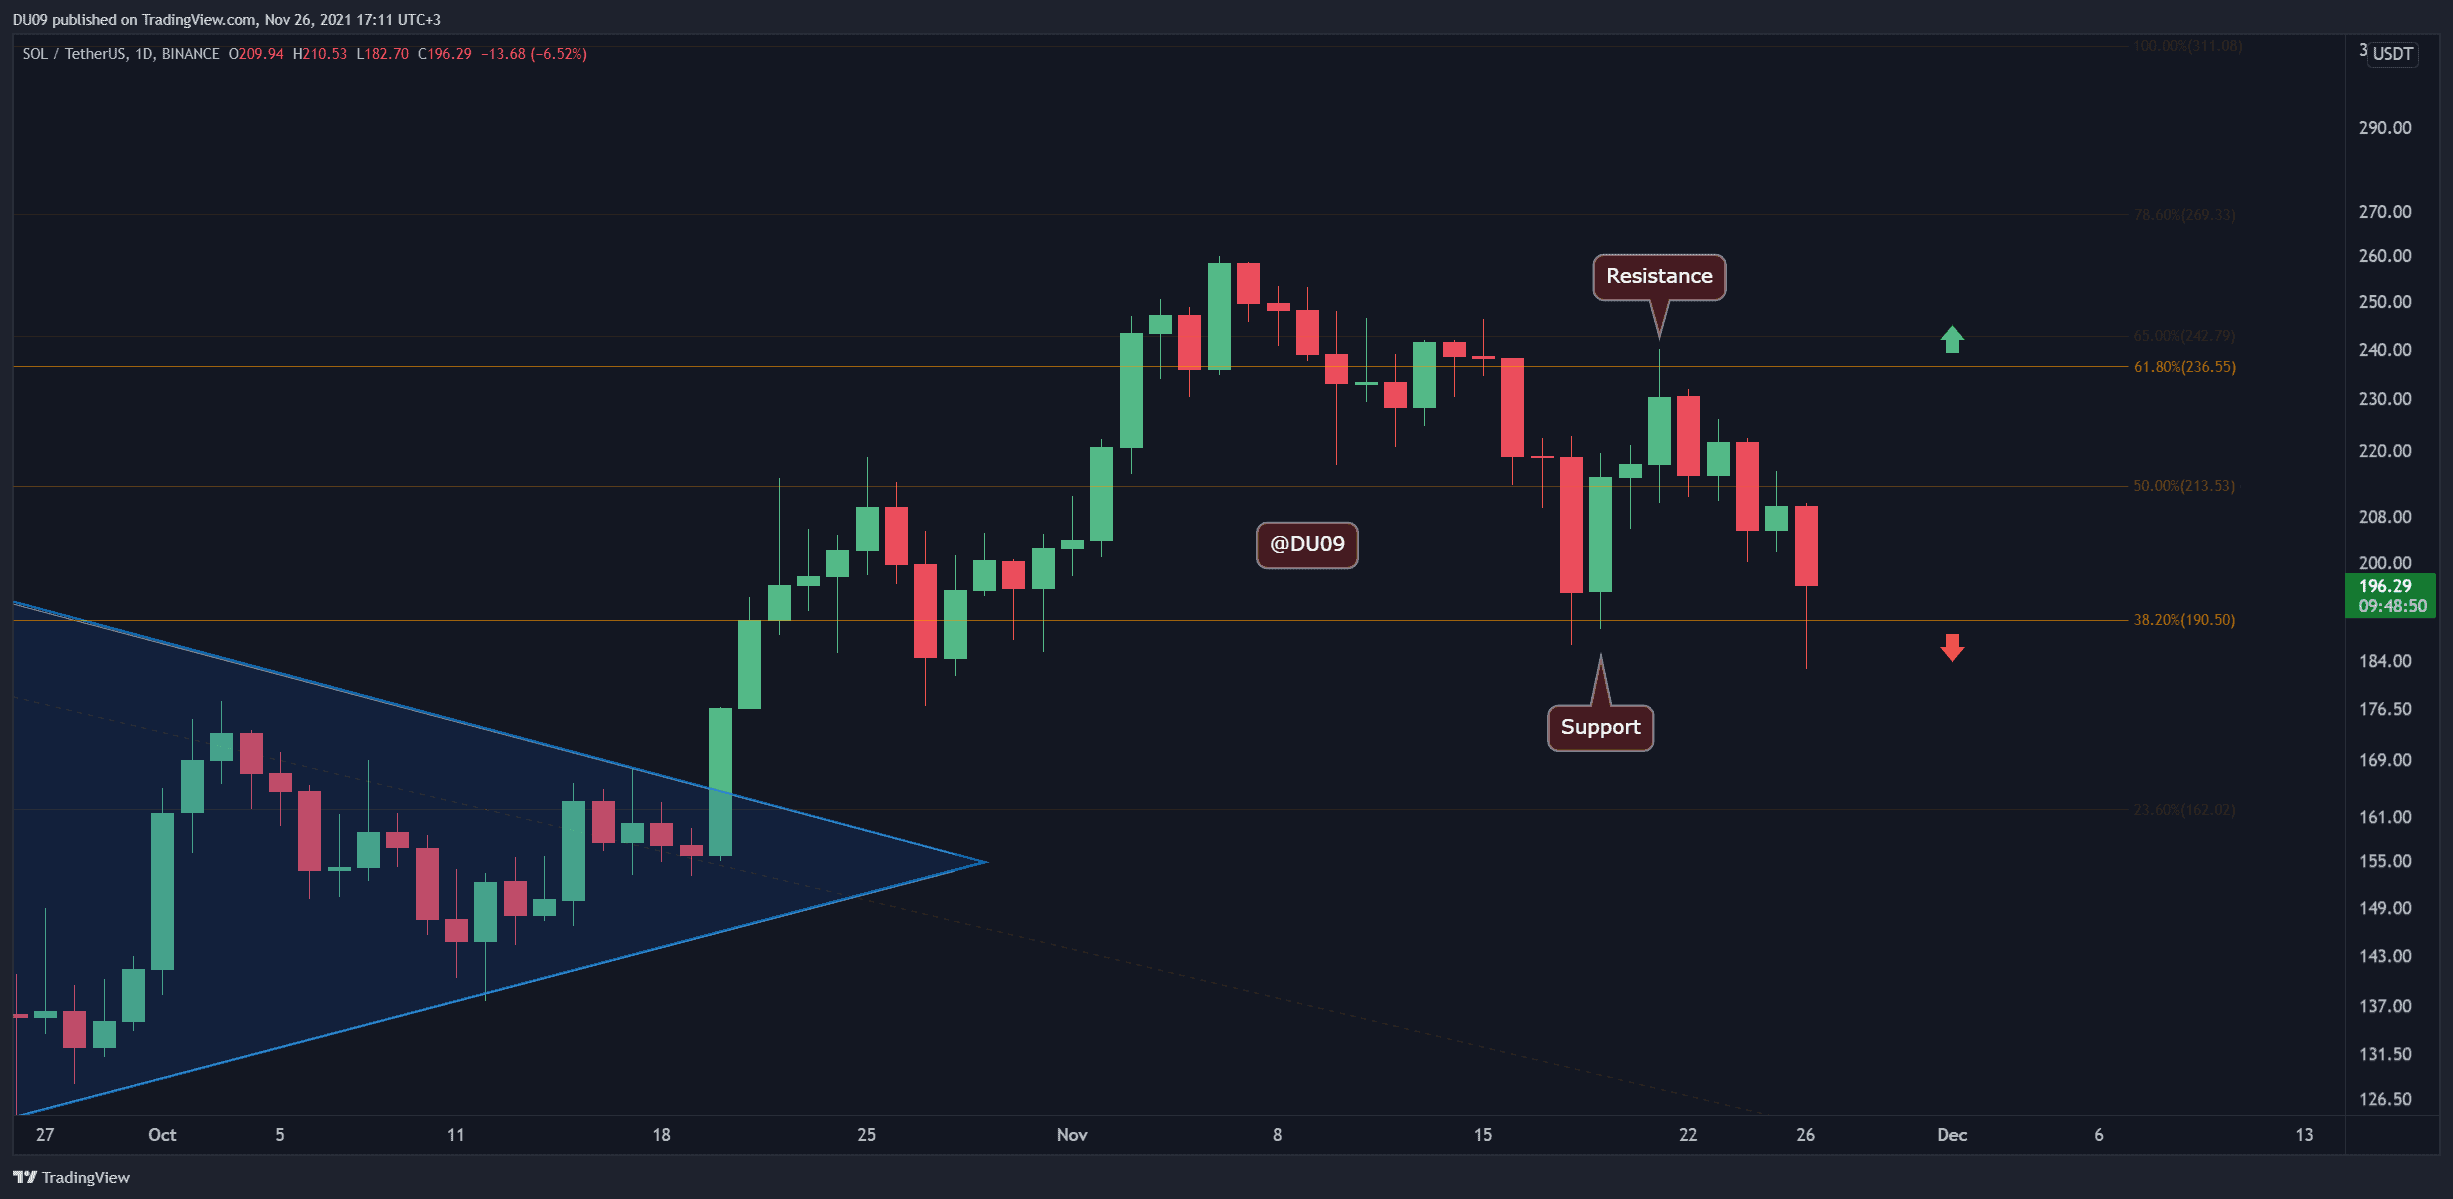
Solana had a strong rally this past week but was rejected by the resistance at $236. Due to today’s market dropdown, SOL was pushed back on the key support level at $190.
SOL was already giving a bearish signal due to the indicators, with a daily MACD that completed a bearish cross on November 11th. Whenever this happens, it is always best to be cautious and not FOMO in. SOL has continued to make lower highs and lower lows. Today’s daily candle has wicked all the way down to $182, which is the lowest level since late October.
Looking ahead, Solana appears to be in a longer correction that might take longer to play out, and today’s price action only reinforces this bias. While the support at $190 has held today, this is not a guarantee that it can hold another attempt at breaking it. The indicators such as MACD and RSI remain bearish, and it is best to remain careful.
Avalanche (AVAX)
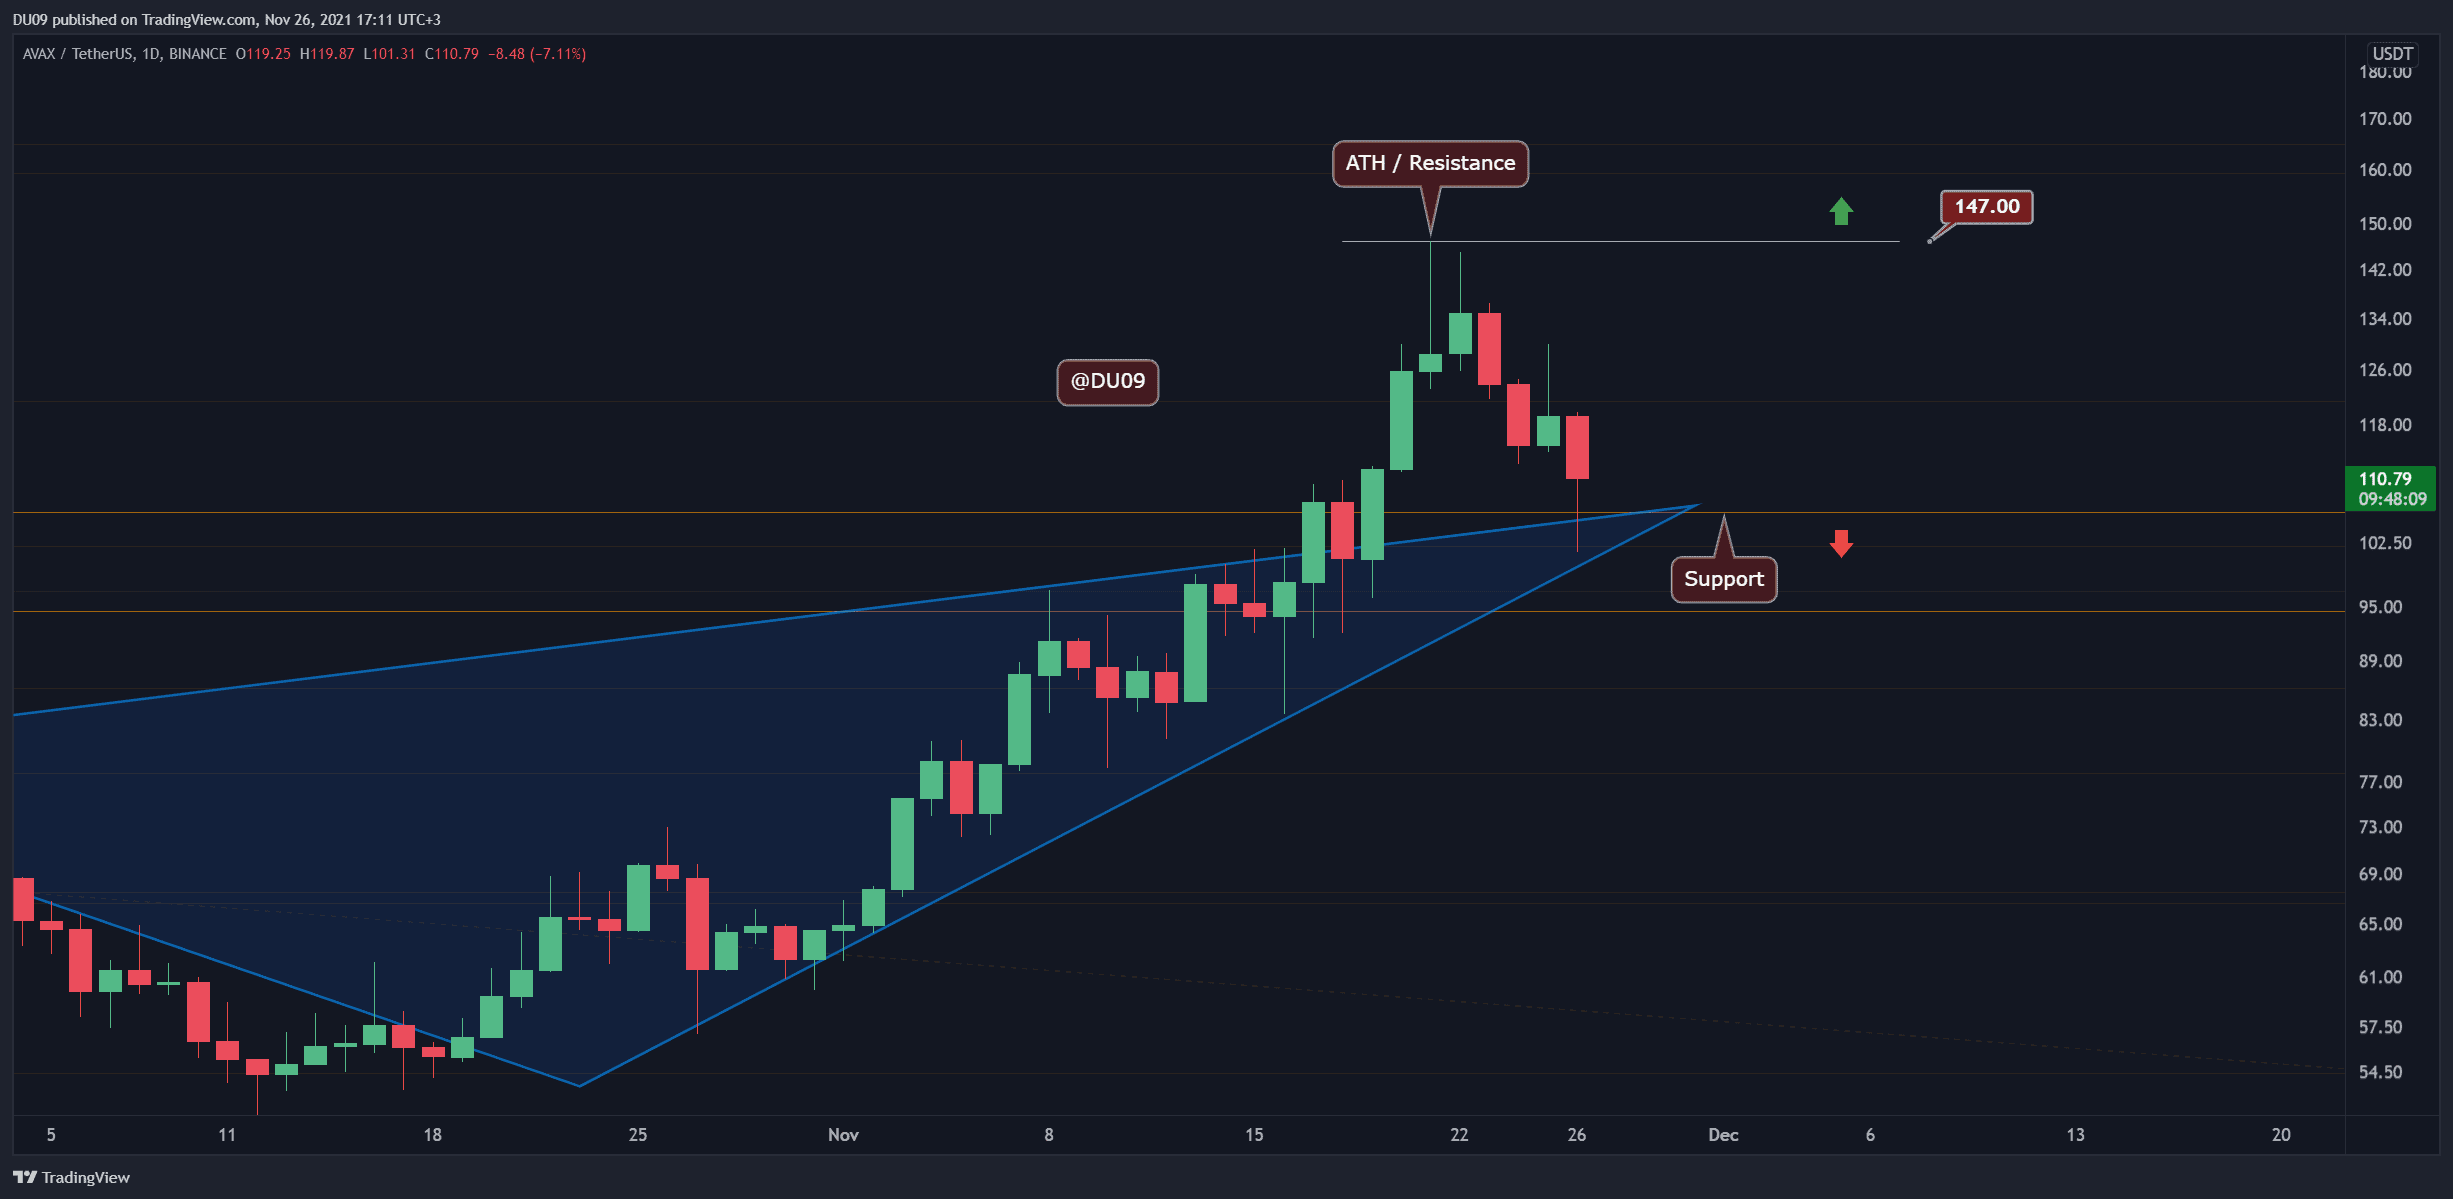
Avalanche surprised everyone this past week with a significant rally that topped at a new all-time high at $147. However, ever since then, AVAX has corrected, and today’s candle took price all the way back to $100.
Moreover, AVAX, much like Solana, also completed a bearish cross on the daily MACD today. If it closes the day like this, then this is a major warning sign that lower price levels could be reached in the future. In the best-case scenario, AVAX’s price should contain the correction just above $100. Then bulls can then recover from this assault and attempt a recovery.
In general, it is important to remain very careful as the market is currently in a state of instability, and a lot of volatility might come into play. Therefore, vigilance is of utmost importance.
CryptoCom (CRO)
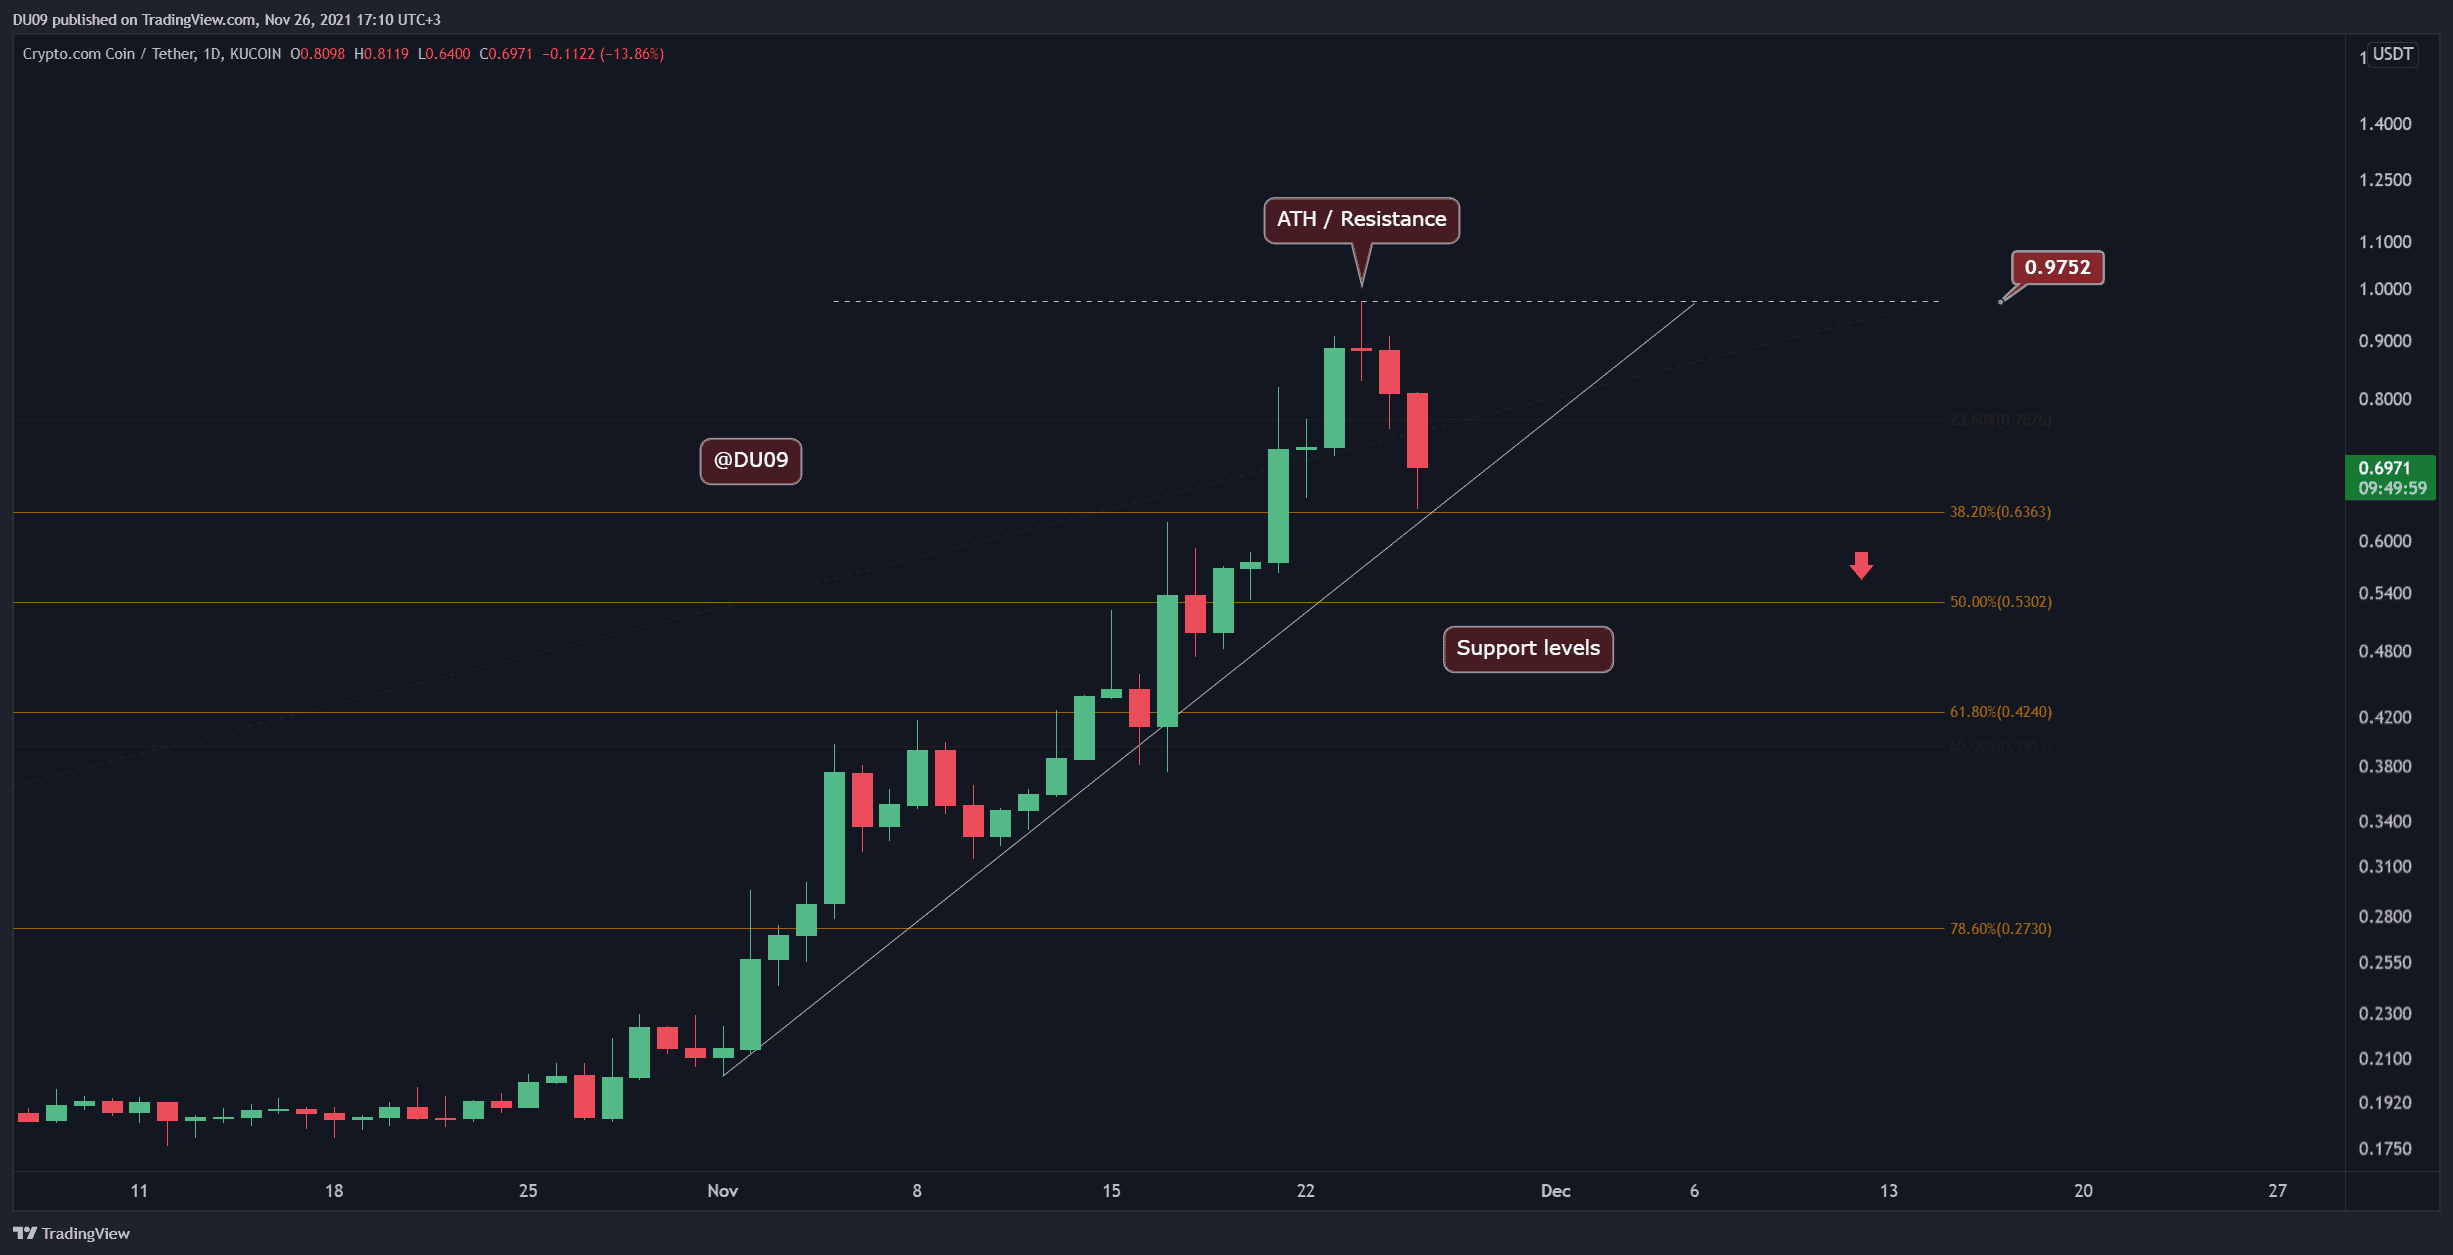
CryptoCom Coin had a fantastic rally in October and the first half of November. Now, the price appears to have finally hit a major resistance, which is not surprisingly found at just under $1 dollar. Such key psychological levels will always represent turning points in the price action, and CRO is no different. Despite the ongoing correction, CRO’s performance this week was stellar, with a 40% price increase.
The current support is found at $0.63. However, considering the past rally, CRO might not only correct to the Fibonacci 38% retracement, and it might dip even further.
Looking ahead, CRO’s indicators on the daily timeframe have curved back down after the major rally in the past couple of weeks. This is a clear warning sign, and if CRO breaks below $0.63 support, then things could get even uglier.
