Crypto Price Analysis Mar-31: ETH, XRP, ADA, SOL, LTC
This week, we take a closer look at Ethereum, Ripple, Cardano, Solana, and Litecoin.
Ethereum (ETH)
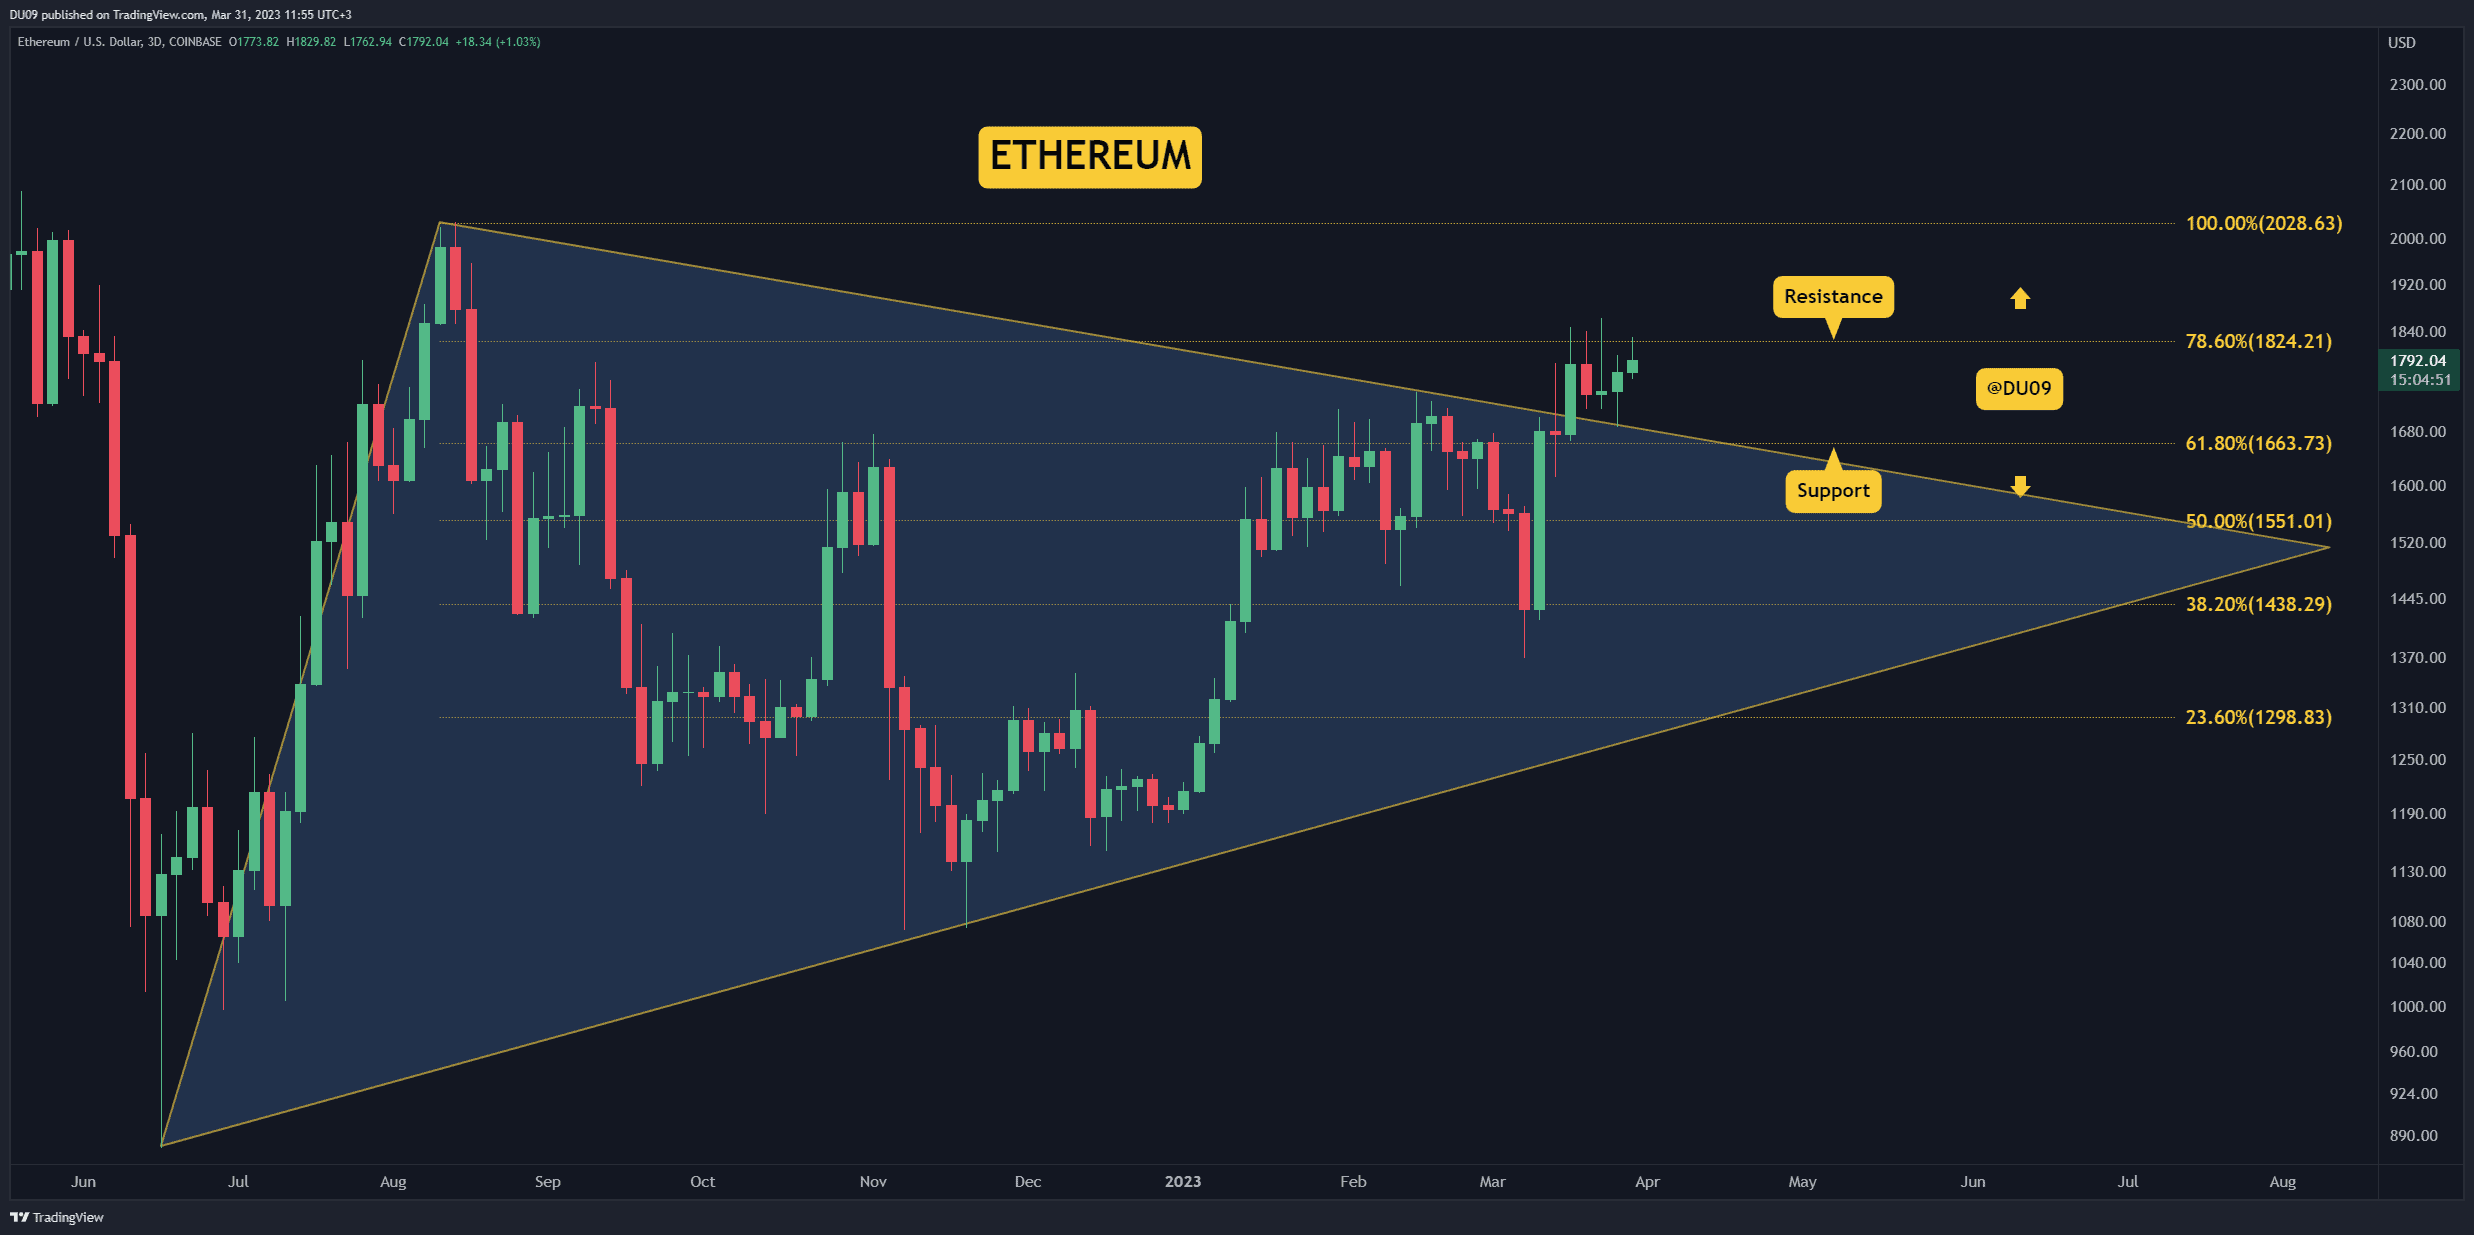
Ethereum decided to range this week and booked a slight loss of 1.4%. This flat trend could not muster the energy to hold the price above $1,800, which is the current key resistance.
The support is at $1,700, and bulls have done a good job defending this level to date. Therefore, any pullback should find buyers here if the price falls again.
Looking ahead, ETH has lost some of its momentum, with the buying volume steadily decreasing since mid-March. If this does not reverse soon, then the cryptocurrency will lack the strength to push higher at this time and may even enter a correction.
Ripple (XRP)
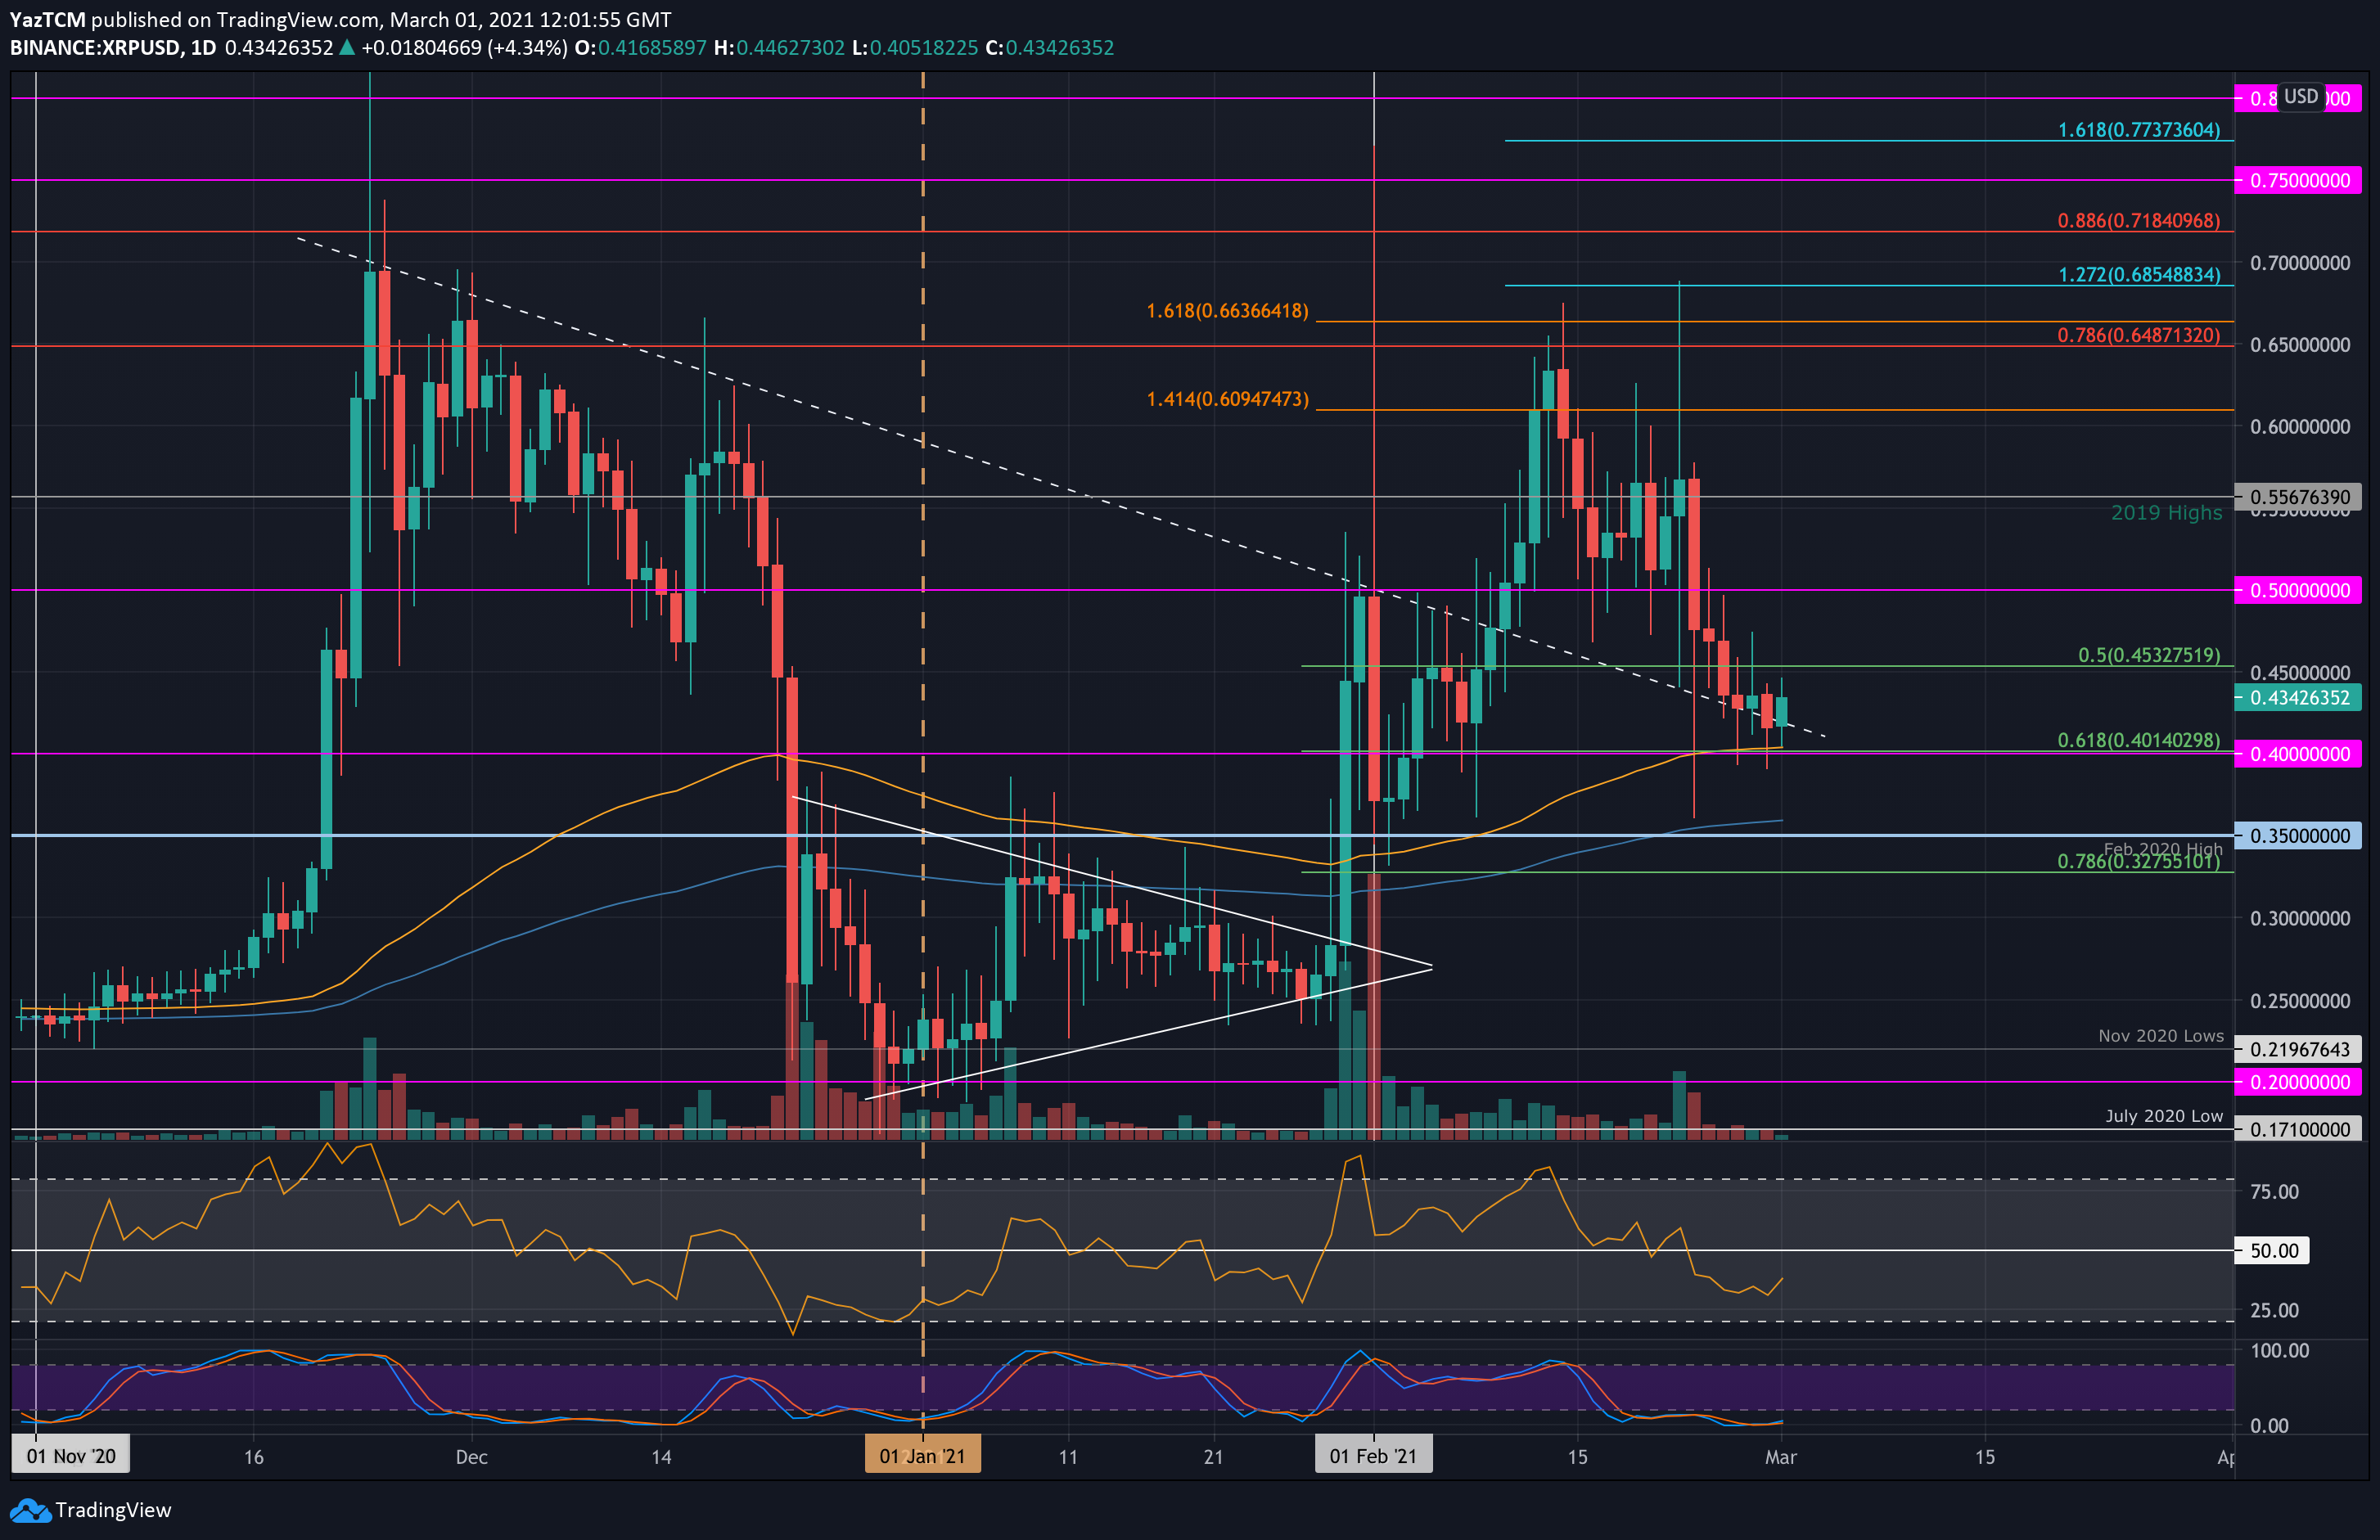
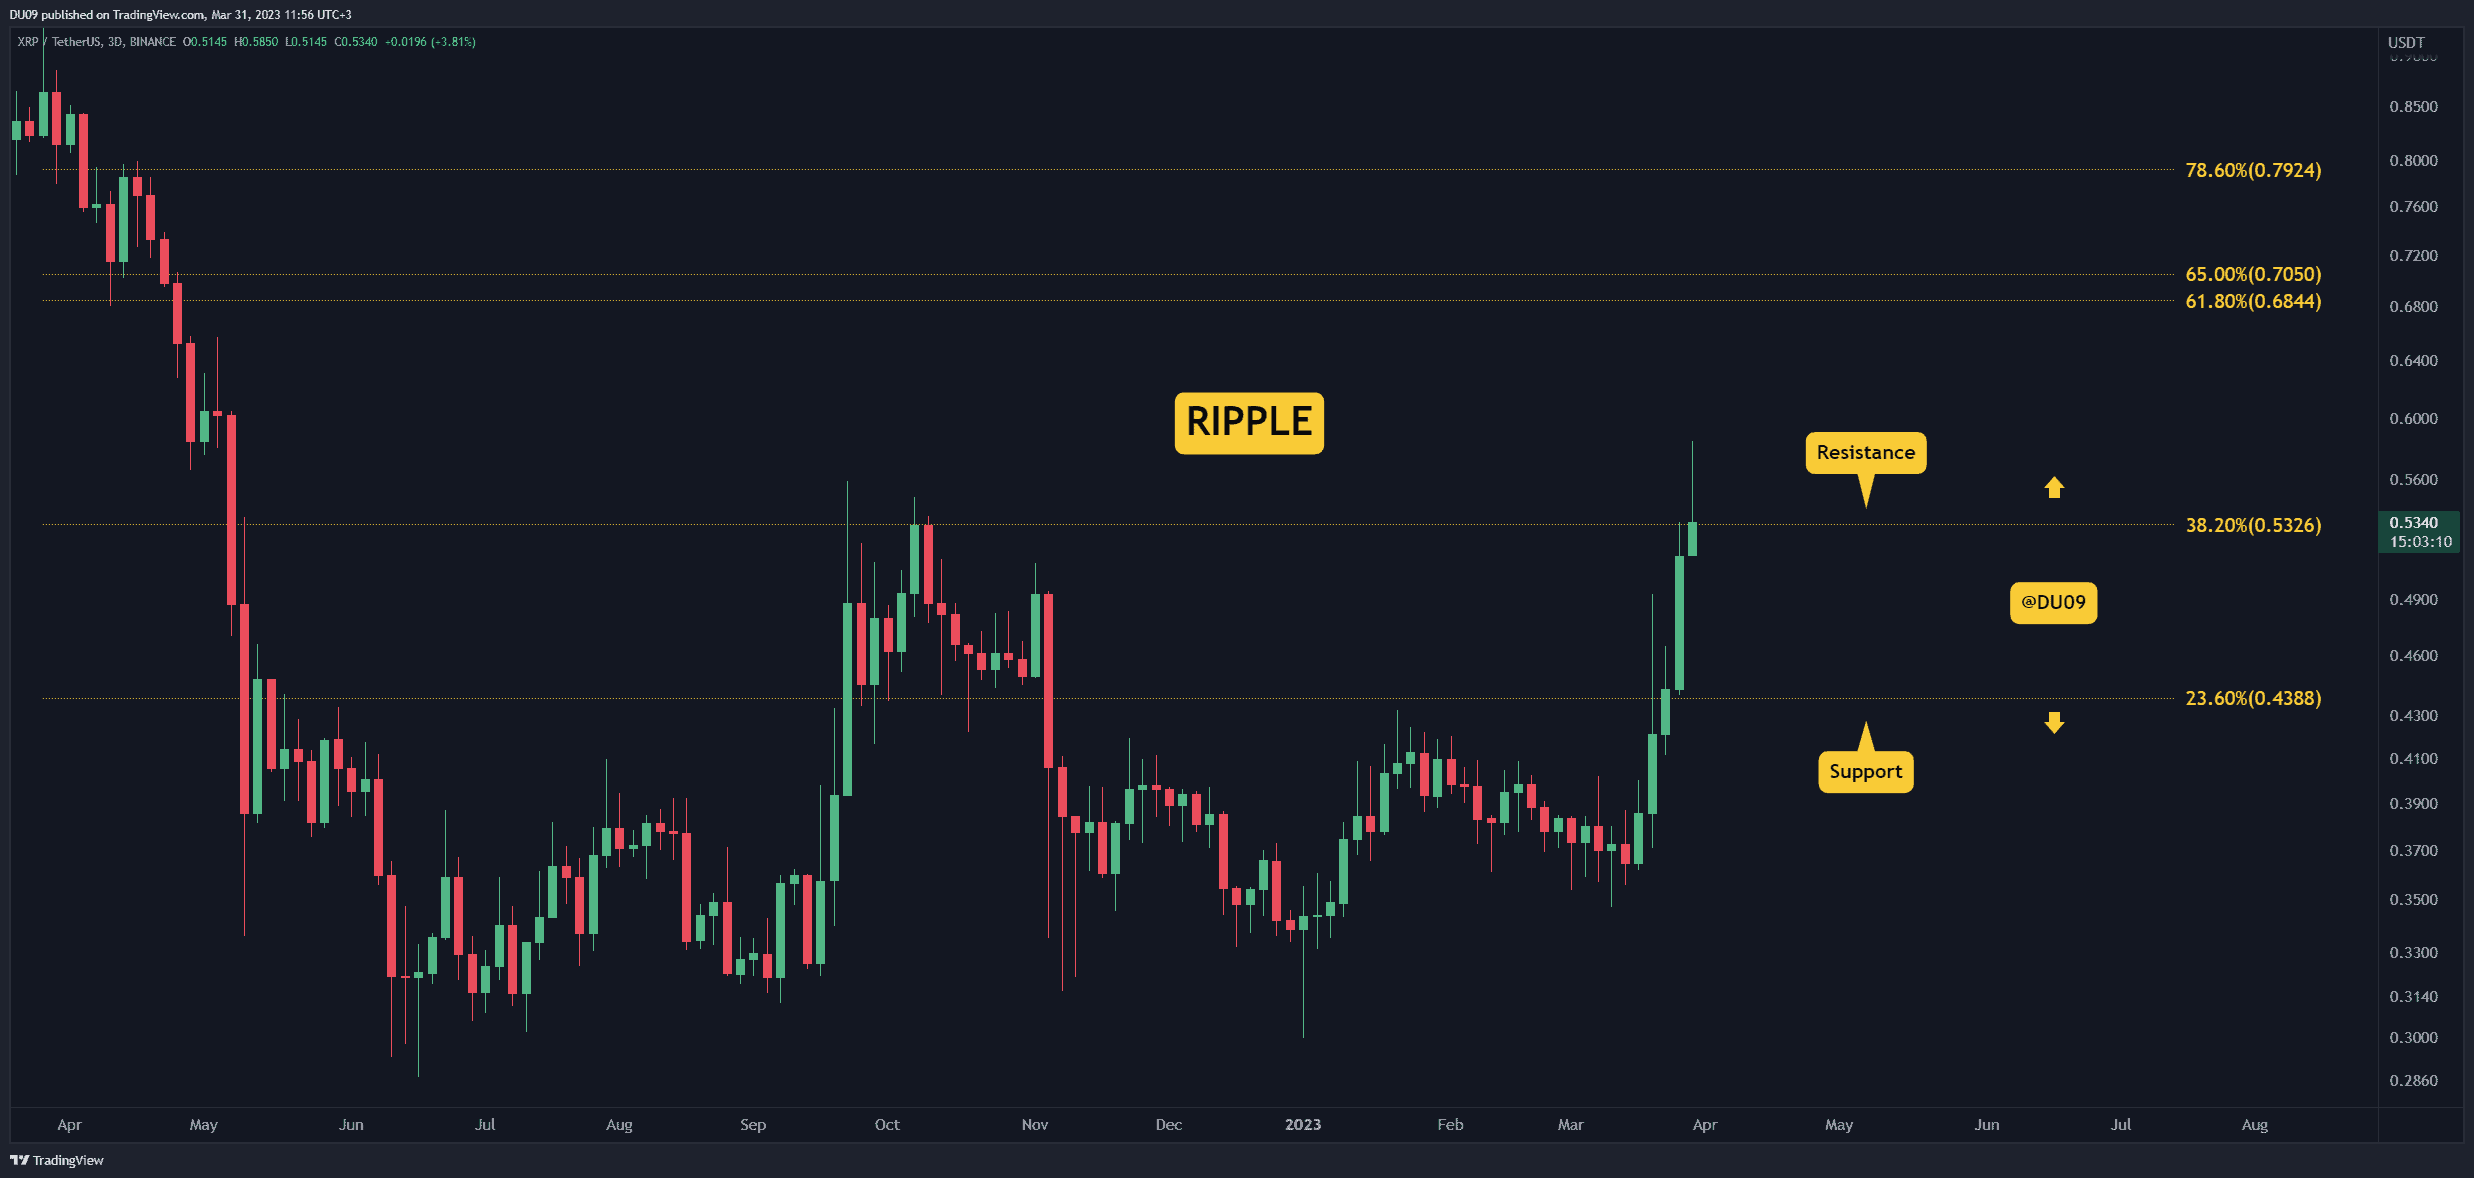
If Ethereum is still deciding where to go next, this is not an issue for XRP, which has turned extremely bullish. With a 19% price increase in the past week, XRP is the best performer on our list. Moreover, buyers do not show any sign of weakness at this time.
During this rally, Ripple made a higher high which confirms the bullish trend. To stop this ascent, bears may show up at the key resistance levels of 53 and 58 cents. The current support is just below 50 cents.
Looking ahead, XRP is well positioned to make new yearly highs and maybe even approach $1 towards the end of the year. Considering its price history, this looks likely if buyers continue to dominate.
Cardano (ADA)
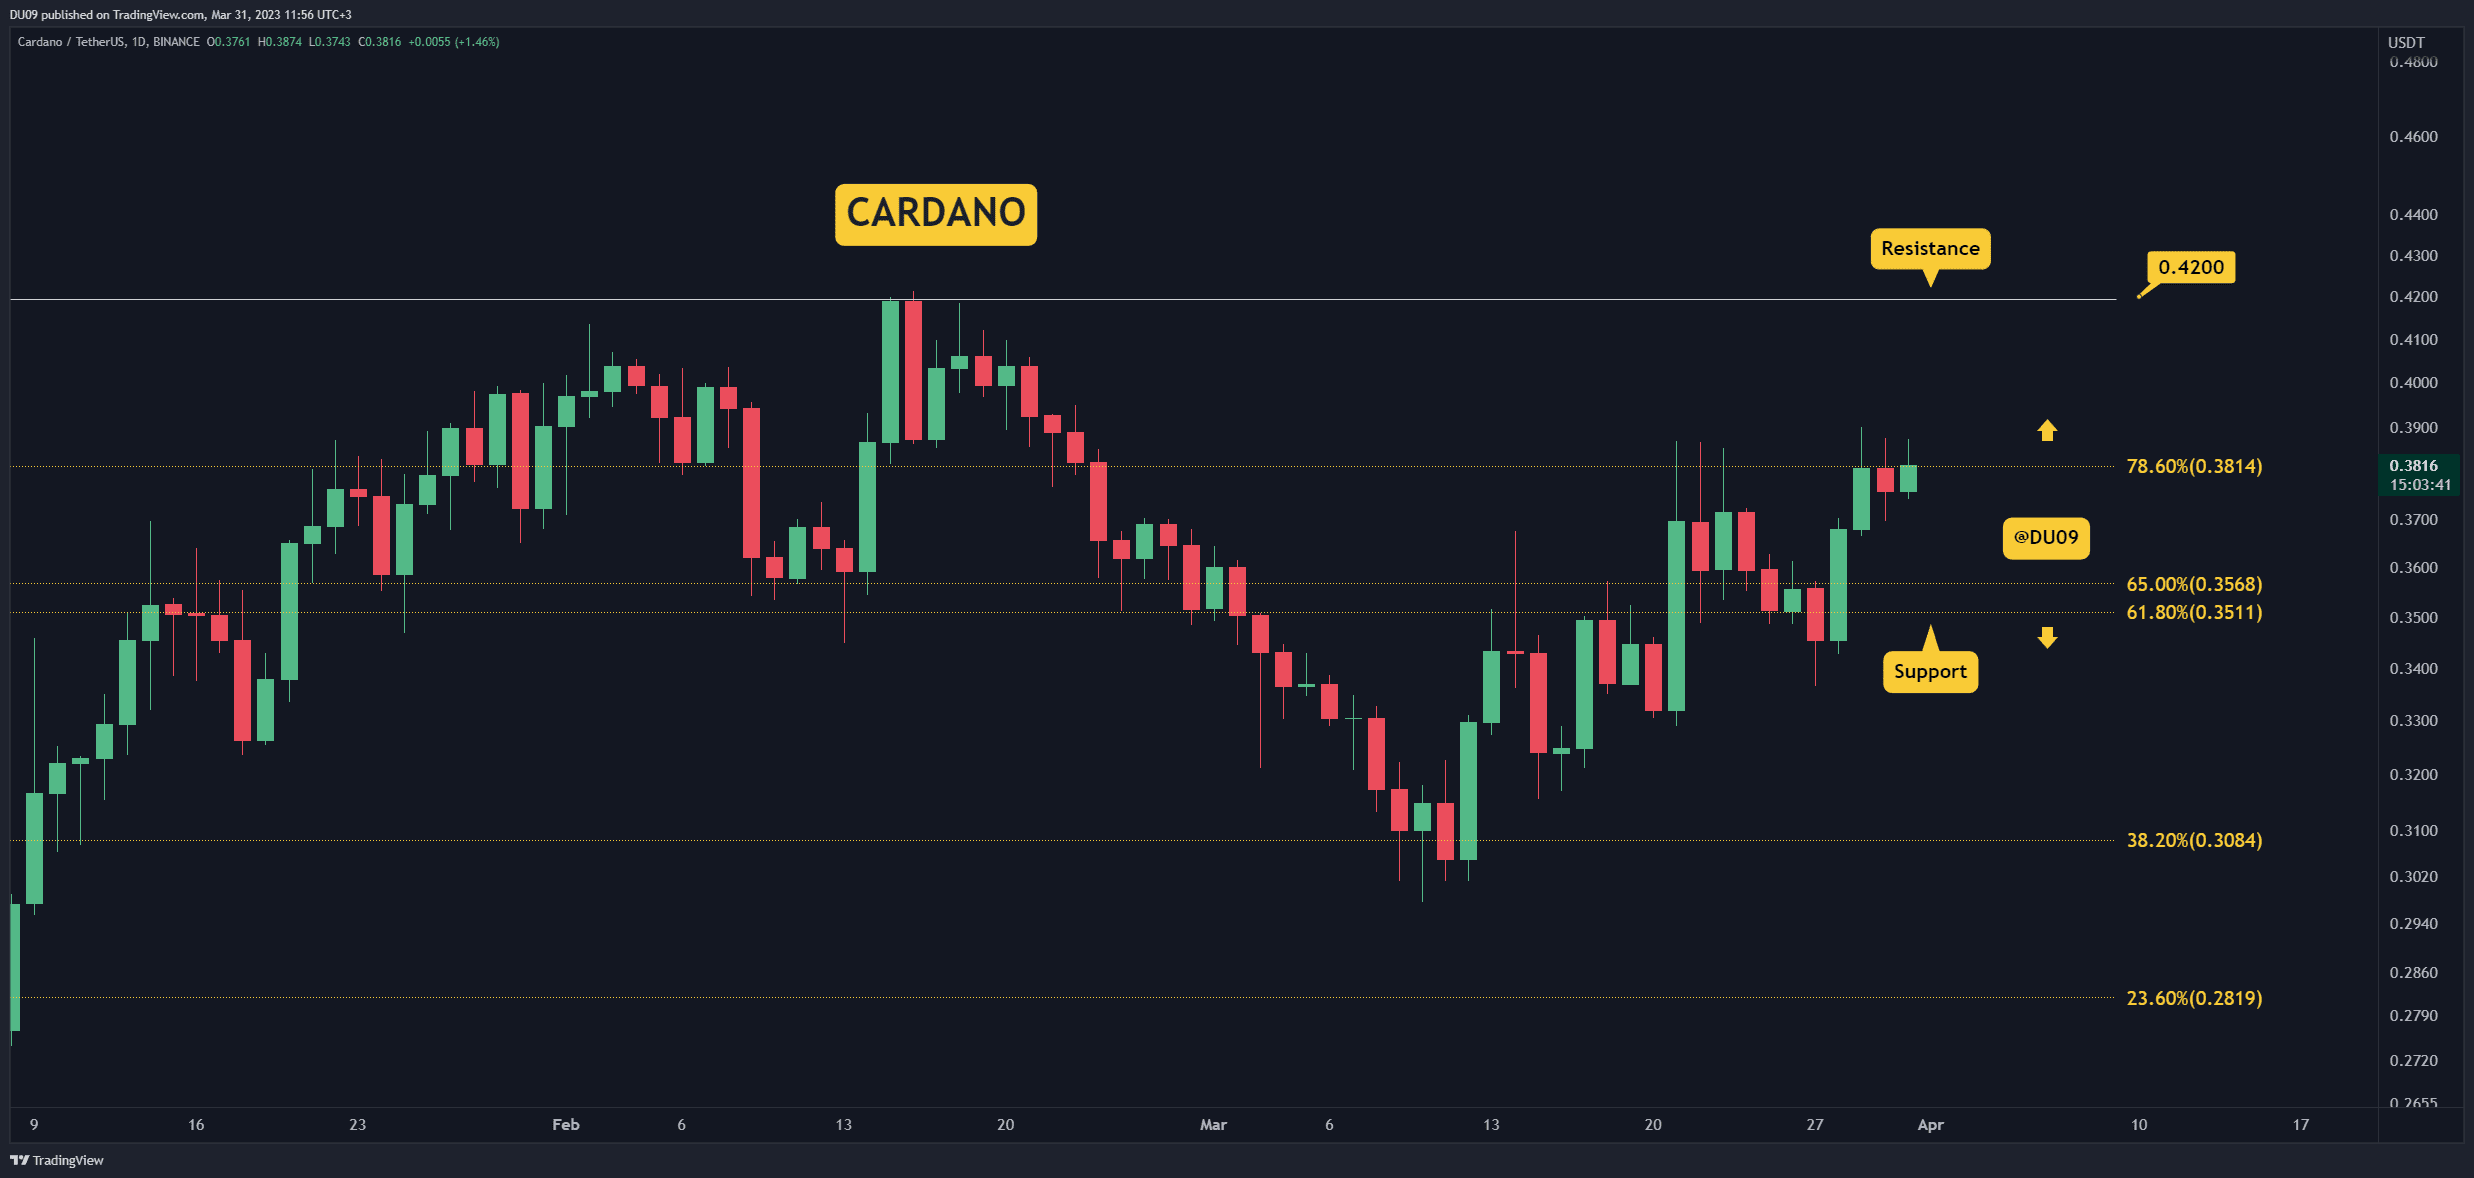
Cardano’s uptrend continued this past week, and the price managed to increase by 3.9%. The reason ADA failed to rally higher is because of the key resistance at 38 cents. Every time buyers wanted to break away, sellers turned the price around.
The key support is at 35 cents, and it is unlikely to be retested considering this price action. In the past, pullbacks were short-lived and provided a good entry.
Looking ahead, it is unlikely for sellers to hold off the pressure from buyers who are keen to take ADA higher. If the 38 cents level is turned into support, then this cryptocurrency can aim for 42 cents next.
Solana (SOL)
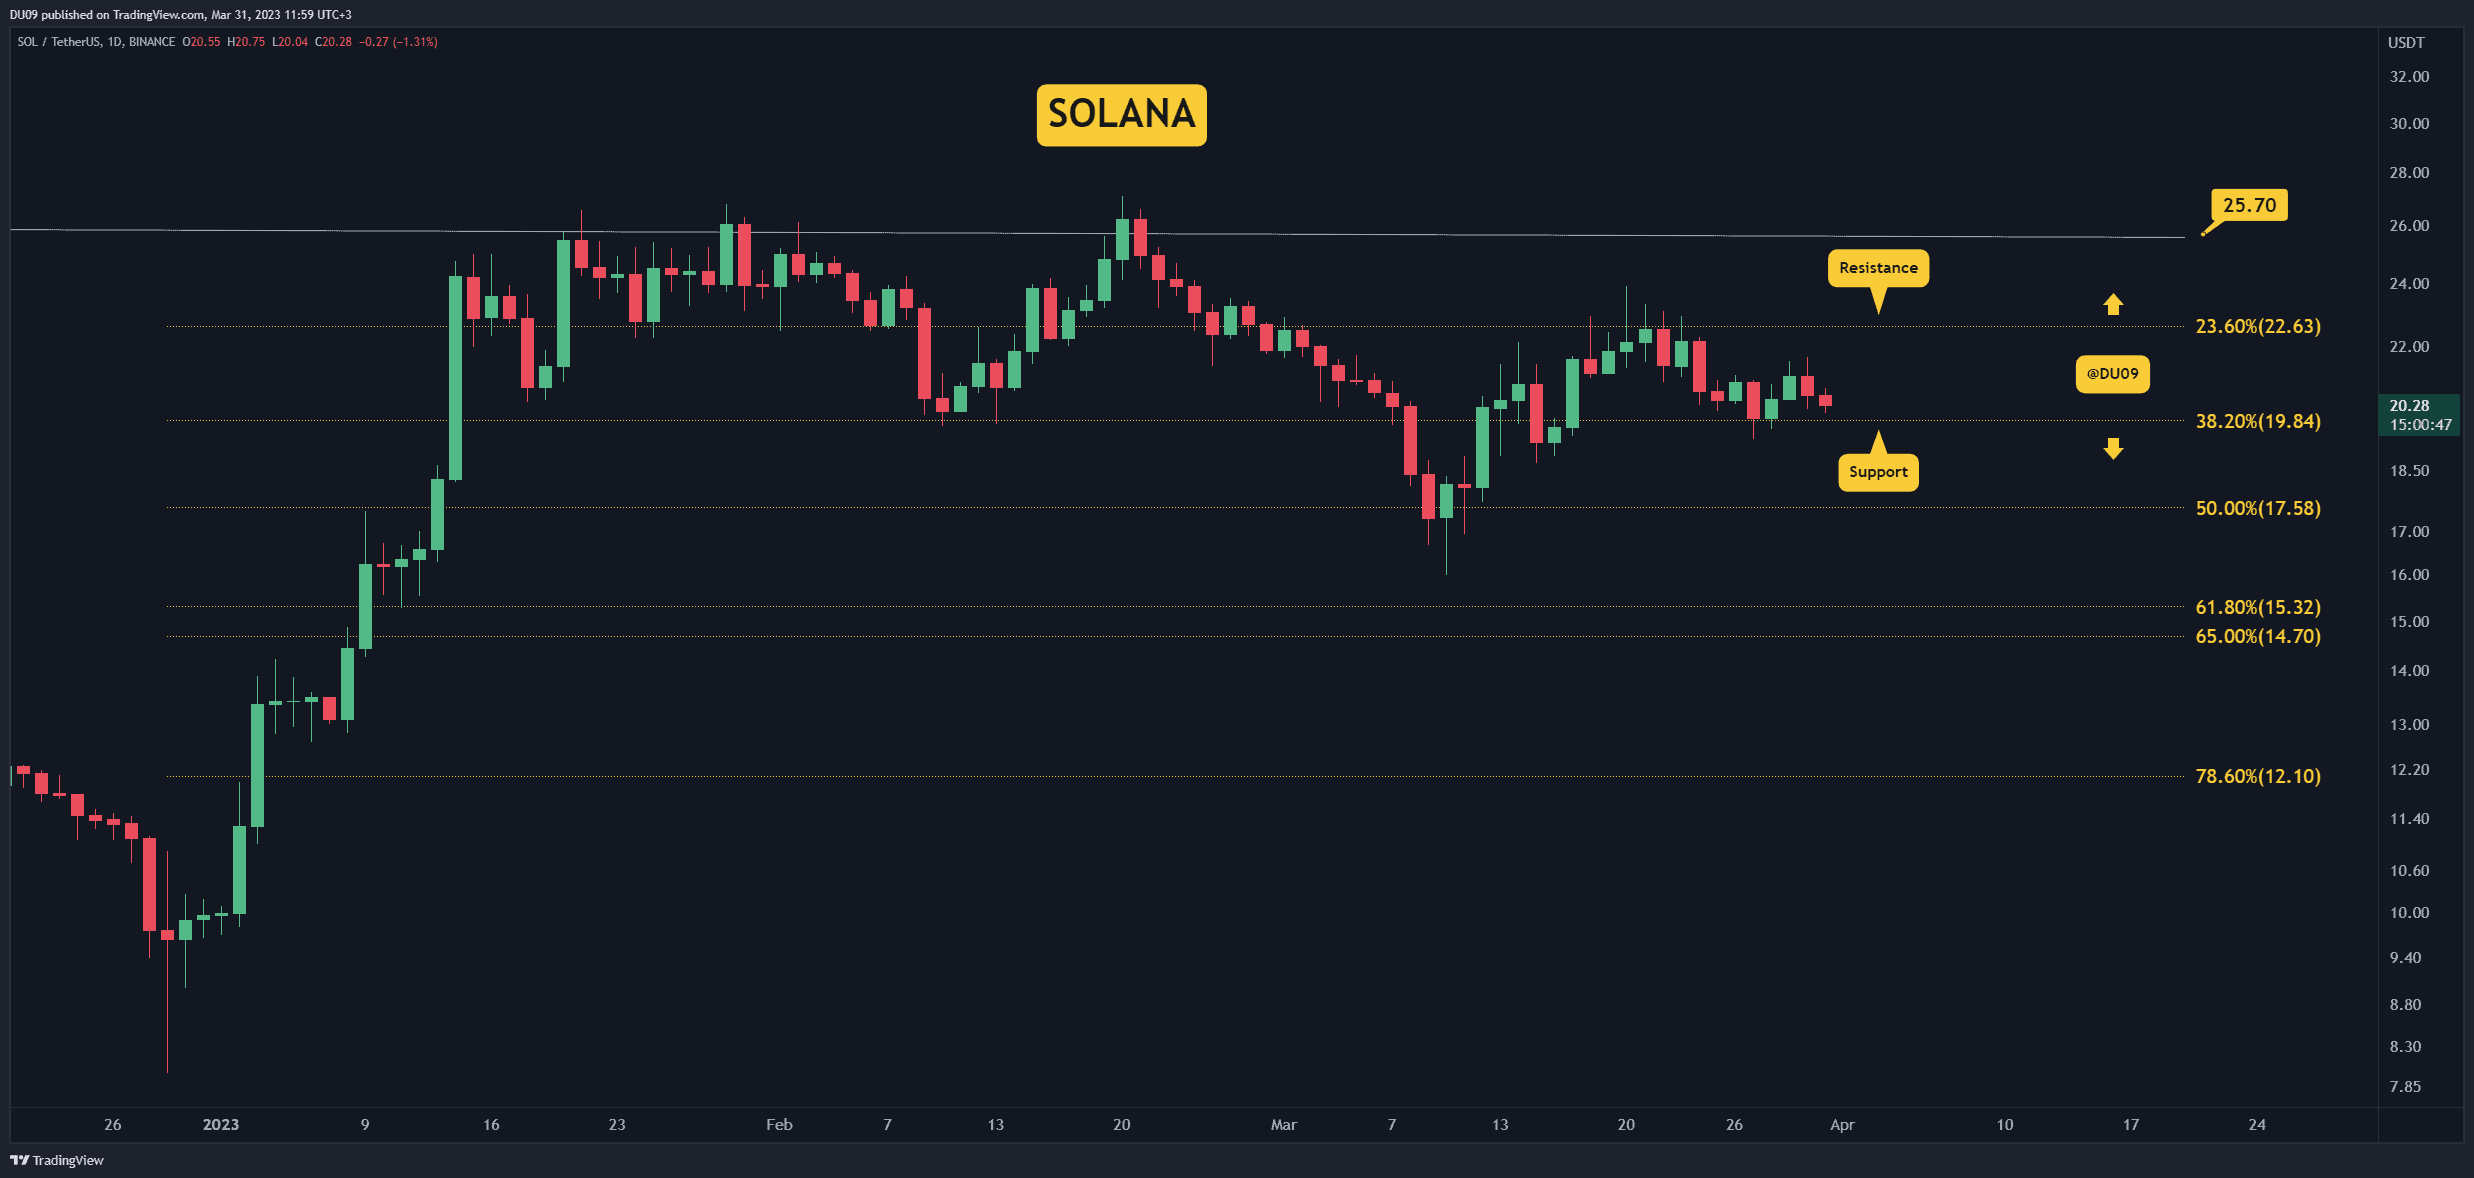
Solana is found in a downtrend since the end of February. This did not change in March despite a good attempt from buyers to reverse this. For this reason, SOL registered a 8.5% decrease in price this week.
This cryptocurrency has good support at just under $20, and it appears that bears will test this level again. If buyers fail to defend it, then a breakdown could take SOL to $17 next.
Looking ahead, the outlook on Solana remains bearish, but a lower low (under $17) appears unlikely at this time. Sellers do not show the conviction needed for that, bearing in mind the low volume in the past week.
Litecoin (LTC)
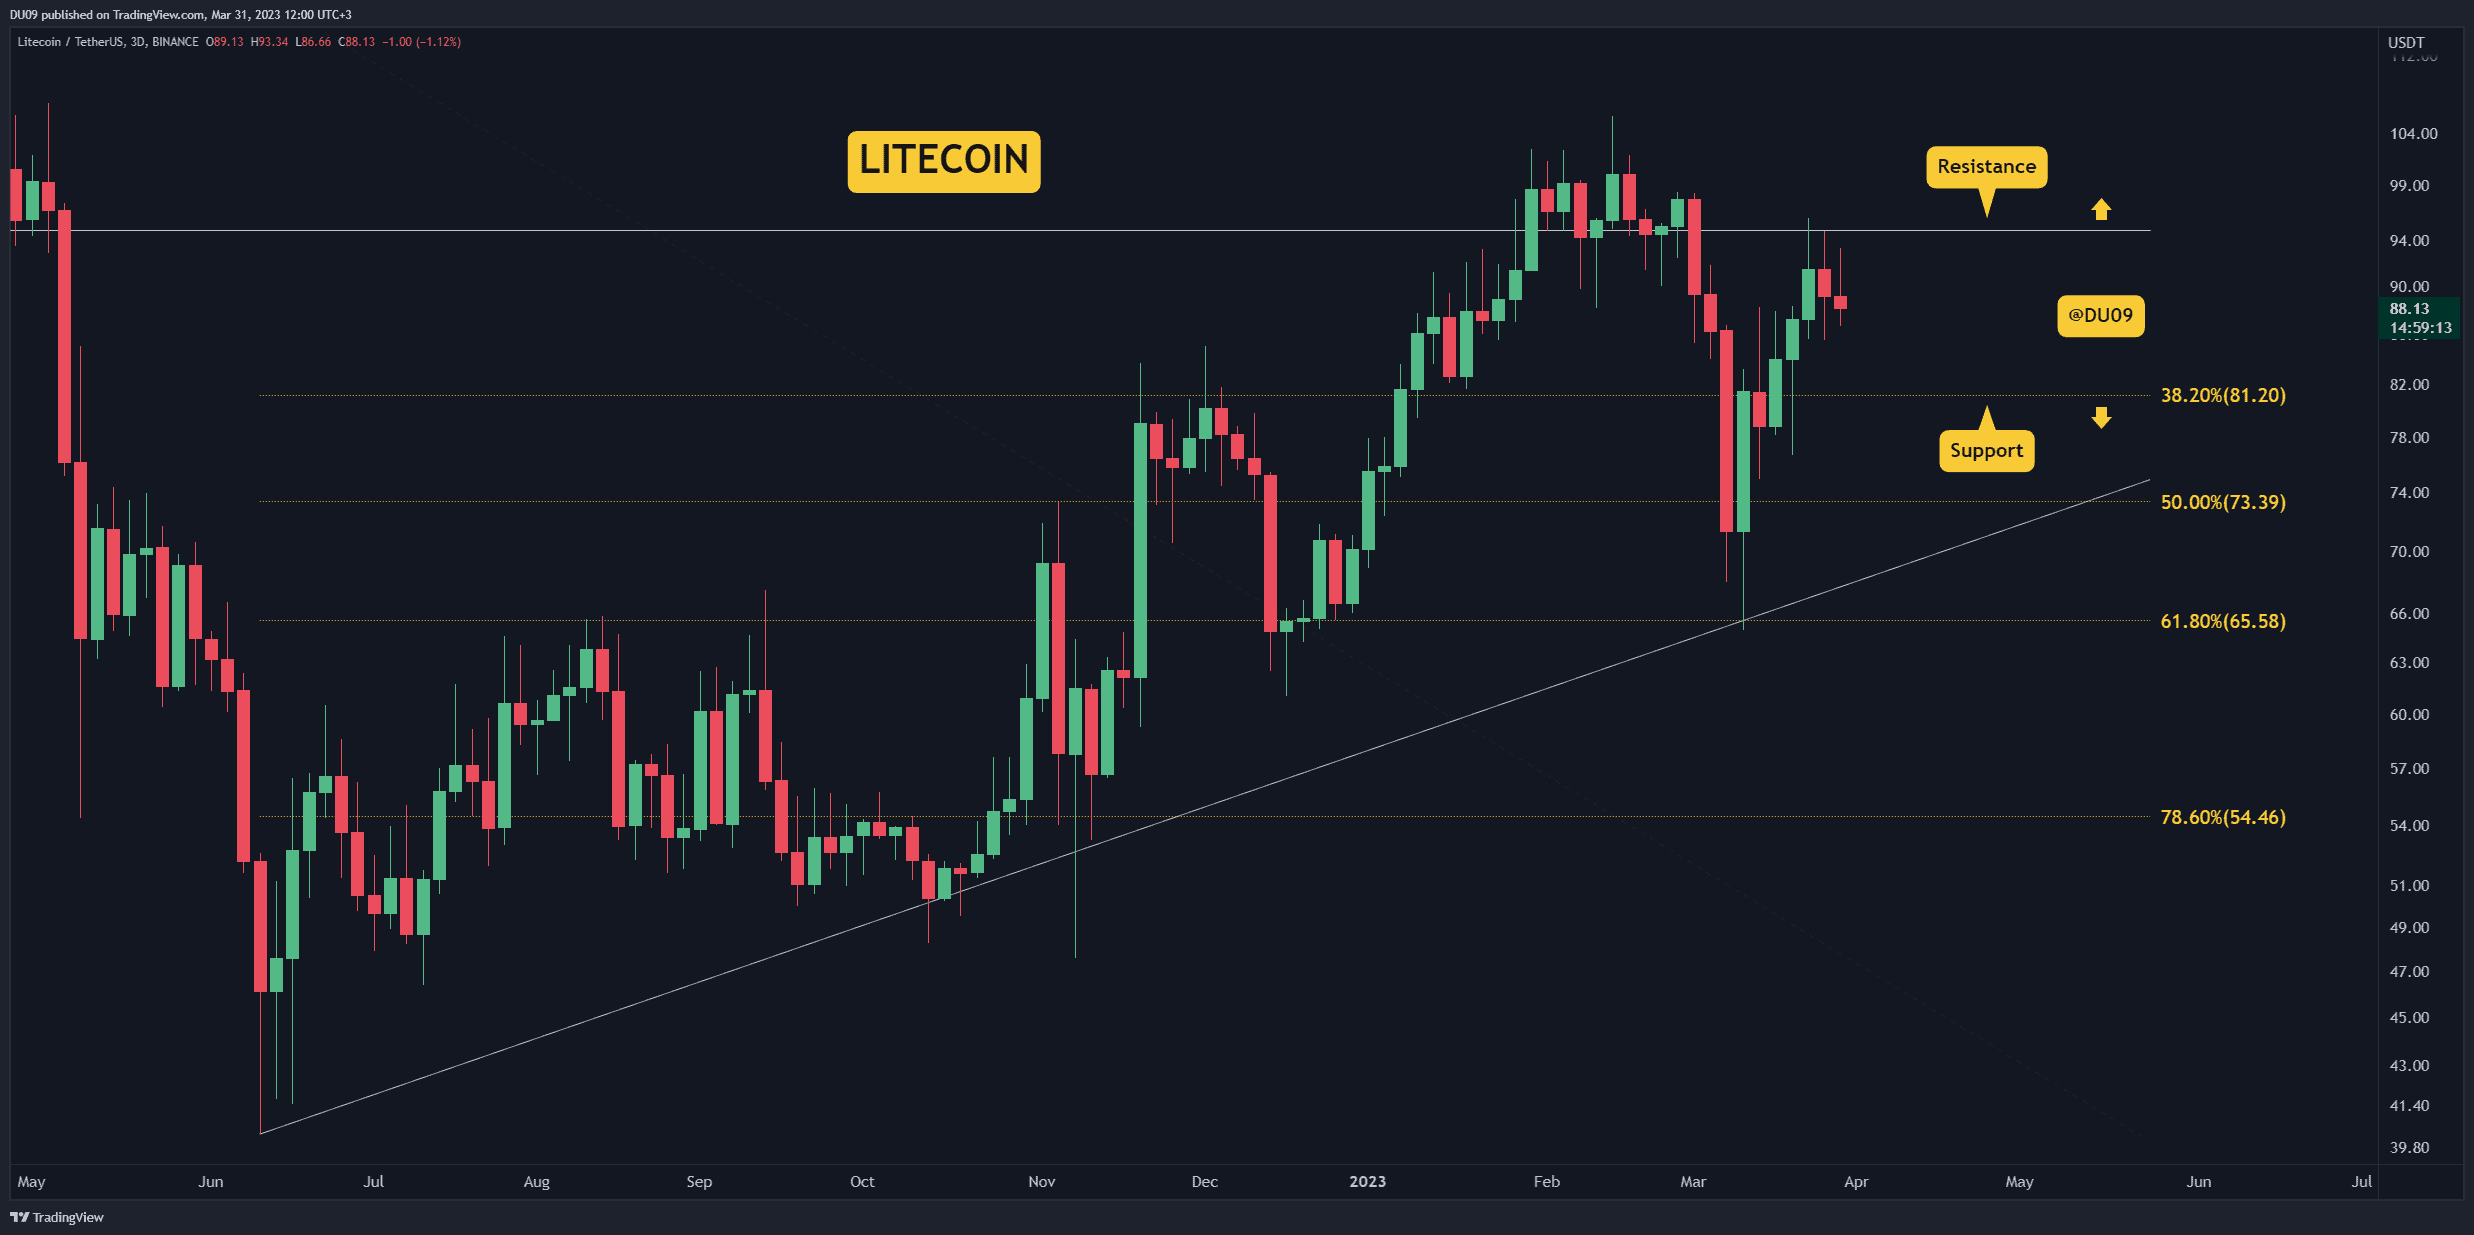
Litecoin was quite volatile this year, and most recently, in March, it experienced a sharp rally that took it all the way to the $95 resistance. Since then, the price entered a pullback and fell by 5.8% this week.
It is unlikely for LTC to break the key resistance at this time. A test of the support at $81 appears more probable. If buyers return there, then this cryptocurrency could find enough momentum to aim for $100 again.
Looking ahead, Litecoin had an impressive recovery this year when compared to late 2022. Should this continue, then it could try to reach and maintain a three-digit valuation in 2023.
The post Crypto Price Analysis Mar-31: ETH, XRP, ADA, SOL, LTC appeared first on CryptoPotato.

