Crypto Price Analysis June-24: Ethereum, Ripple, Cardano, Binance Coin, and Solana
This week, we take a closer look at Ethereum, Ripple, Cardano, Binance Coin, and Solana.
Ethereum (ETH)
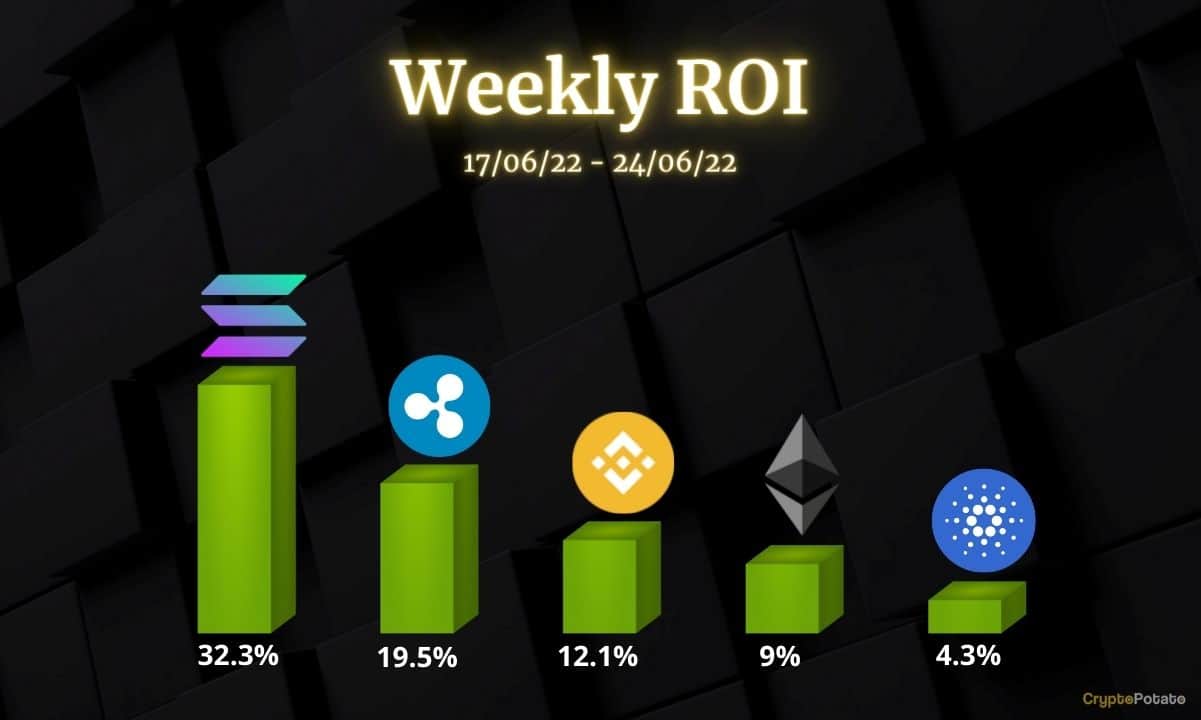
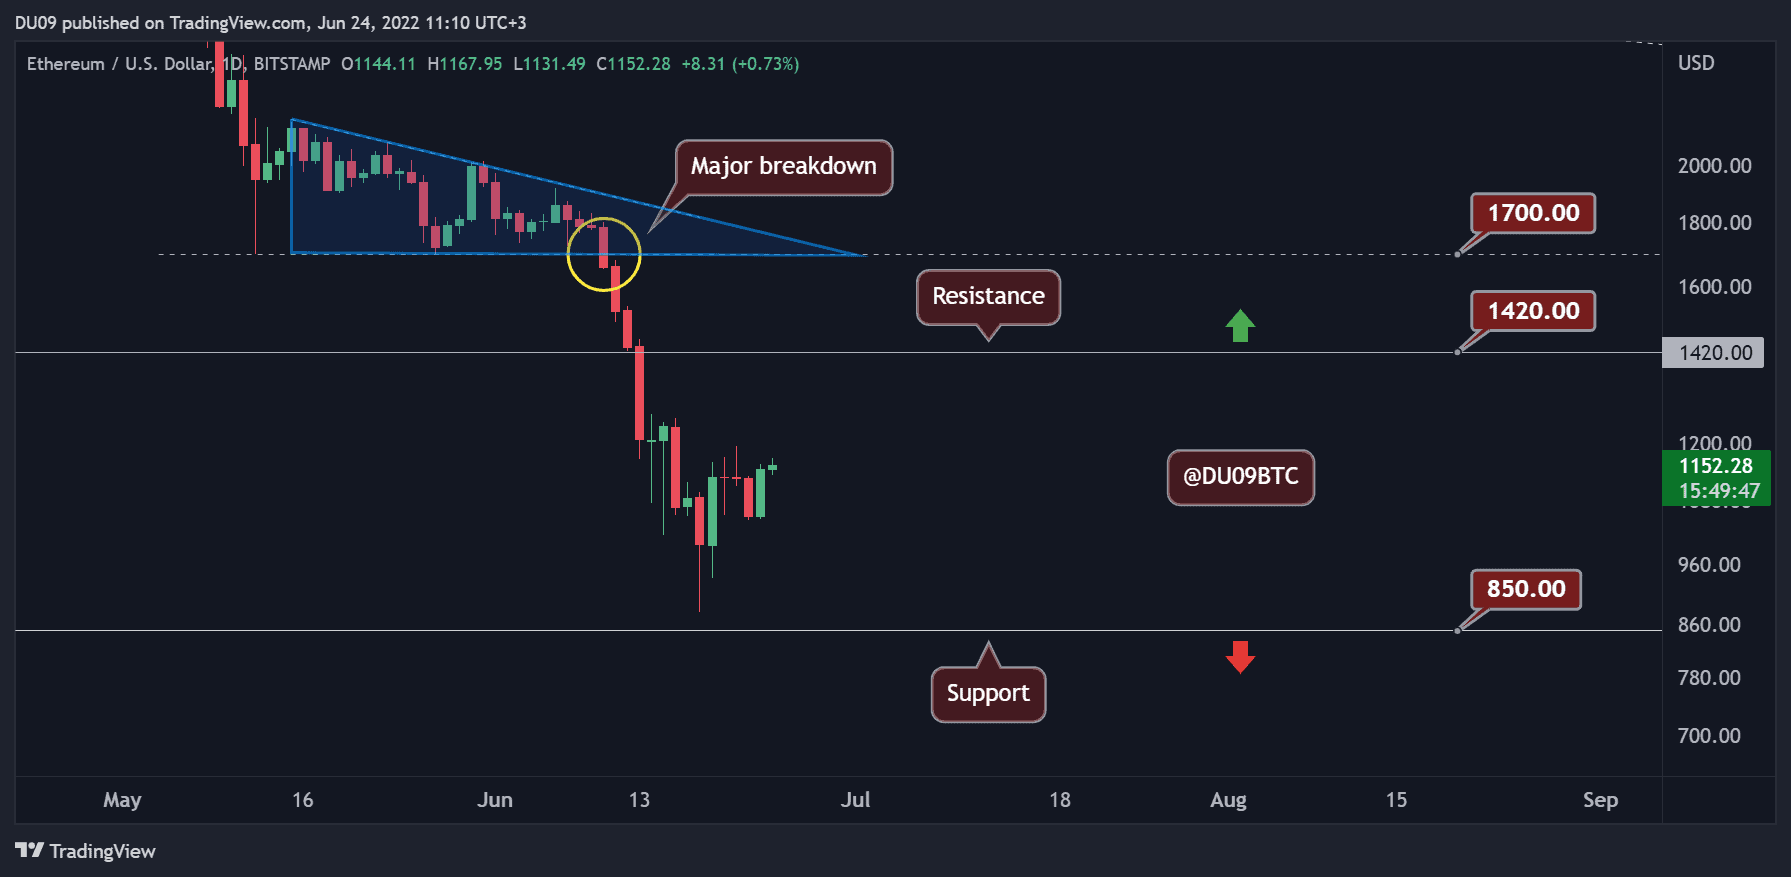
Ethereum had a very painful time in June, with the price dropping under $1,000. However, these declines have brought back buyers, and in the past seven days, ETH has increased by 9%. At the time of this post, ETH is sitting comfortably above the key support level.
This price action may turn into a significant relief rally with potential targets at $1,420 and $1,700. These levels will act as resistance if reached. For now, ETH is making higher lows, and the momentum is bullish. The MACD on the daily timeframe has also crossed to the bullish side yesterday, which confirms this bias.
Despite this, many market participants remain skeptical about the price going up, but after such a long correction, this should not surprise anyone. Rallies during bear markets can be significant, particularly when the price has been in a downtrend since March.
Ripple (XRP)
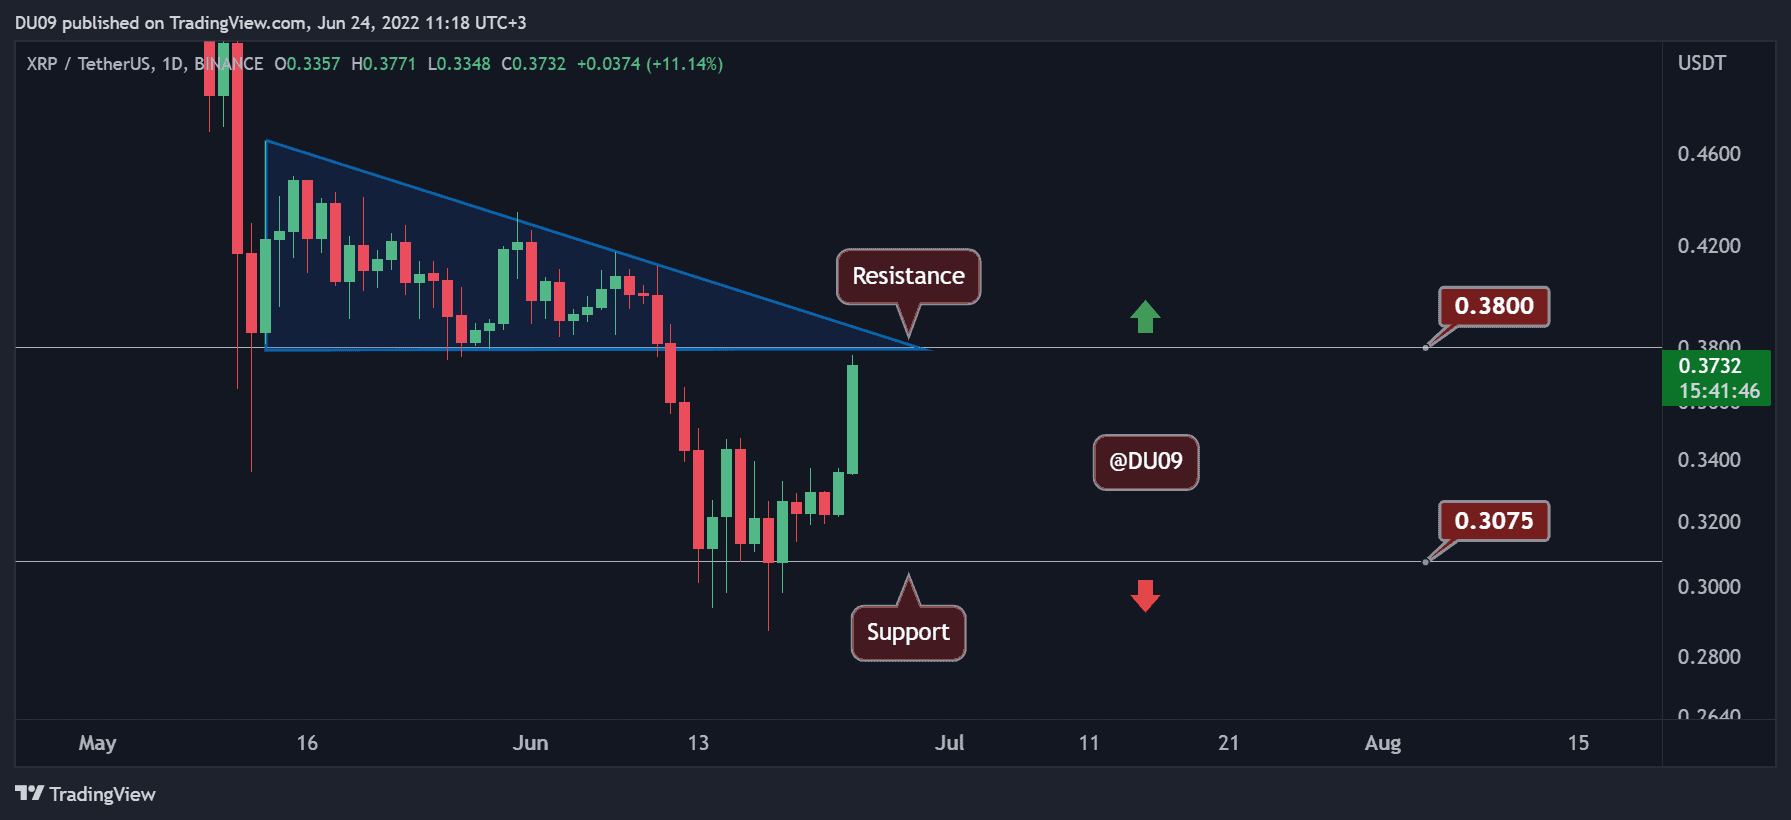
XRP had a strong performance this week, rallying by 19.5% in the past seven days. This latest push higher has taken the cryptocurrency to the key resistance at $0.38. It would be quite impressive to see it continue up without much regard for the resistance.
During the crash last week, XRP found good support at $0.30, and it acted as a strong pivot for its current rally. The short-term indicators on the daily timeframe have also turned bullish, and the RSI has moved above 50 points, placing it on the bullish side.
Looking ahead, the biggest question is if XRP will manage to break the key resistance. If so, buyers could push the price back to around $0.5, which would recover in full the losses in June.
Cardano (ADA)
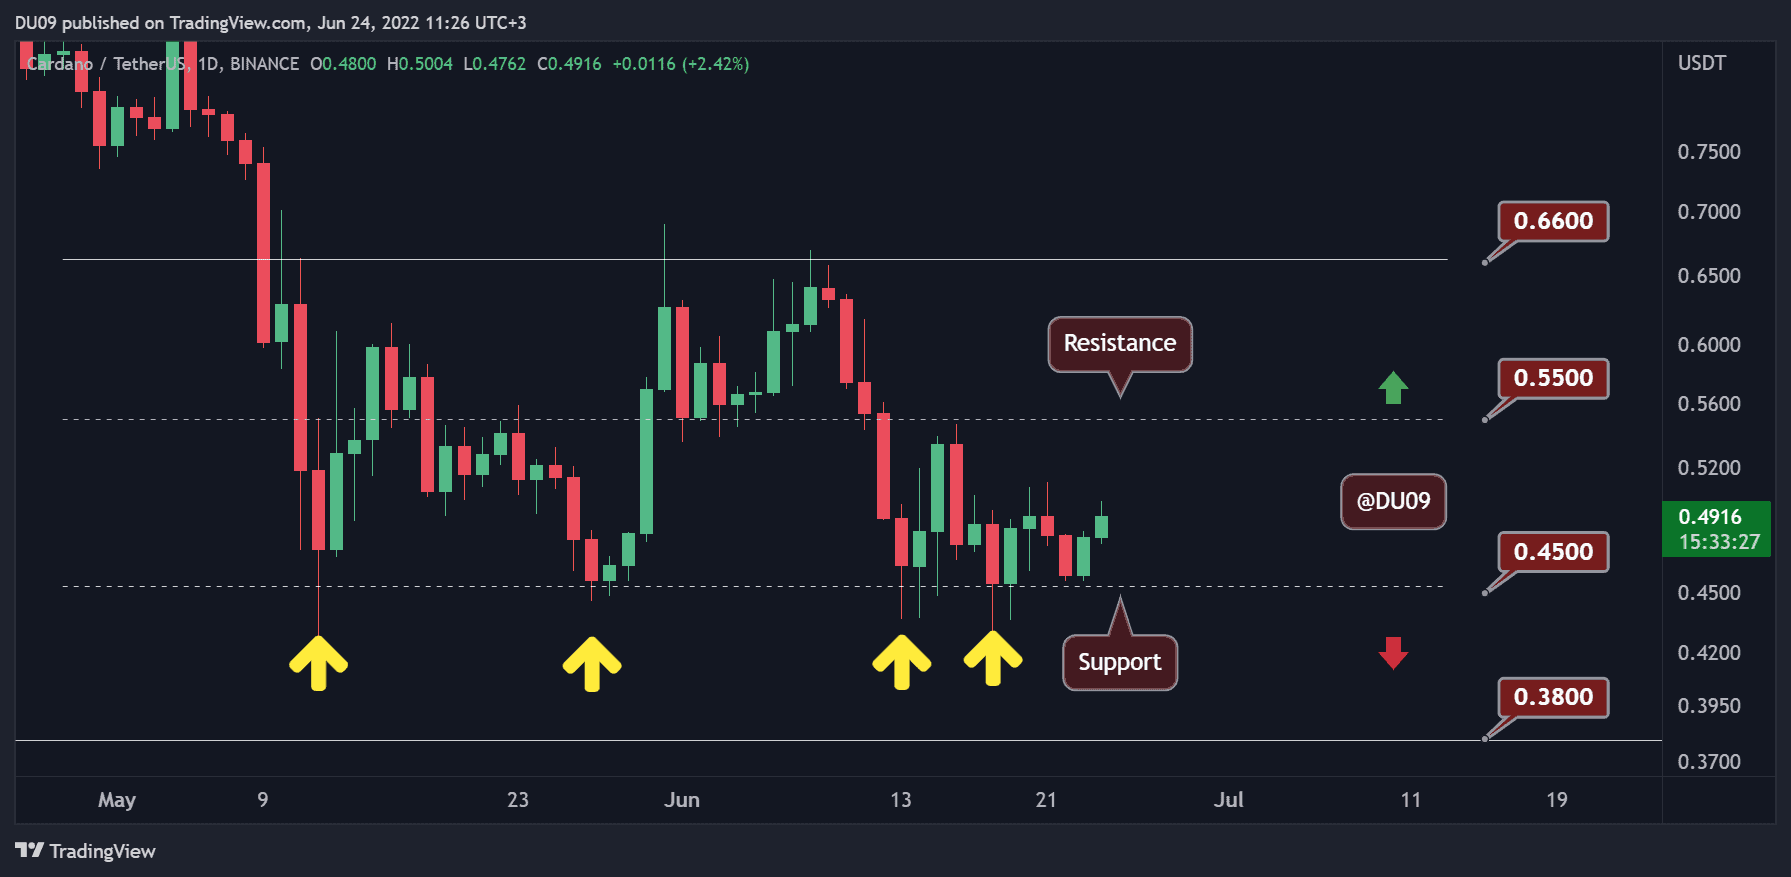
While Cardano has shown tremendous strength at the $0.45 key support level, it has disappointed in its recovery by failing to rally in a significant way to date. For this reason, its price only increased by 4.3% in the past seven days, which is five times lower than altcoins like XRP.
The price is condensing above the key support, and the indicators on the daily timeframe just turned bullish today with a MACD crossover to the positive side. Of course, this is a short-term outlook. On larger timeframes, the cryptocurrency remains in a downtrend.
Looking ahead, ADA may attempt to rally in the coming week to challenge bears at the $0.55 key resistance. If successful, then ADA could reach all the way to $0.66.
Binance Coin (BNB)
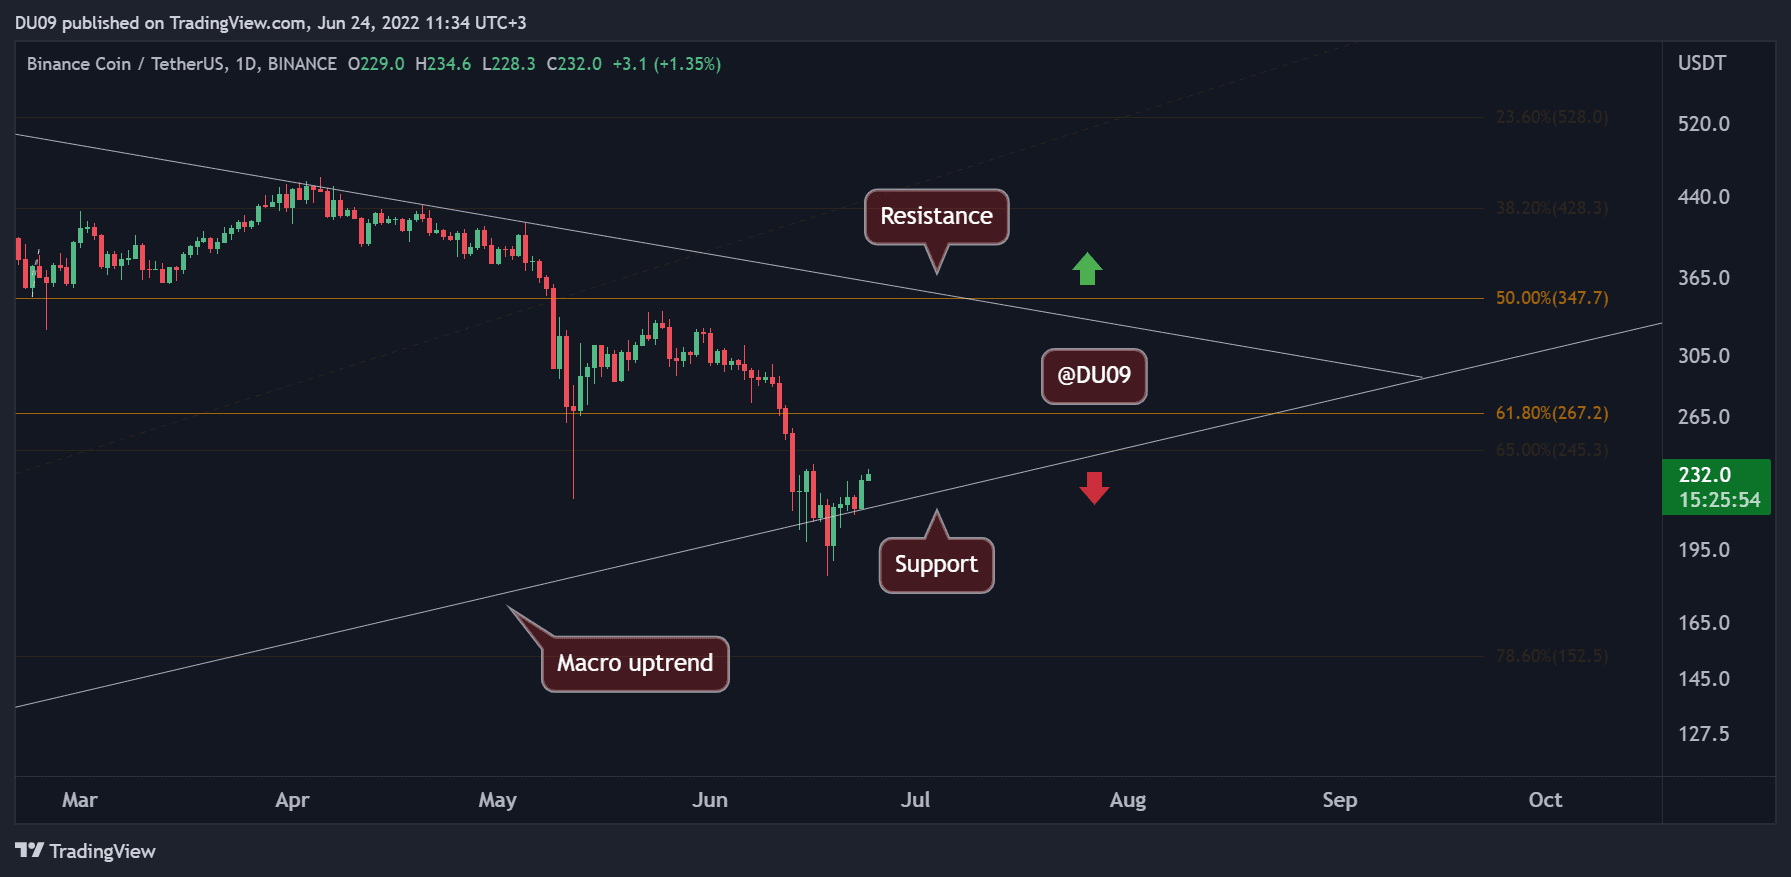
Binance Coin found itself in very dangerous waters in June when it trended under $200. This is because a price under that level would invalidate the uptrend set since March 2020. Luckily for BNB, this incursion under $200 was brief and short-lived. Since then, the price has been trending upwards, and the key support at $200 remains strong.
BNB had a good recovery so far, registering a 12% increase in the past seven days. This relief rally could continue up to $267, where the first resistance is found. If that won’t hold back the bulls, then the next key level to watch for is $347.
With the indicators turning bullish for Binance Coin, the bias is bullish in the near to medium term. However, be on guard as soon as the price approaches the first resistance at $267. A sharp rejection there could turn the sentiment bearish again.
Solana (SOL)
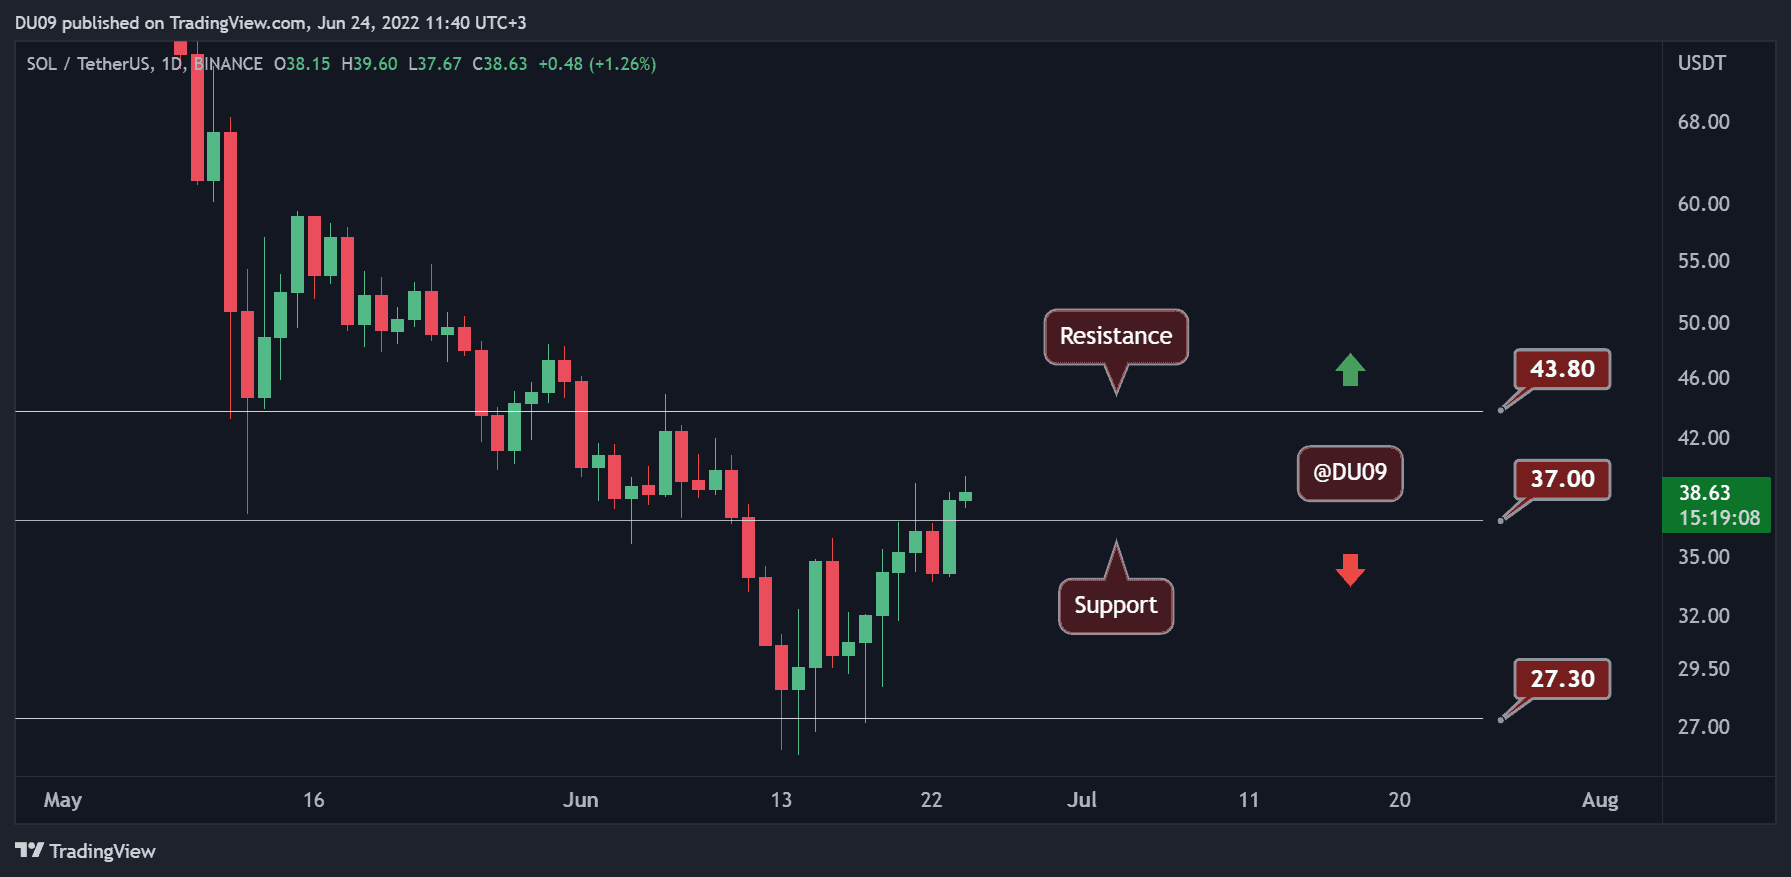
Since touching the support at $27, Solana had only one direction: up. For this reason, in the past seven days, SOL registered a 32% price increase. This makes it the best performer on our list. Most recently, the price has broken above the key resistance at $37, and it may soon challenge the resistance at $44.
This action and volatility have made SOL both the best and worst performer in the past, depending on the market trend at the time. Market participants have to account for this type of volatility in the future when considering Solana.
Looking ahead, SOL could continue to maintain its current uptrend in the near term. However, there will be some strong resistance as the price approaches $50. A rejection there could lead to a significant correction again.
