Crypto Price Analysis June-16: Ethereum, Ripple, Cardano, Solana, and Tron
This week, we take a closer look at Ethereum, Ripple, Cardano, Solana, and Tron.
Ethereum (ETH)
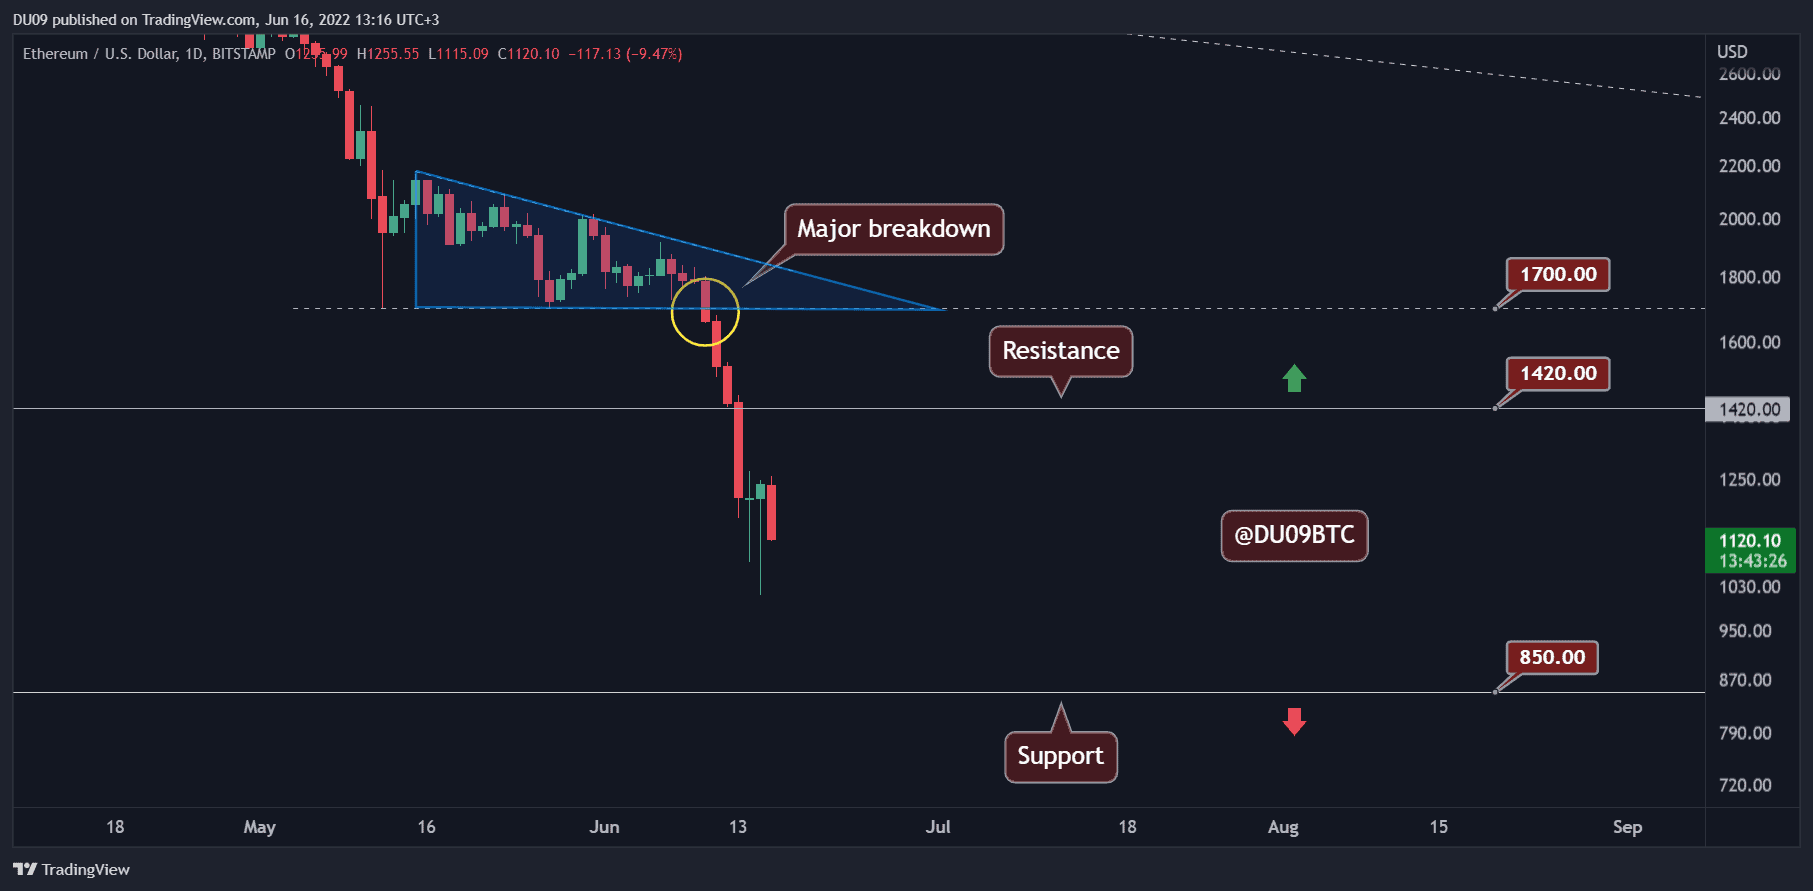
Ethereum has made history this past week when, for the first time ever, its price fell below its old all-time high from January 2018 ($1,420, Bitstamp). After the cryptocurrency broke below the descending triangle discussed in our last update, the price took a massive nosedive, falling by over 40% before recovering slightly.
ETH has lost 37% of its value in the last seven days. This crash is similar to the one in May in terms of volume and price action. With the support at $1,700 and $1,420 lost and turned into resistance, all eyes are now on the $1,000 level. If that falls, then it would seem probable for ETH to fall towards $850.
The fact that Ethereum is now close to a three-digit valuation brings a lot of anxiety and the outlook does not seem very positive. The market appears on the edge and it is still uncertain if the downtrend will continue or not.
Ripple (XRP)
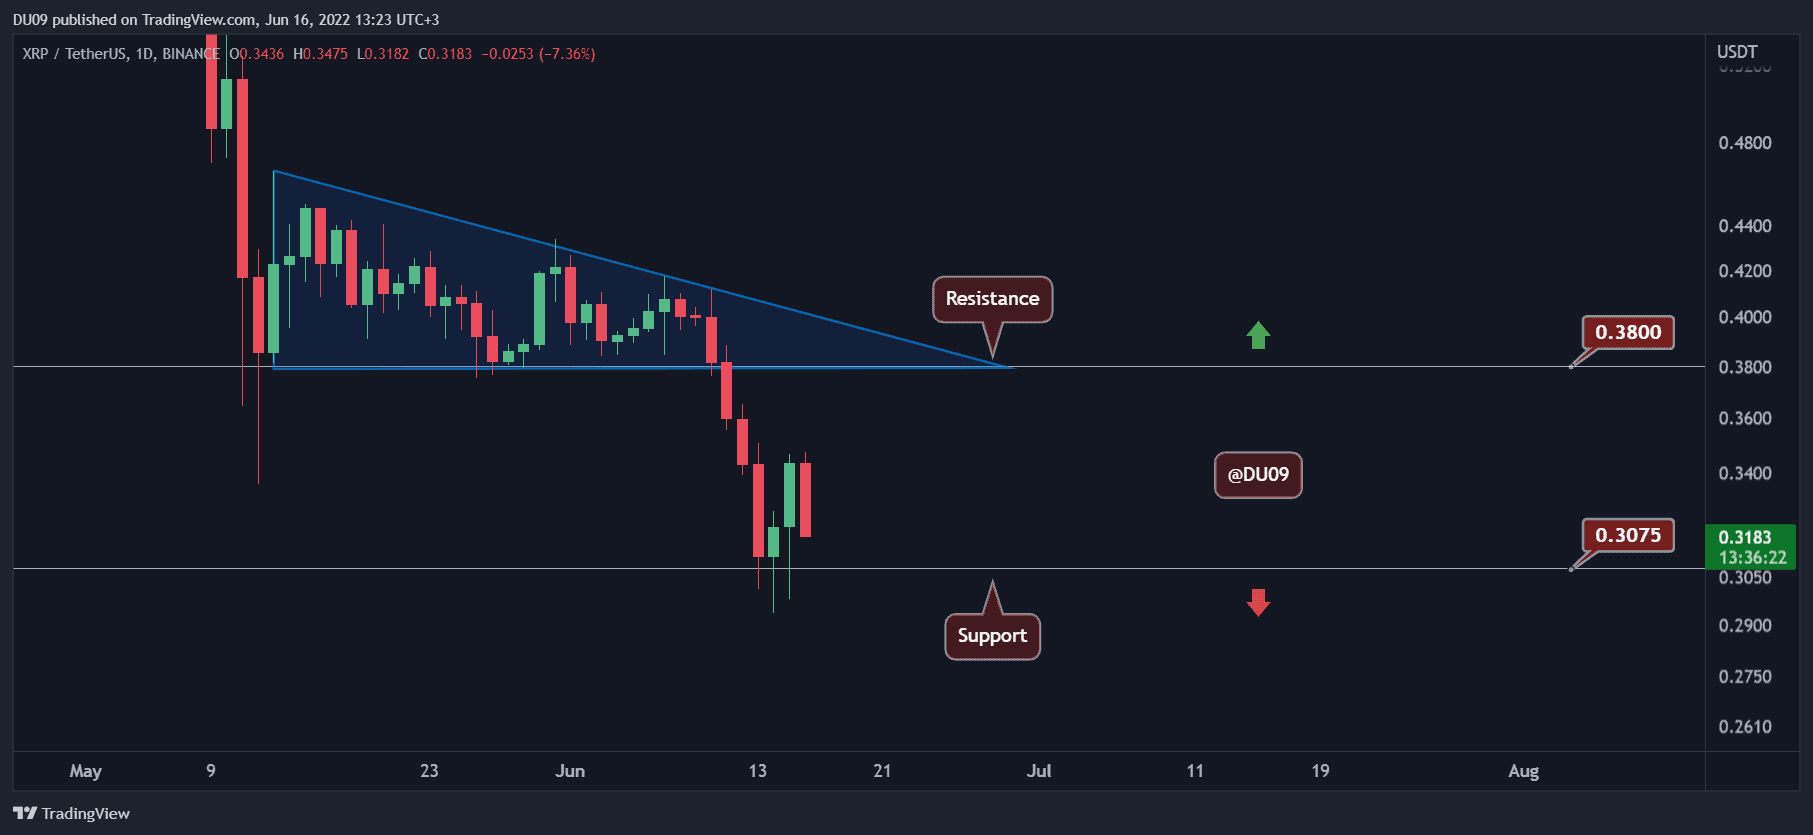
Similar to Ethereum, Ripple also suffered from its price falling by 20% in the past seven days. Buyers managed to stop the downtrend on the $0.30 support level and, so far, the cryptocurrency has managed to stay above this key level.
The resistance is found at $0.38 and is represented by the base of the descending triangle from where the price fell. Unfortunately for buyers, the macro picture and indicators on the daily timeframe have turned bearish due to this latest crash. In particular, the MACD has flipped to the negative side and it doesn’t seem probable that we will see a quick reversal at this point.
Looking ahead, XRP has to stay above $0.30. Otherwise, the path opens up for bears to take the price towards 20 cents which would erase almost two years of increase and take us back to 2020 price levels.
Cardano (ADA)
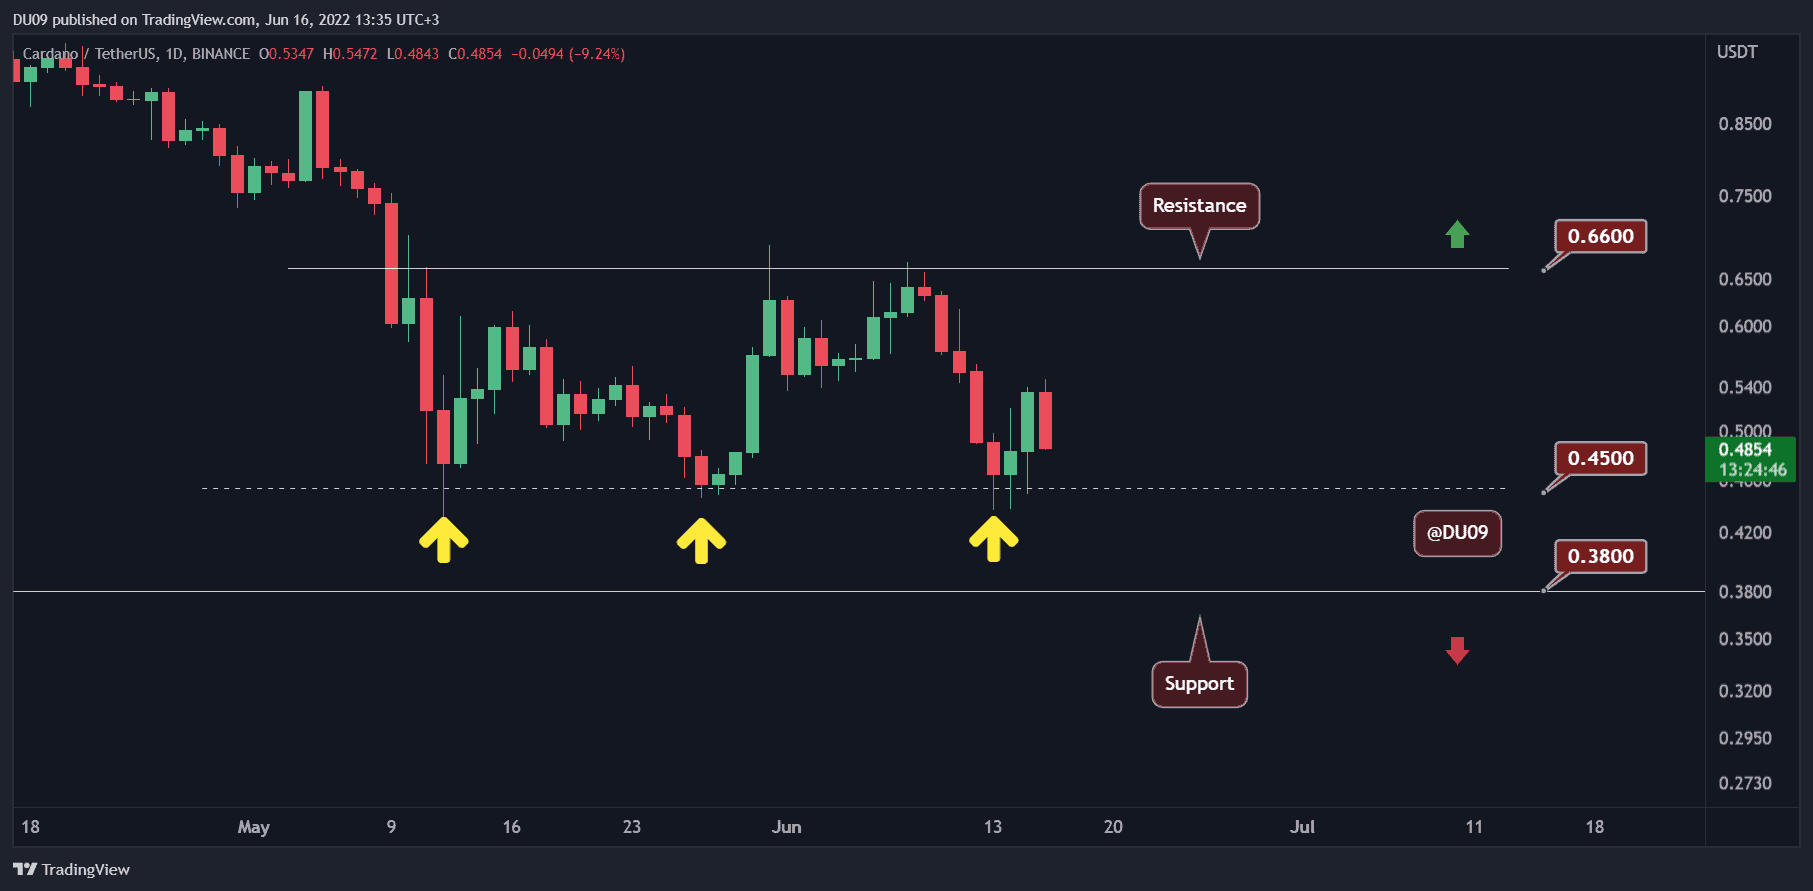
ADA showed a lot of strength this past week. Even as the price fell by 23% in the past seven days, the cryptocurrency has managed something most altcoins failed at. It did not make a lower low during this latest crash.
The price was once more defended at the $0.45 key support level. So long it holds, there are reasons to be optimistic. But the selling pressure is unlikely to stop as the overall market remains bearish and the daily MACD for ADA also turned bearish a few days ago.
The resistance sits at $0.66 and the price is unlikely to approach these levels any time soon since the market is in search of a bottom. If buyers fail to stop the downtrend, then ADA may re-test the key support at $0.45. If that does not hold, then the next support level will be found at $0.38.
Solana (SOL)
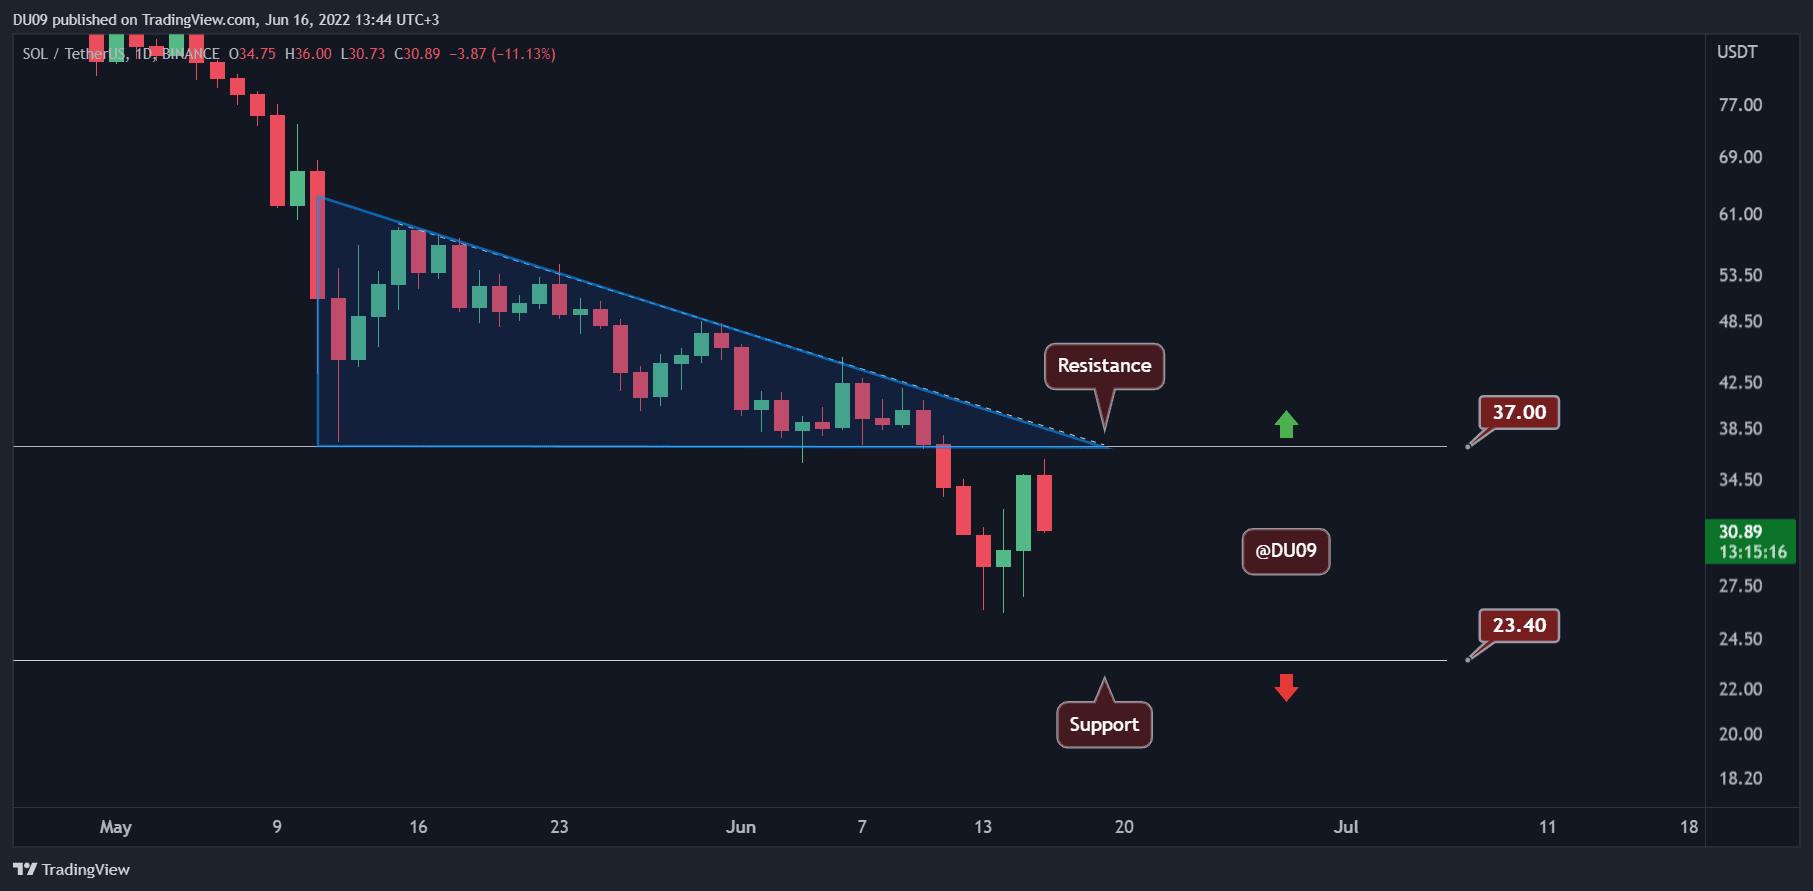
Solana’s price action is much more similar to ETH and XRP than ADA. As seen on the chart below, SOL lost its key support at $37 and has fallen by 20% in the past seven days. With the price now below the descending triangle, buyers have to do their best to stop the downtrend and defend the critical levels at $28 and $23.
With SOL approaching a 90% correction from its current all-time high ($260, Binance), the indicators on timeframes above one day are quite oversold and give signs of exhaustion for sellers.
Since the cryptocurrency has not had a relief rally since March, the likelihood of such a rally increases the further the price falls. Therefore, sellers need to keep a close eye on this as Solana can quickly reverse if market sentiment improves in the future. For now, buyers have to do their best to keep Solana above the levels mentioned above.
Tron (TRX)
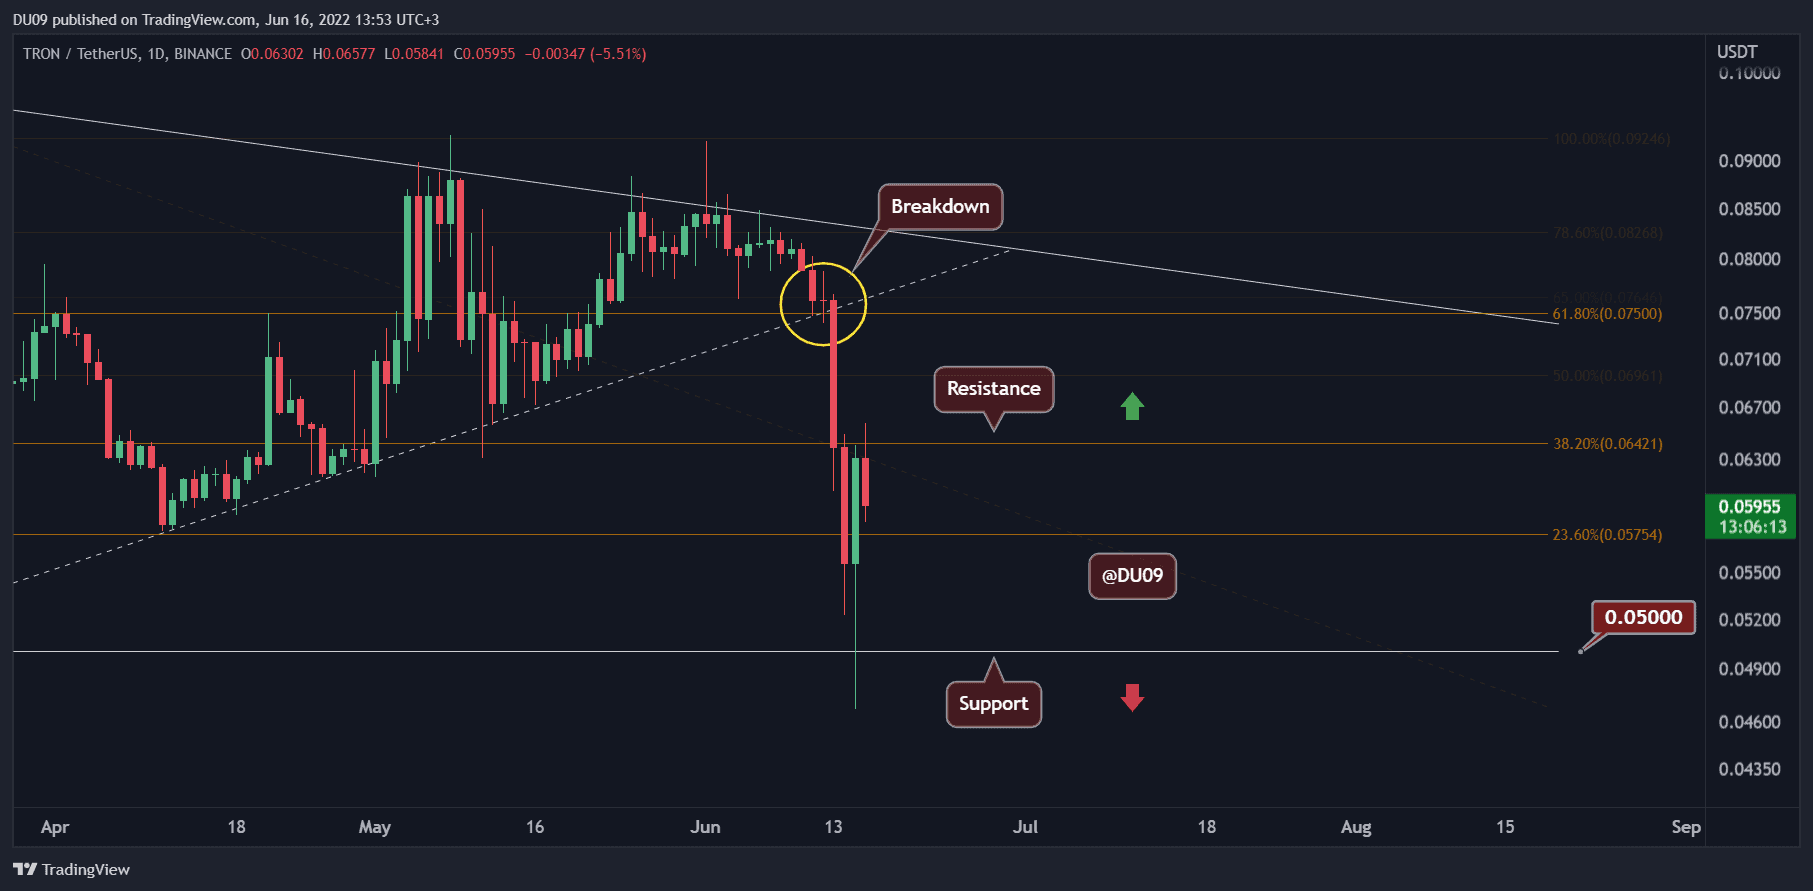
Tron has lost its glimmer over this past week after it gave up its uptrend and crashed by 27% compared to the last seven days. The price fell all the way down to $0.050 after sitting at $0.080 not too long ago. This change of momentum towards a bearish price action surprised the market and started at the moment the algorithmic stablecoin tied to TRX, USDD, lost its dollar parity.
Since then, the price action turned bearish and it is unlikely we will see Tron return to the uptrend any time soon. The support at $0.050 seems to hold well so far, but any attempts at recovery were quickly rejected by the resistance at $0.064.
Looking ahead, the cryptocurrency will likely continue to be under pressure from bears, especially if the USDD peg is not restored. At the time of this post, the USDD price is $0.975 which represents a 2.5% disparity.
