Crypto Price Analysis Jan-7: Ethereum, Binance Coin, Cardano, Solana, and Luna
This week, we take a closer look at Ethereum, Binance Coin, Cardano, Solana, and Luna
Ethereum (ETH)
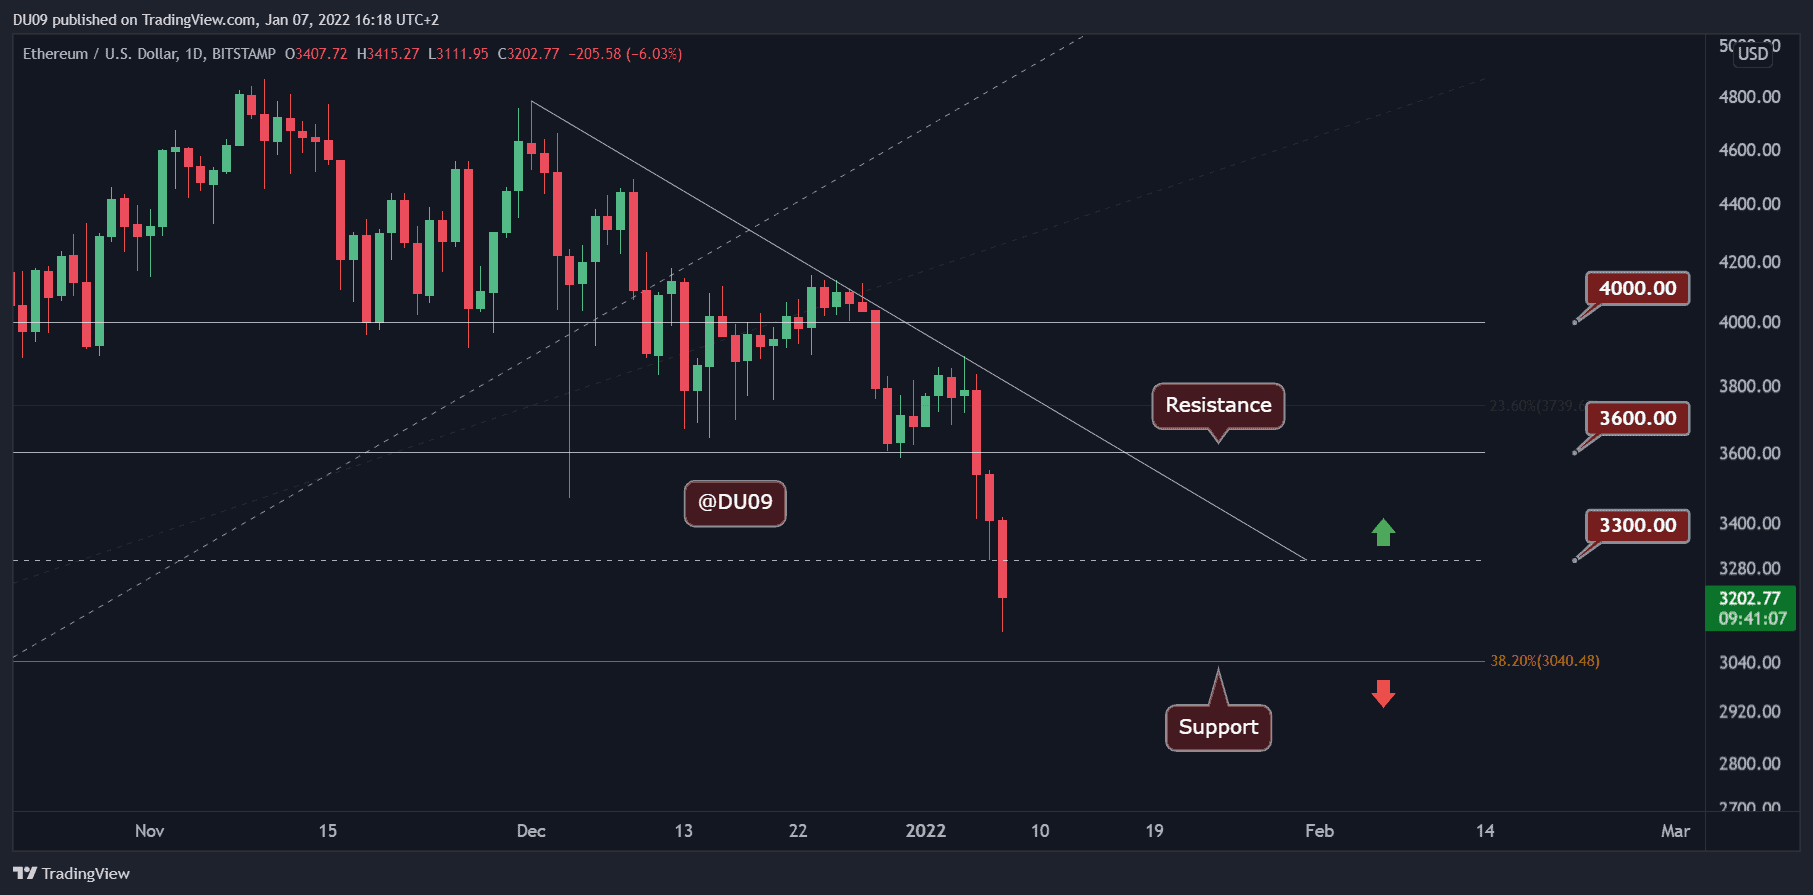
Throughout the past seven days, we saw a crash in the crypto market and ETH was no exception, falling over 14.6% in the period. After a brief attempt earlier this week to push towards $4,000, the price quickly turned on Wednesday, breaking below the $3,600 support, which is now a resistance. The downtrend did not fade today and continued with ETH falling under $3,300.
At the time of this post, ETH looks very weak, and a test of the $3,000 support appears likely before any significant bounce can be expected. The market, as well as ETH, is now in oversold territory. Therefore, a relief rally is likely in the near future once bears decide to let go of the current assault.
ETH may recover in the coming week if the selling pressure fades. However, for the downtrend to end, it needs to break above $3,600, which appears quite unlikely considering current market conditions.
Binance Coin (BNB)
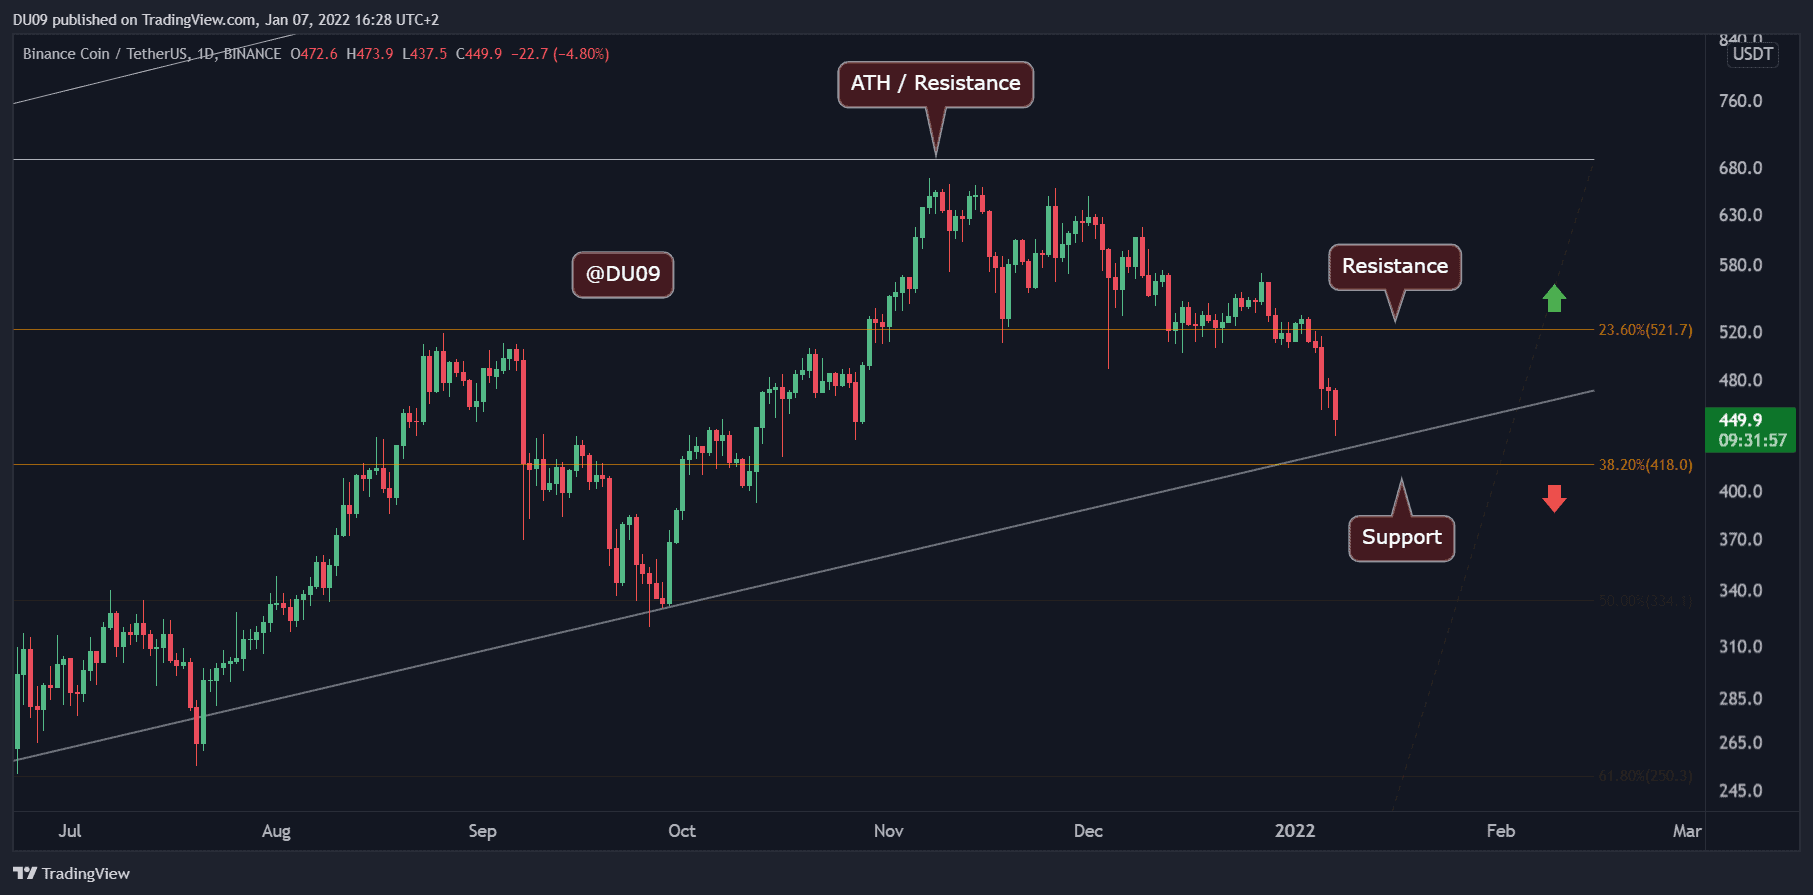
BNB was not spared this week and fell under $500, with the price now on a path towards the $420 support level. Overall, the cryptocurrency closed the past seven days with a 13.8% loss in price, similar to ETH.
The support level has a good chance to stop the current downtrend. Should a relief rally start after that, then BNB has resistance at $520. It is very difficult to expect a bounce right now.
The daily RSI is already in the oversold territory, and this shows that the selling pressure might have reached a climax. With the weekend approaching, which usually has lower volume, BNB may take a pause before making its next step.
Cardano (ADA)
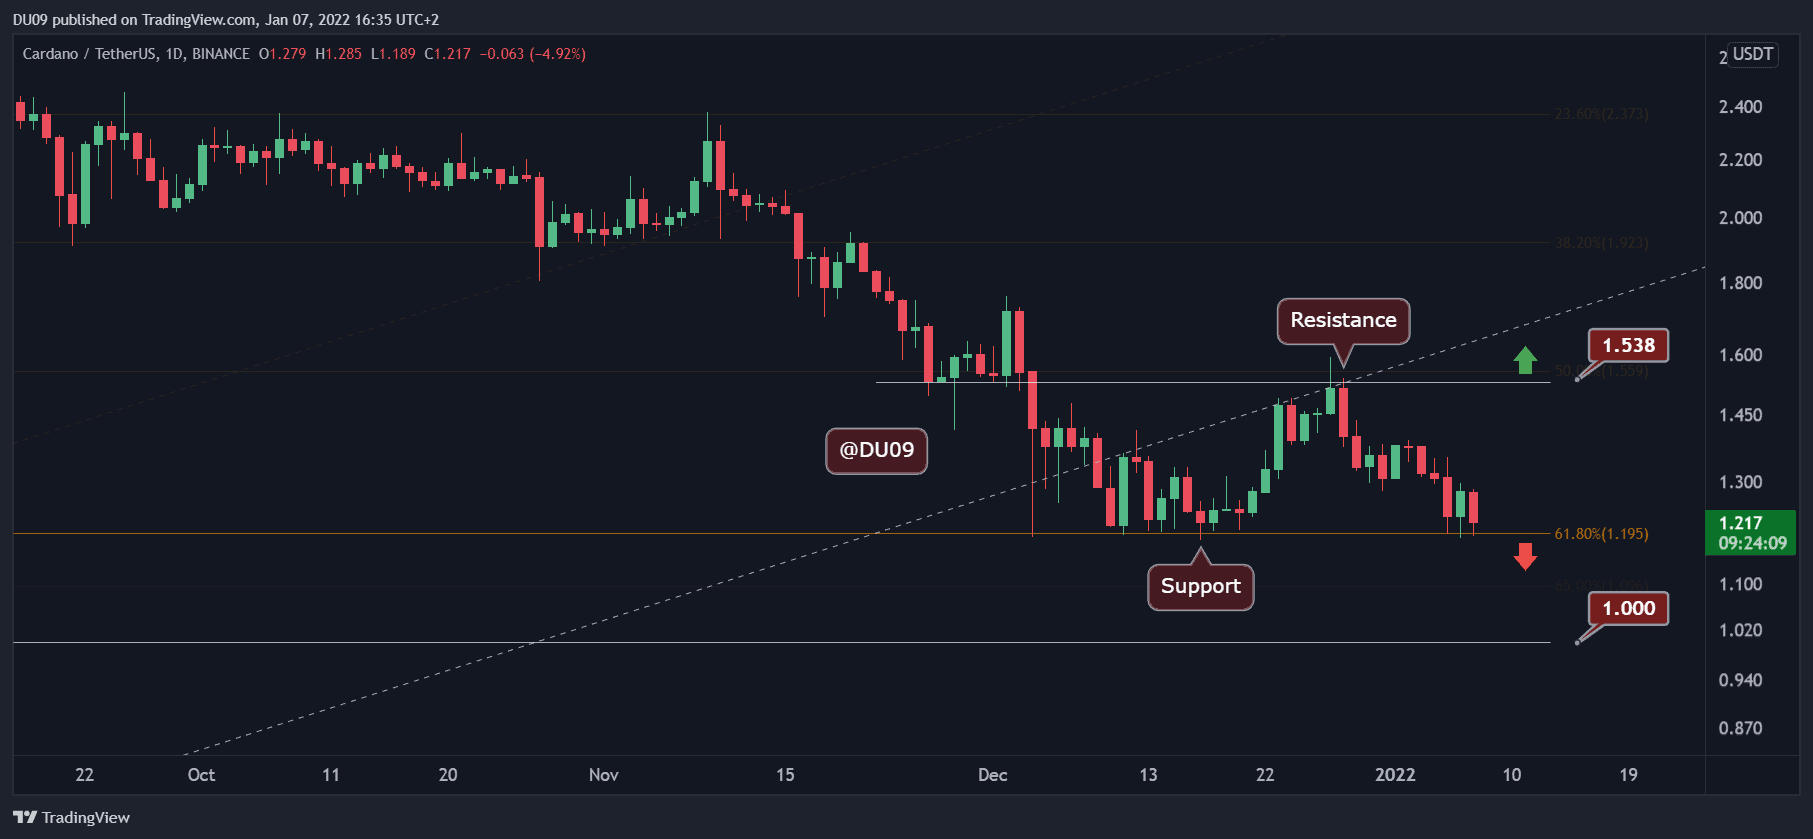
ADA has shown resilience during the assault from bears in the past three days, managing to successfully defend the $1.2 support level every day. For this reason, it has fared better than ETH or BNB, with a 10.4% loss in price in the past seven days. The critical support continues to hold well, despite the bearish market.
Buyers seem very interested in ADA at this price level, and the chart shows it. However, each time the support level is tested, the risk of it breaking increases. It would be quite impressive if ADA manages to hold here. If a relief rally starts, then ADA has resistance at $1.5.
Looking ahead, ADA remains in a range between $1.2 and $1.5.
Solana (SOL)
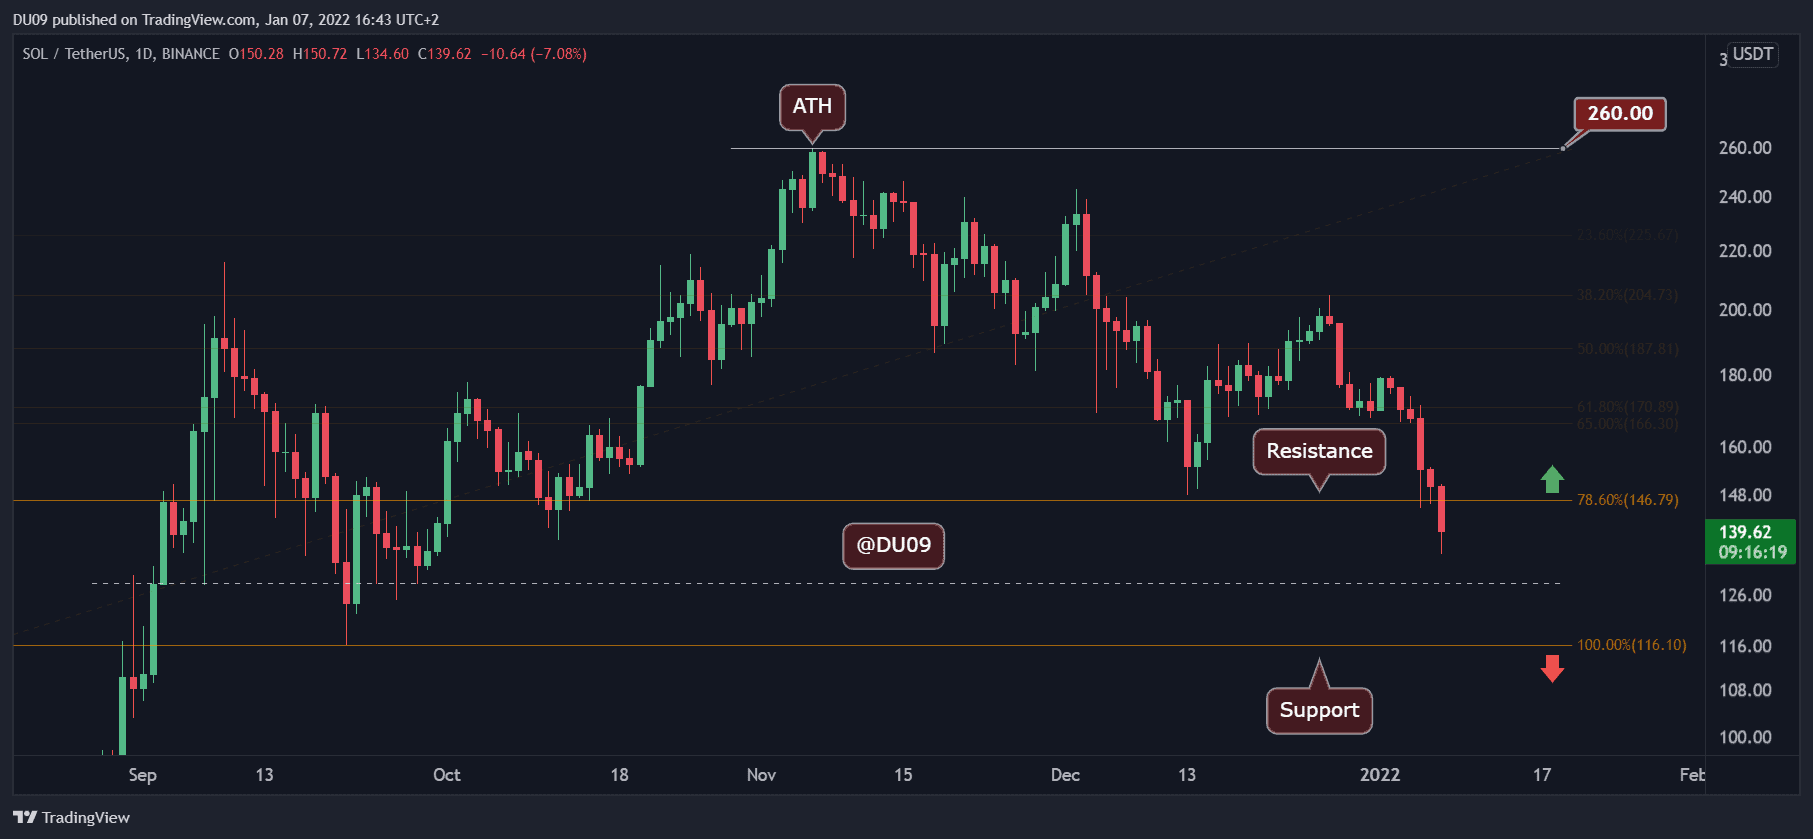
After SOL got rejected at the $200 resistance level, the price has entered a severe correction, falling almost 20% in the past seven days. The current support for SOL is found at $128 and $116, which should provide a break in the downtrend.
Moreover, the daily RSI has reached the oversold territory showing that the bulk of this correction might be behind us. Nevertheless, the daily MACD remains bearish, and the volume increased as the correction progressed which is a another strong bearish signal.
The current resistance can be found at $148 and is unlikely to be tested until SOL stops the current downtrend.
Luna
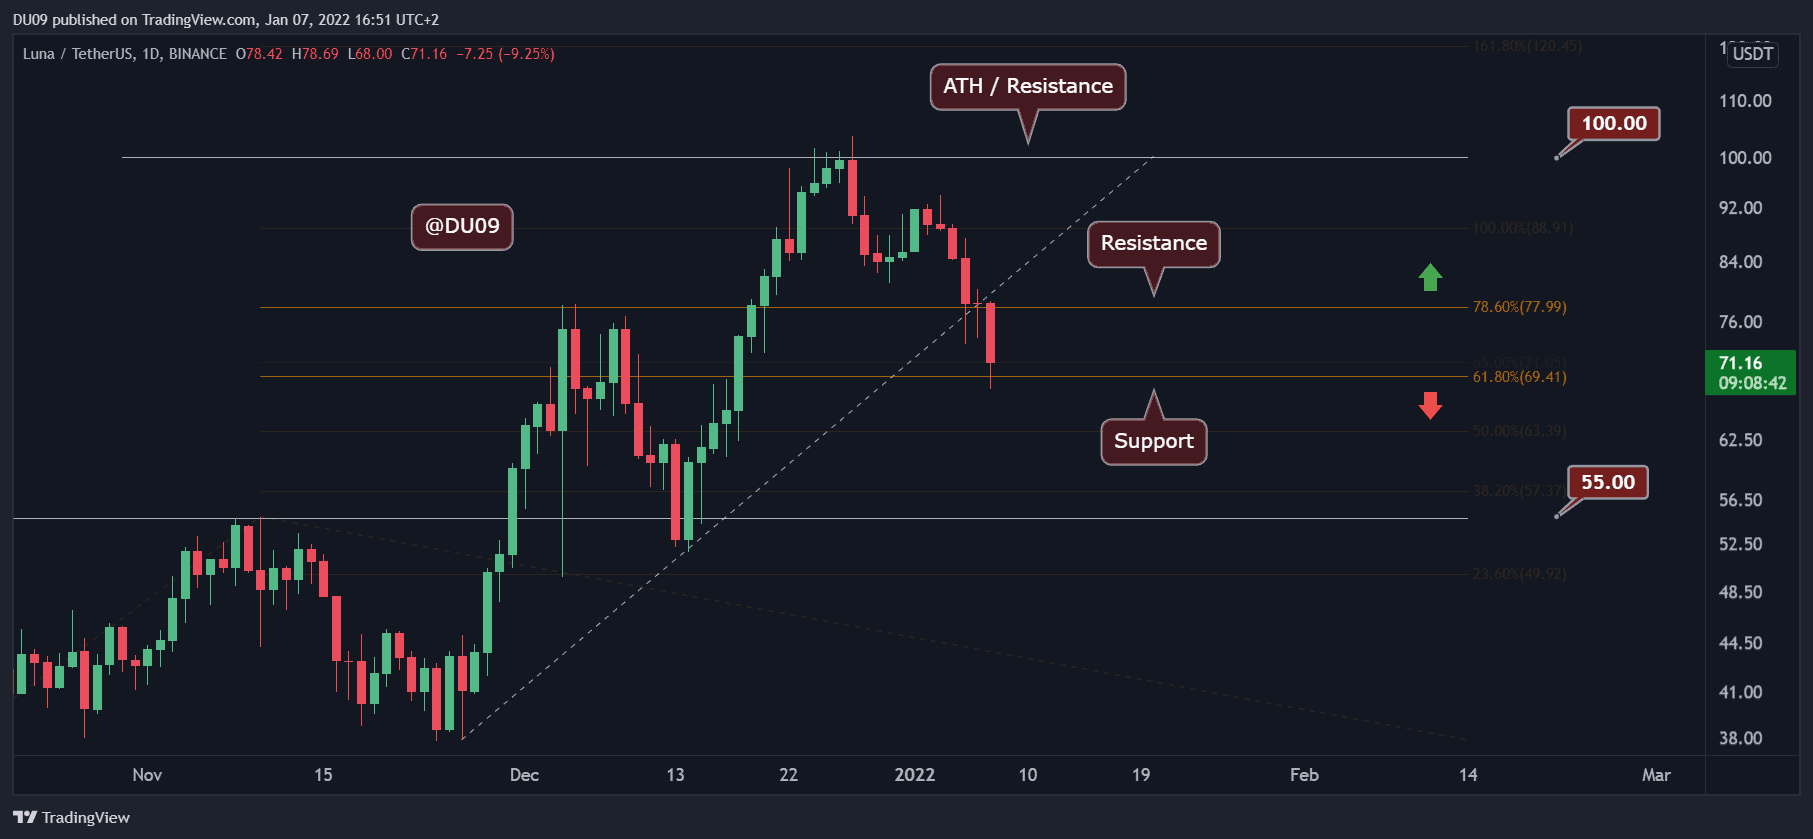
When Luna reached $100, the market participants were euphoric. However, the price action since then has been nothing but a disappointment, with the cryptocurrency dropping to $70 at the time of this post after losing 17% of its valuation in the past seven days.
The key support at $70 seems to hold for now, but Luna broke below the key level at $78, which is now acting as resistance. It had to maintain a price above $78 to keep the uptrend momentum intact. This has been lost now.
For this reason, the short to medium-term bias is now bearish, and if the downtrend continues, then the price might even visit $50. Both the MACD and RSI are quickly falling to lower levels on the daily timeframe without any sign of a reversal at the time of this post.
