Crypto Price Analysis April-28: Ethereum, Ripple, Cardano, Solana, and Shiba Inu
This week, we take a closer look at Ethereum, Ripple, Cardano, Solana, and Shiba Inu.

Ethereum (ETH)
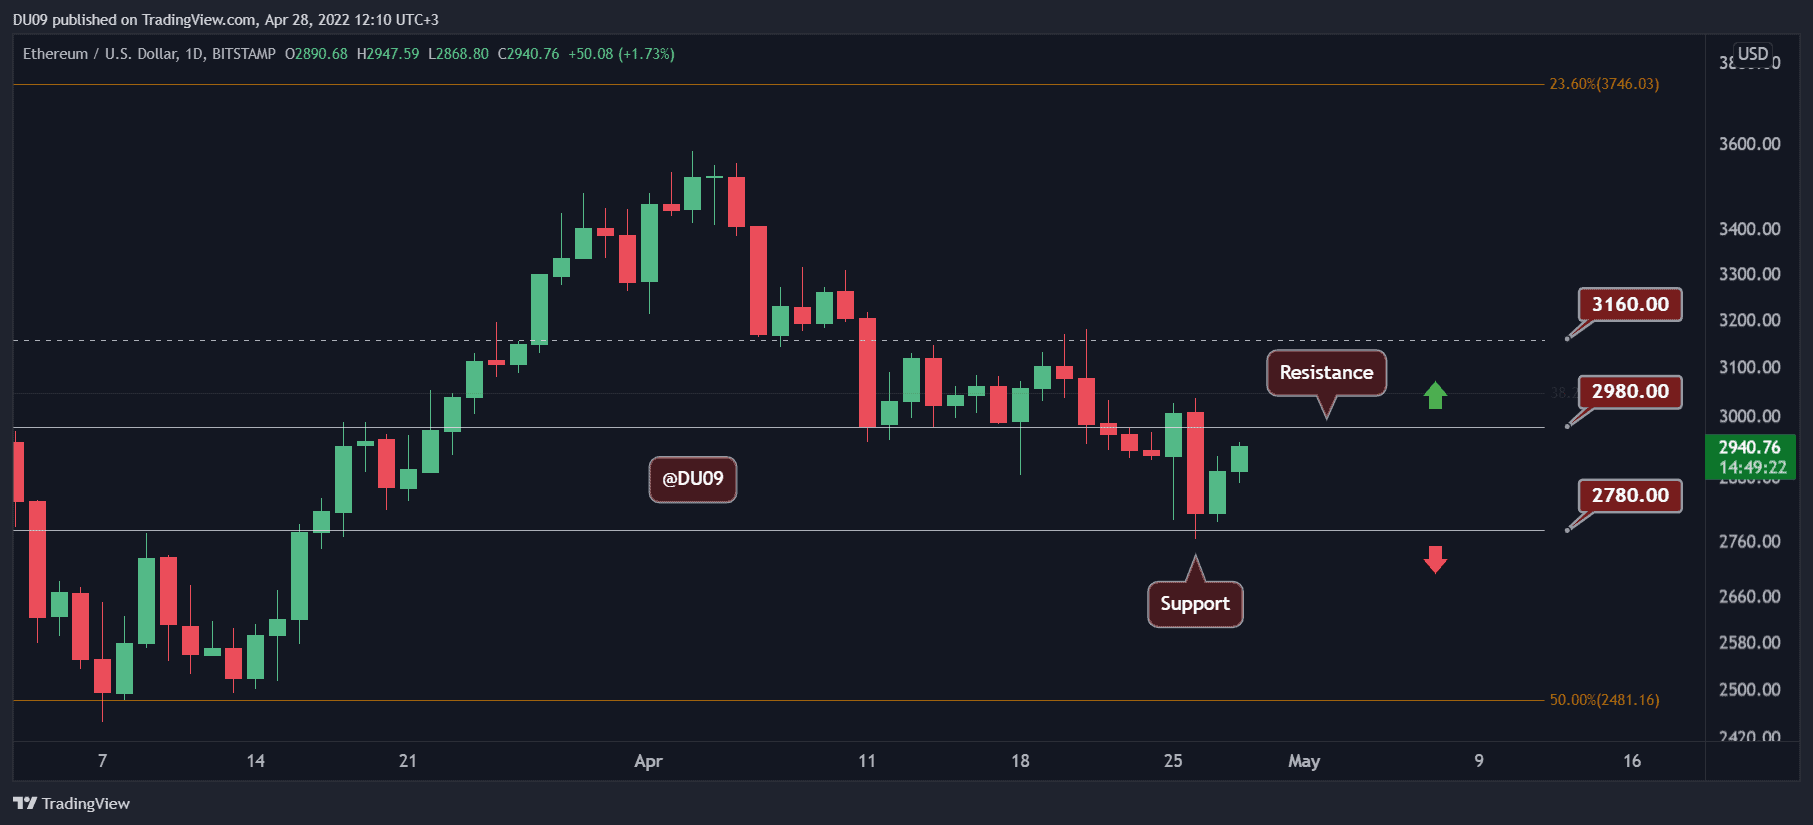
The downtrend continued this week, with ETH making a lower high and lower low. ETH has lost almost 5% of its valuation in the past seven days. The key resistance is found at $3,000, and the price seems keen to break this level. The support is at $2,780.
While on the daily timeframe, the price action continues to be bearish, on the 12 hours, ETH indicators are showing a clear bullish divergence. Both the RSI and the MACD show signs this correction may come to a stop soon. If the MACD crosses to the positive side, then bulls may have a chance to push prices higher.
Looking ahead, a break above the $3,000 resistance level would confirm a change in the trend, particularly if bulls manage to turn this level into support again. At that point, a relief rally could end the current correction. For that to happen, ETH needs to make a higher high closing above $3,200.
Ripple (XRP)
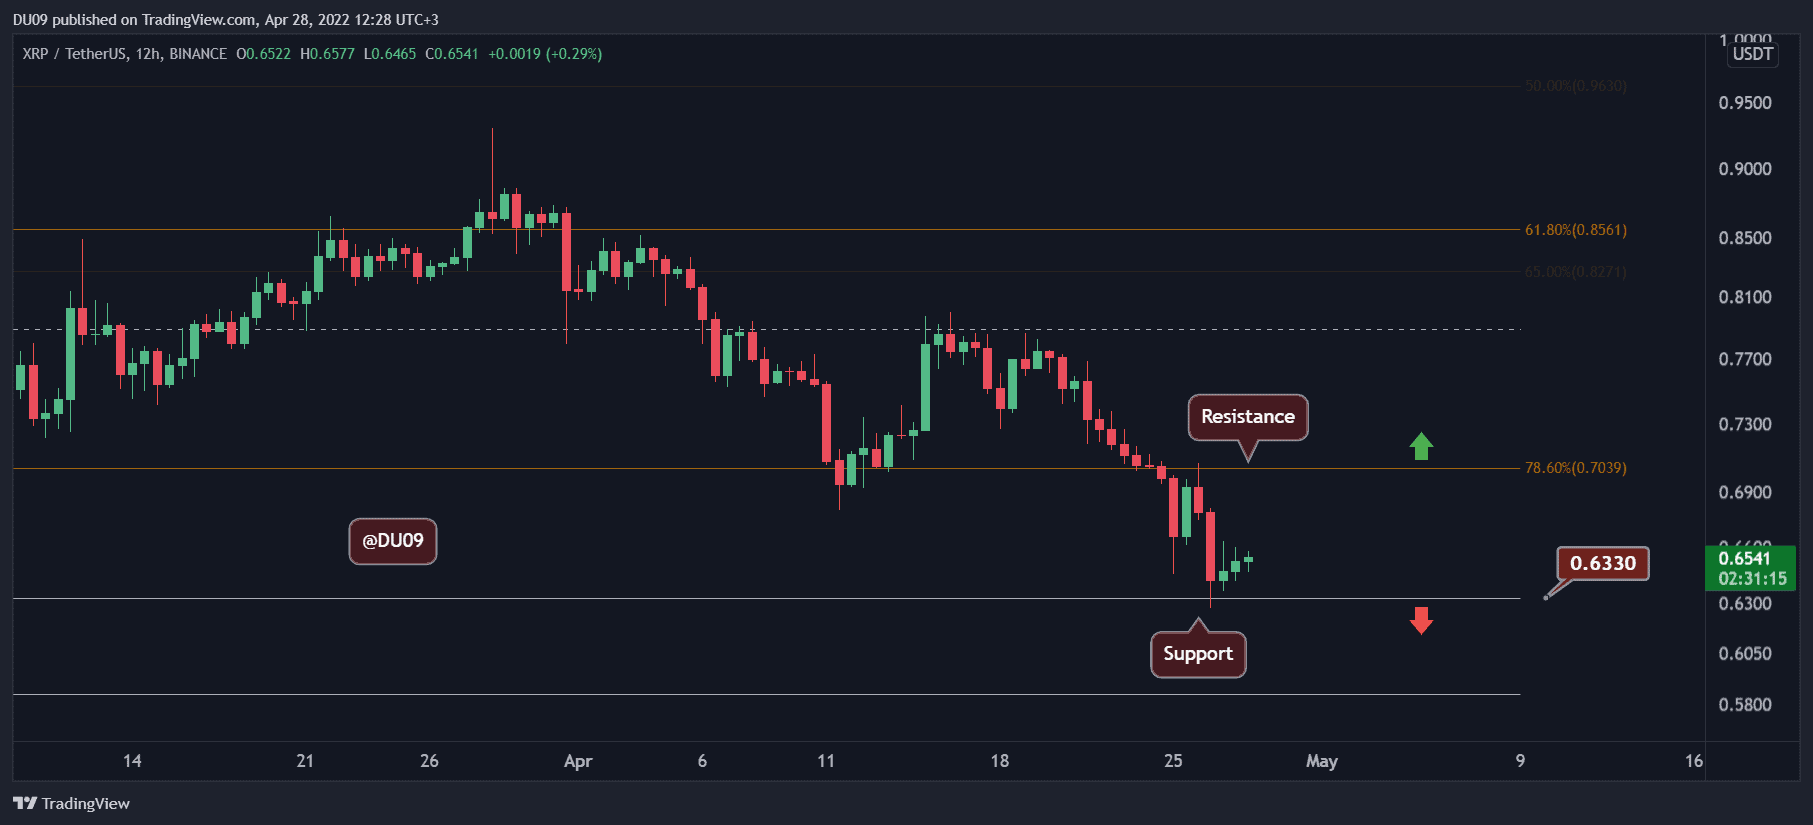
XRP had a terrible week after falling by 13% in the past seven days. It found support at $0.63 and now appears to enter a rally that could take it all the way to the key resistance at $0.70, which used to act as support in early April.
This cryptocurrency is likely to be at the mercy of BTC and the whole crypto market as it was too weak to attempt to hold the selling pressure from this week. There are some early signs that the market may reverse, and XRP gives similar signals on the RSI and MACD indicators.
Moreover, on the daily timeframe, the RSI has reached 30 points, and it is close to oversold conditions. Therefore, even if the downtrend continues, the selling momentum might be coming to an end soon, with a relief rally becoming more and more likely.
Cardano (ADA)
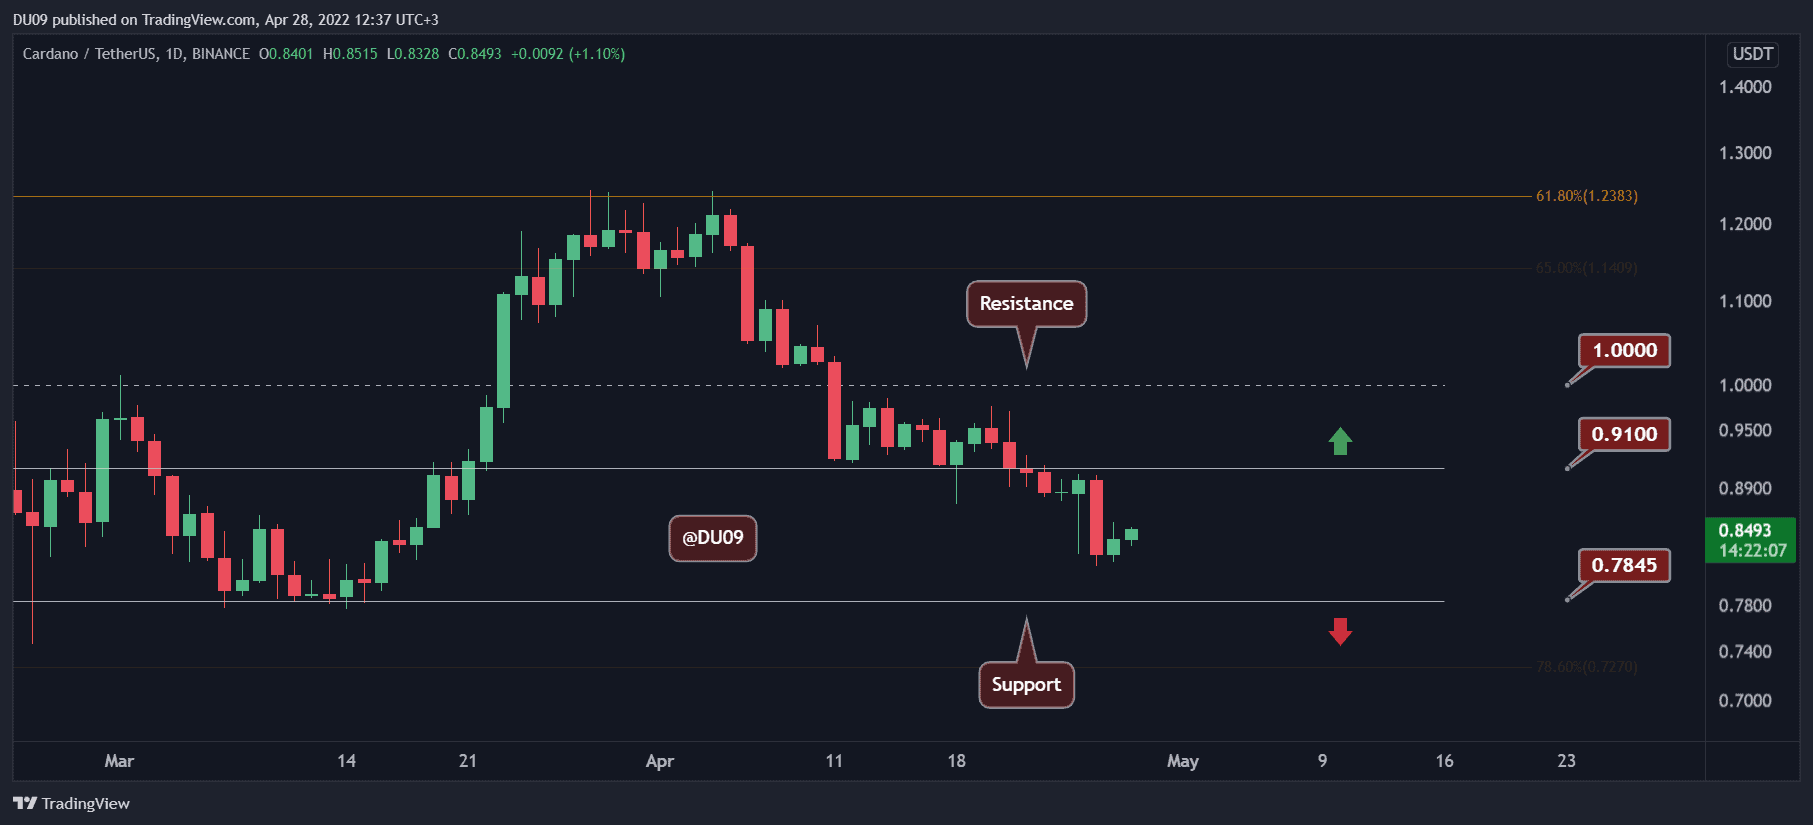
ADA also suffered this week, but not as much as XRP, falling by almost 10% in the past seven days. The price did not hit the key support at $0.78 during this correction, and it may be wise to be patient as ADA may test this level before it can recover. The key resistance is at $0.91.
In the near term, ADA is unlikely to fall below the critical support as the indicators are turning bullish on lower timeframes (under one day). A test of the key support remains possible, particularly as long as the MACD is yet to make a bullish cross.
Despite the current downtrend, ADA appears to be setting the stage for a possible rally, perhaps even as high as $1 – a key psychological level. If reclaimed, the bulls may turn around the narrative and put it back on the uptrend.
Solana (SOL)
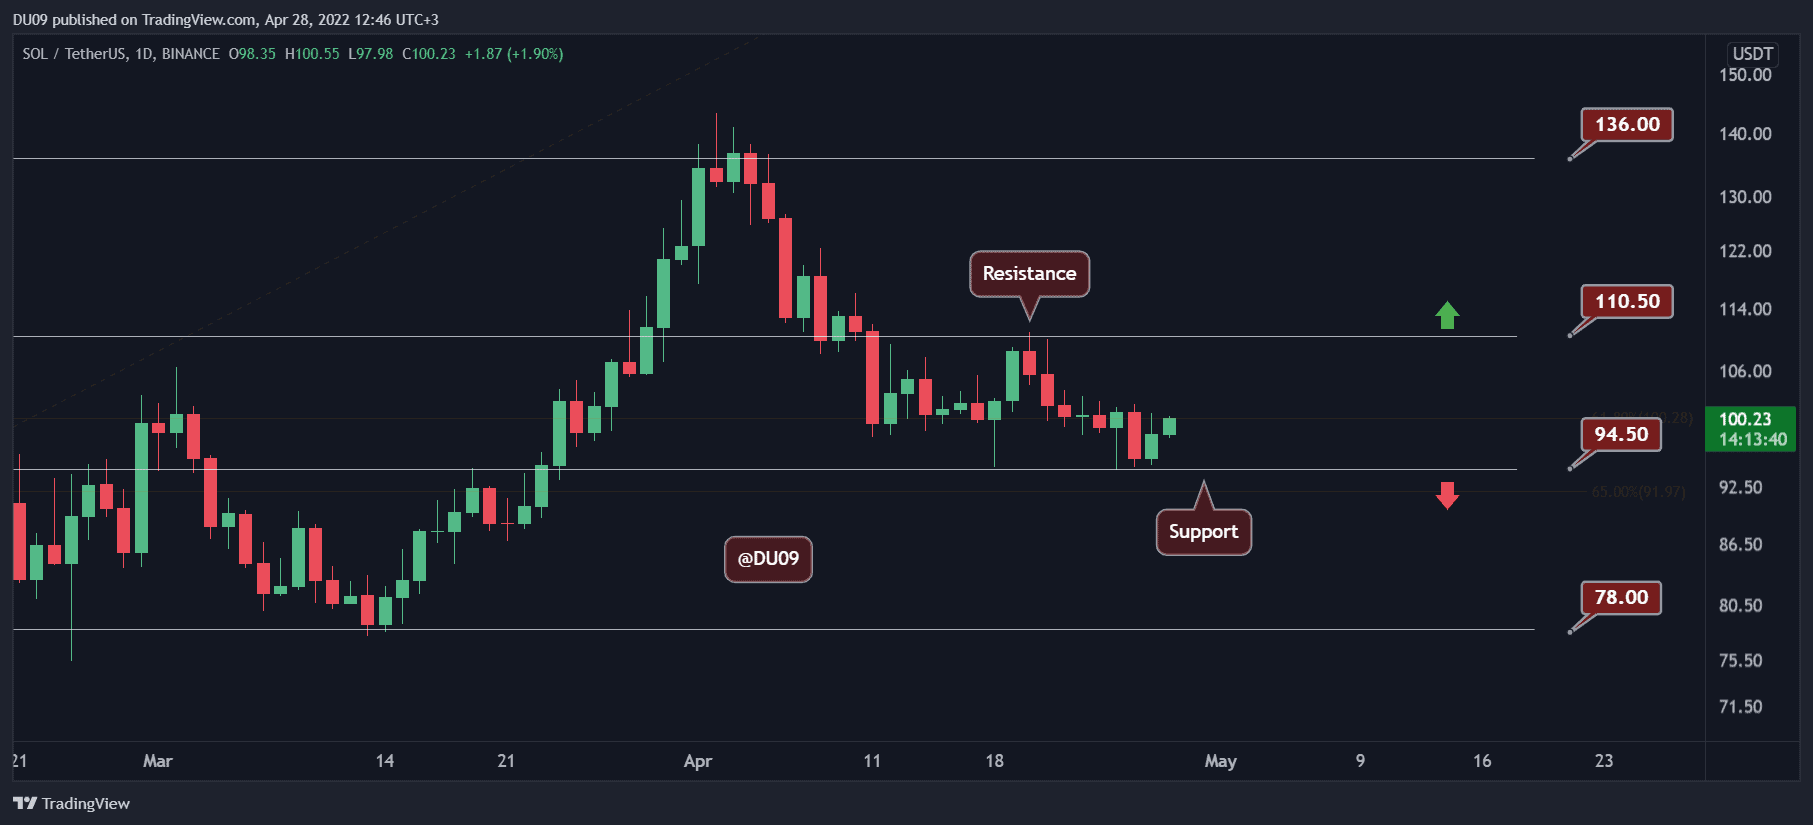
Solana has found good support at $94 and has closed the last daily candle in green. If this continues, then the cryptocurrency could reverse the current downtrend and aim to hit the key resistance at $110. Because of these latest developments, SOL only lost about 5% in the past seven days.
The biggest test for Solana is to maintain a price above $100 and pass the key resistance still ahead. If that is successful, then buyers could even attempt a push higher towards the next resistance at $136.
Looking ahead, Solana is less likely to continue declining as the momentum and sentiment may change in the near future to favor bulls.
Shiba Inu (SHIB)
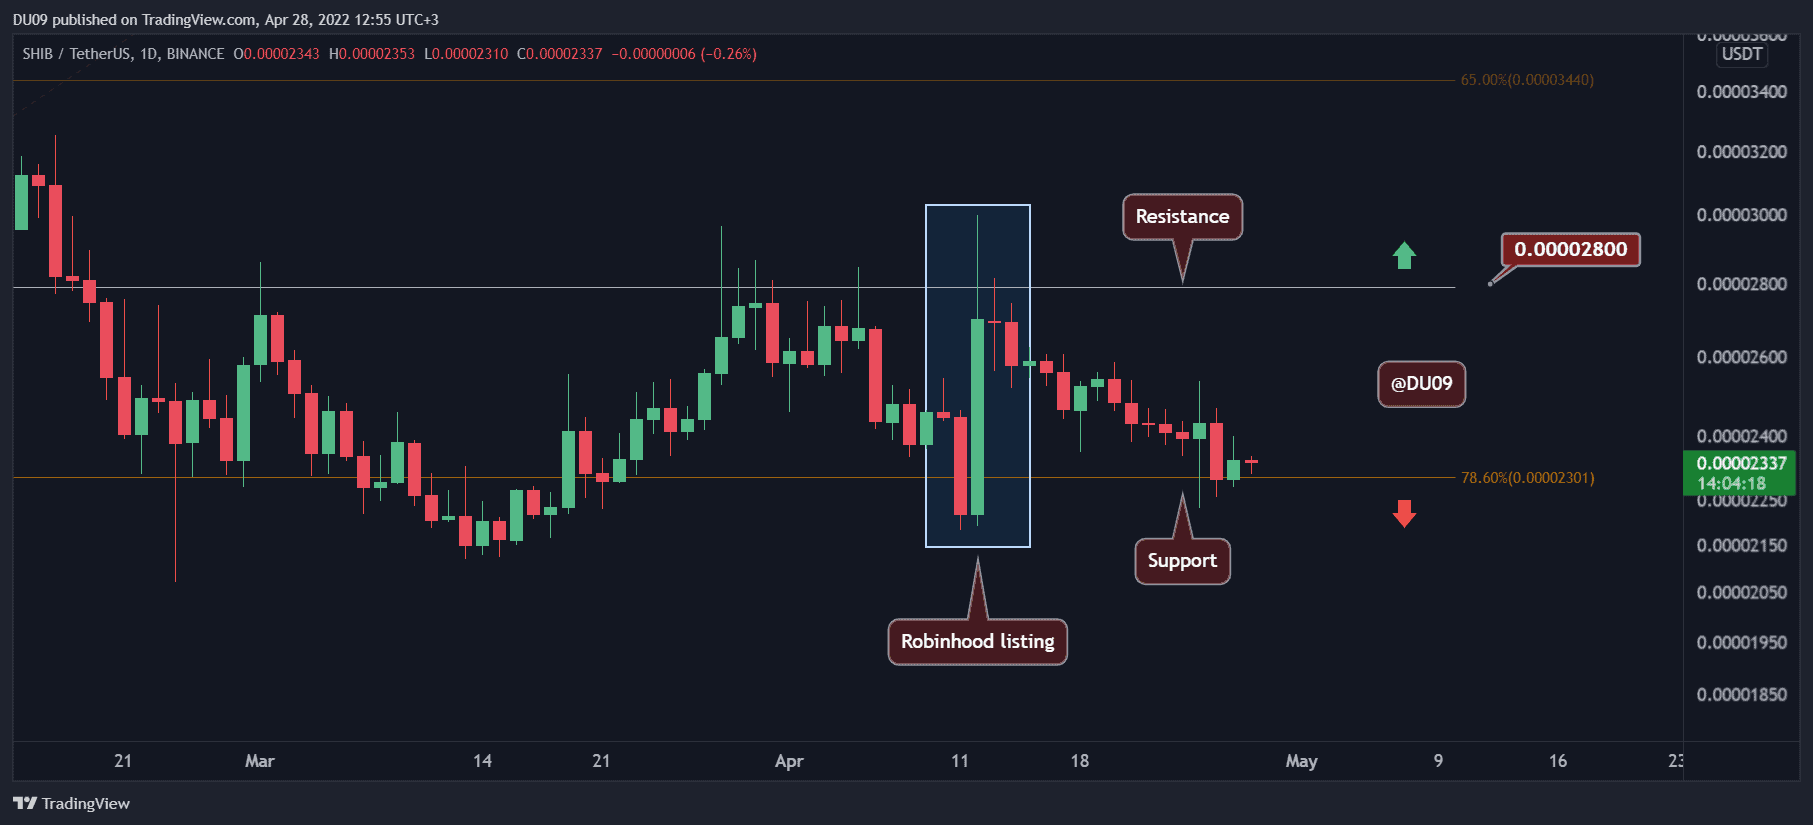
SHIB had a busy April with prices both exploding by 40% in one day (Robinhood listing) and then subsequently crashing back to the key support level at $0.000023, erasing all gains. Overall, SHIB is closing the past week in the red with a 6% loss in price.
It seems the buying momentum was short-lived, and bulls were unable to sustain a price above the key support. The rejection at the $0.000028 resistance was sharp and unlikely to be tested any time soon. The indicators also remain bearish, and SHIB appears worse positioned compared to the above coins, which are more likely to rally in the near term.
Looking ahead, SHIB’s main objective is to hold its price above the key support, as losing that level would put bears back on the offensive.
