Crypto Price Analysis April-1: Ethereum, Ripple, Cardano, Solana, and Shiba Inu
This week, we take a closer look at Ethereum, Ripple, Cardano, Solana, and Shiba Inu.

Ethereum (ETH)
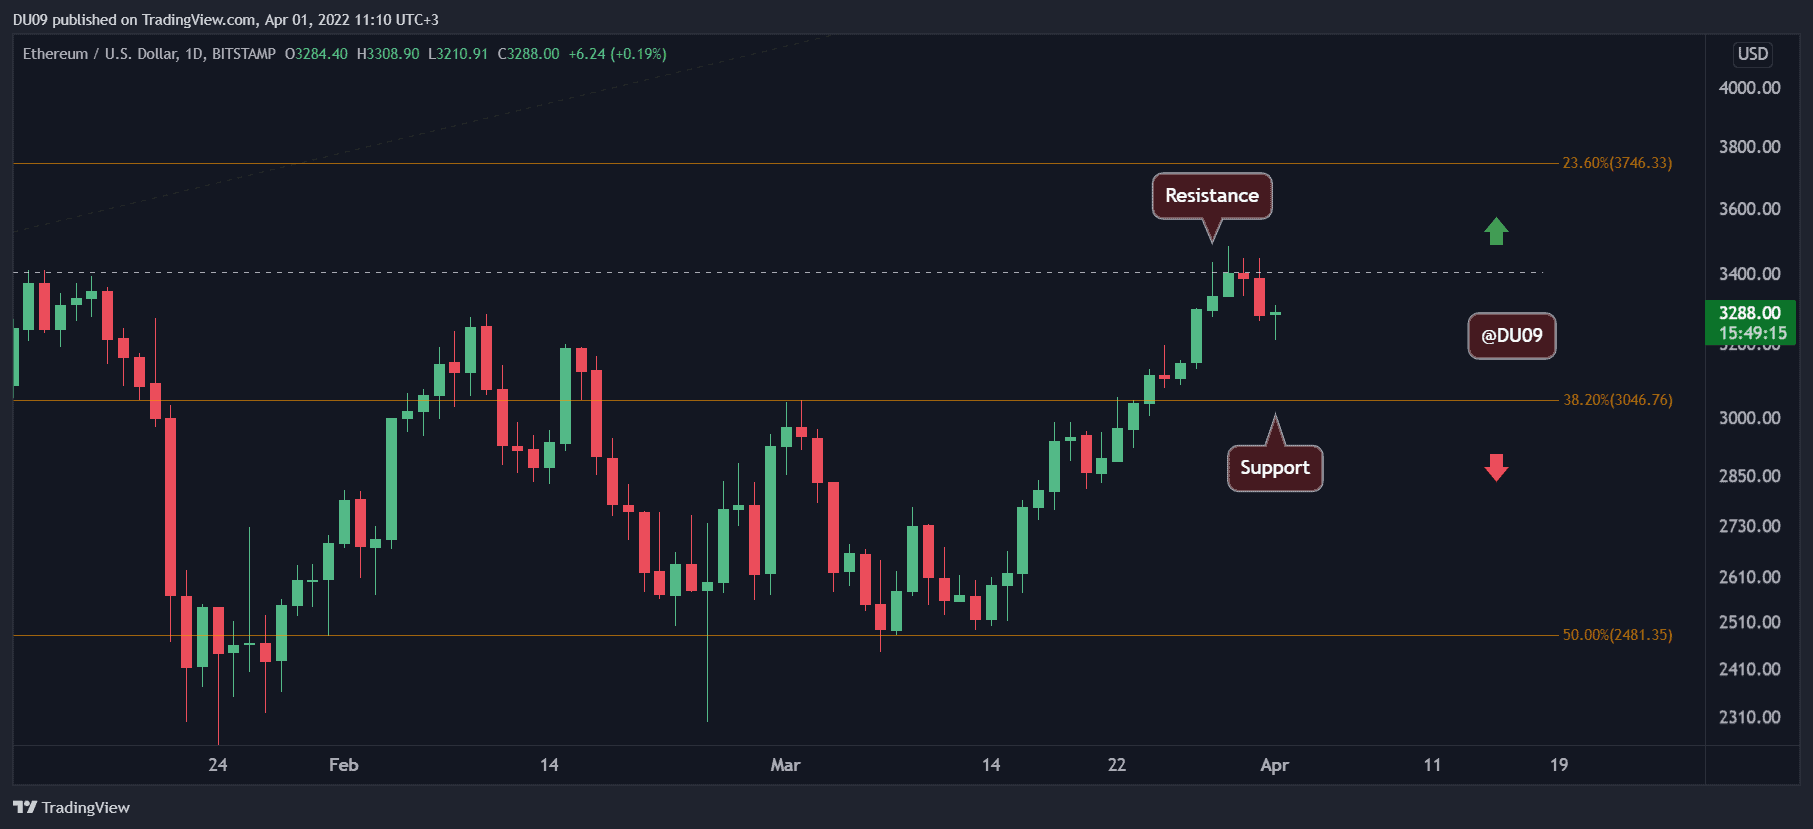
The momentum in the past week has allowed ETH to rally up to $3,400 which is currently acting as a key resistance. Buyers were unable to break this level and now the price is found in a pullback. Despite this, ETH still managed to book a 5.7% price increase in the past seven days.
The support is found at $3,000 and if this pullback turns into a more significant correction, then ETH’s price could fall to this level before buyers become interested again. The indicators, particularly MACD, show a falling histogram on the daily chart. This signals loss of momentum for buyers.
Looking ahead, ETH might have a good chance to test the support at $3,000 before bullish momentum returns. The market became overextended due to the most recent rally and this price action was somewhat expected.
Ripple (XRP)
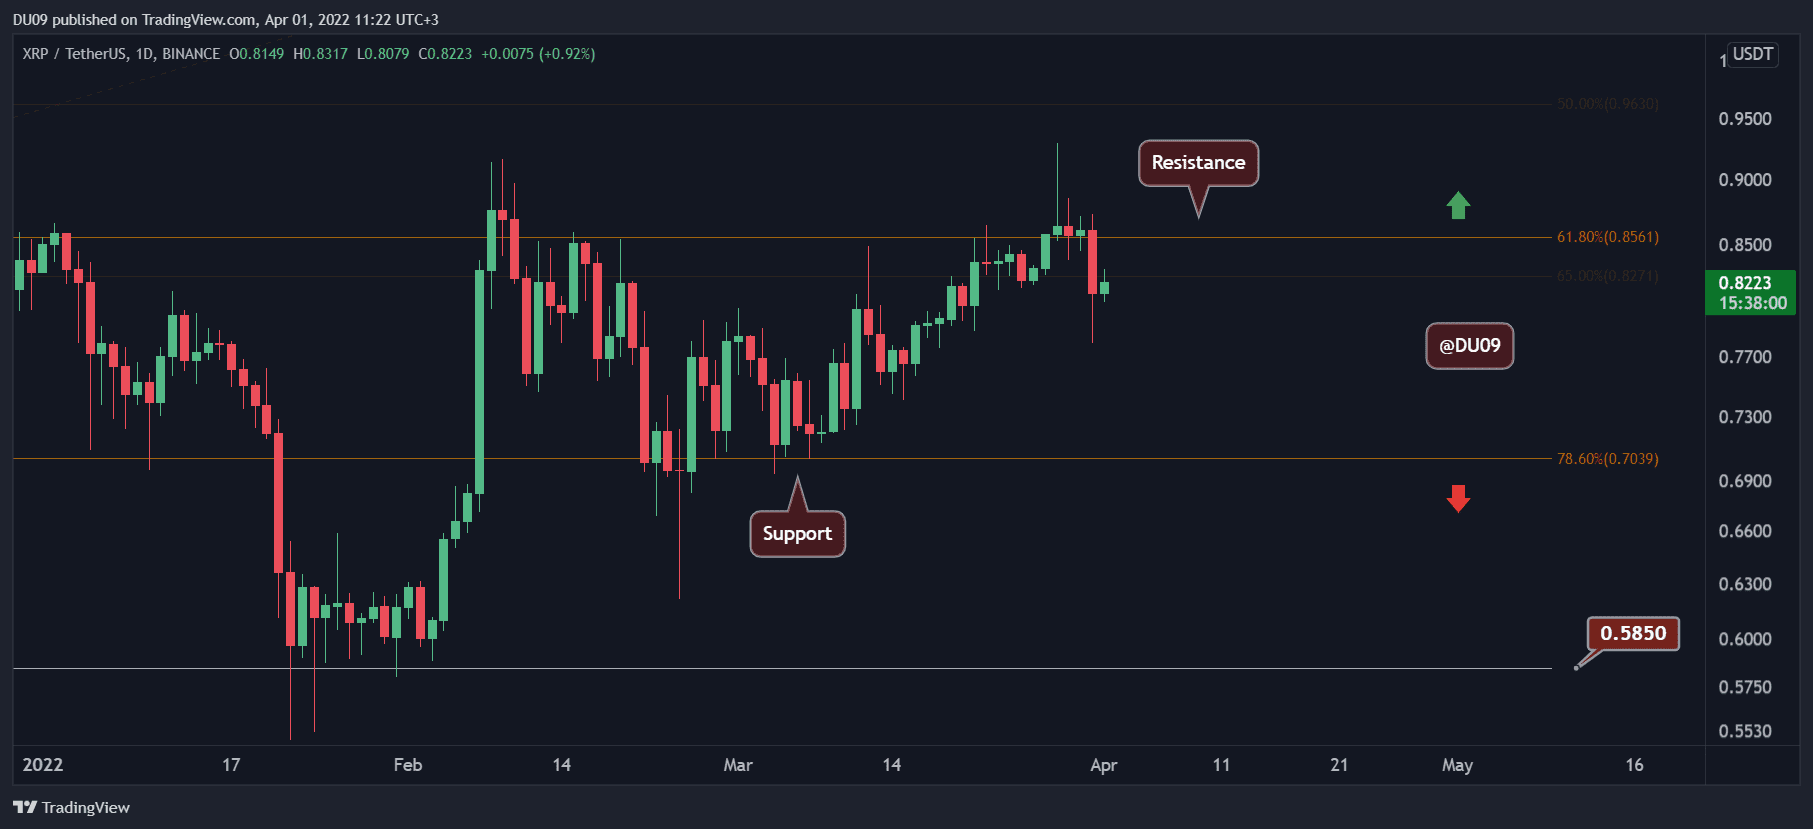
XRP’s price has been facing some stiff resistance at the $0.86 level and after several attempts, buyers still did not manage to break above. Moreover, yesterday the bears pushed the price down to $0.78 which made XRP close the week in red, booking a 2.4% loss.
With support at $0.70, sellers have a lot of work to do until they can hit that level. So far, buyers managed to prevent a major loss in price, but the pressure is mounting. The MACD has completed a bearish crossover yesterday which indicates an end to the most recent rally.
Sellers have an opportunity to take control of the price at this time and push it towards the $0.70 support level. The current shift in momentum favors them.
Cardano (ADA)
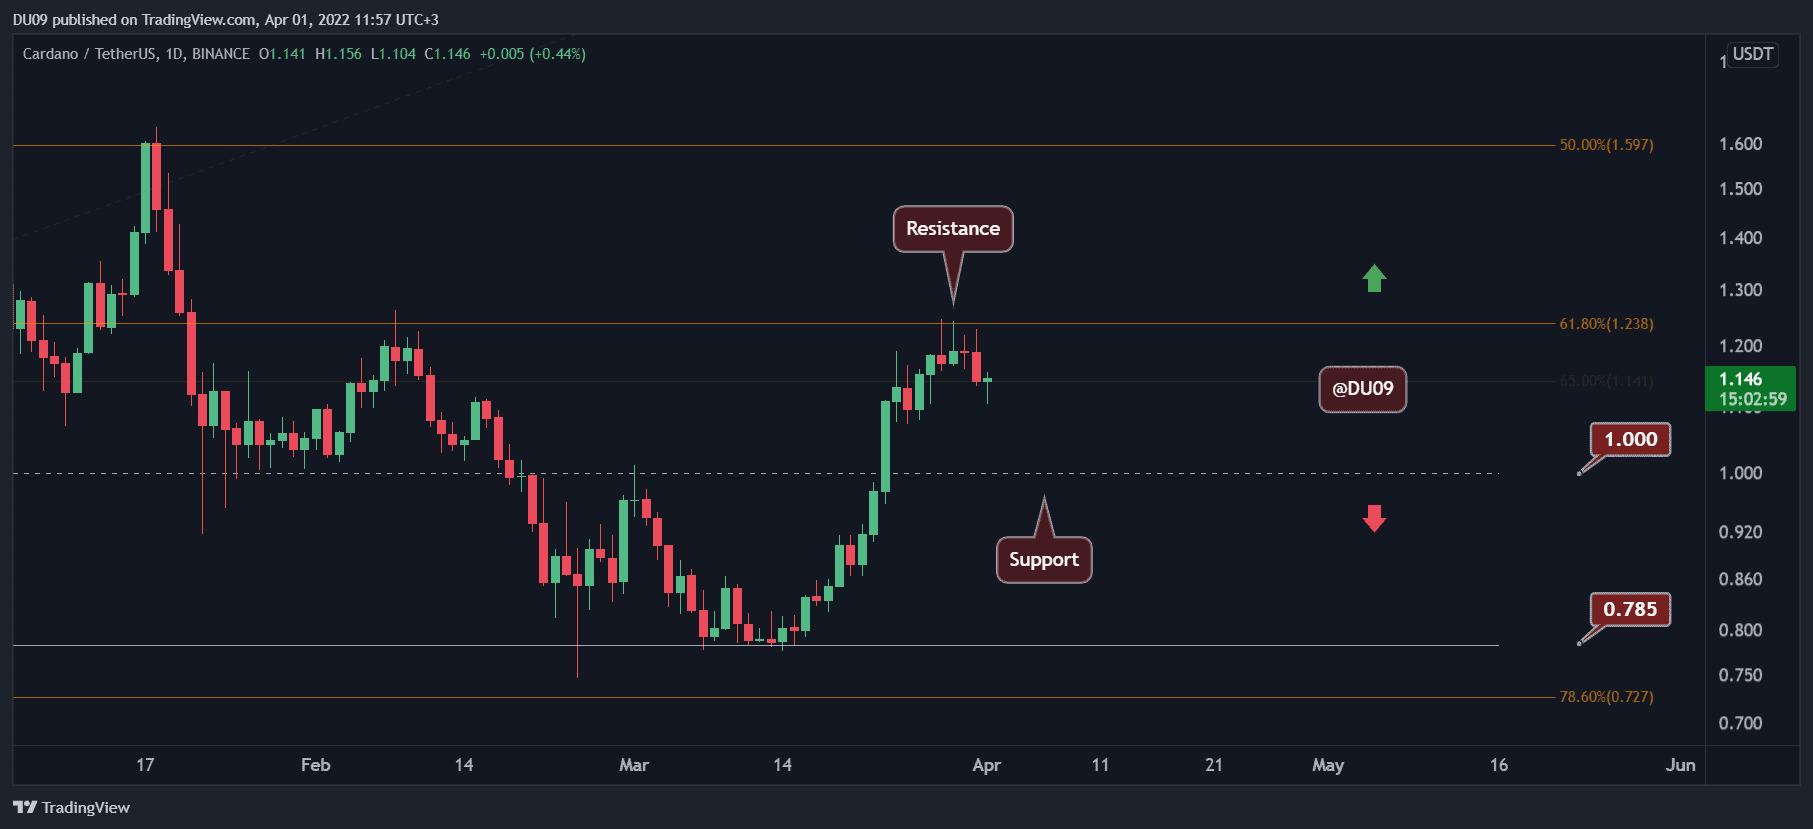
After one of the strongest rallies this year for ADA, the price has faced a hard stop at the $1.2 resistance. For this reason, the overall gains in the past seven days are less impressive and ADA only managed a 2% increase.
As long as the cryptocurrency is unable to move above the key resistance and turn it into support, ADA is likely to enter a consolidation between the $1 support level and current resistance. The indicators remain bullish at this time and with a bit of volume, buyers could return on the offensive.
Looking ahead, Cardano has a good chance to maintain its bullish bias, even if a retest of the key support is likely after the rejection at $1.2.
Solana (SOL)
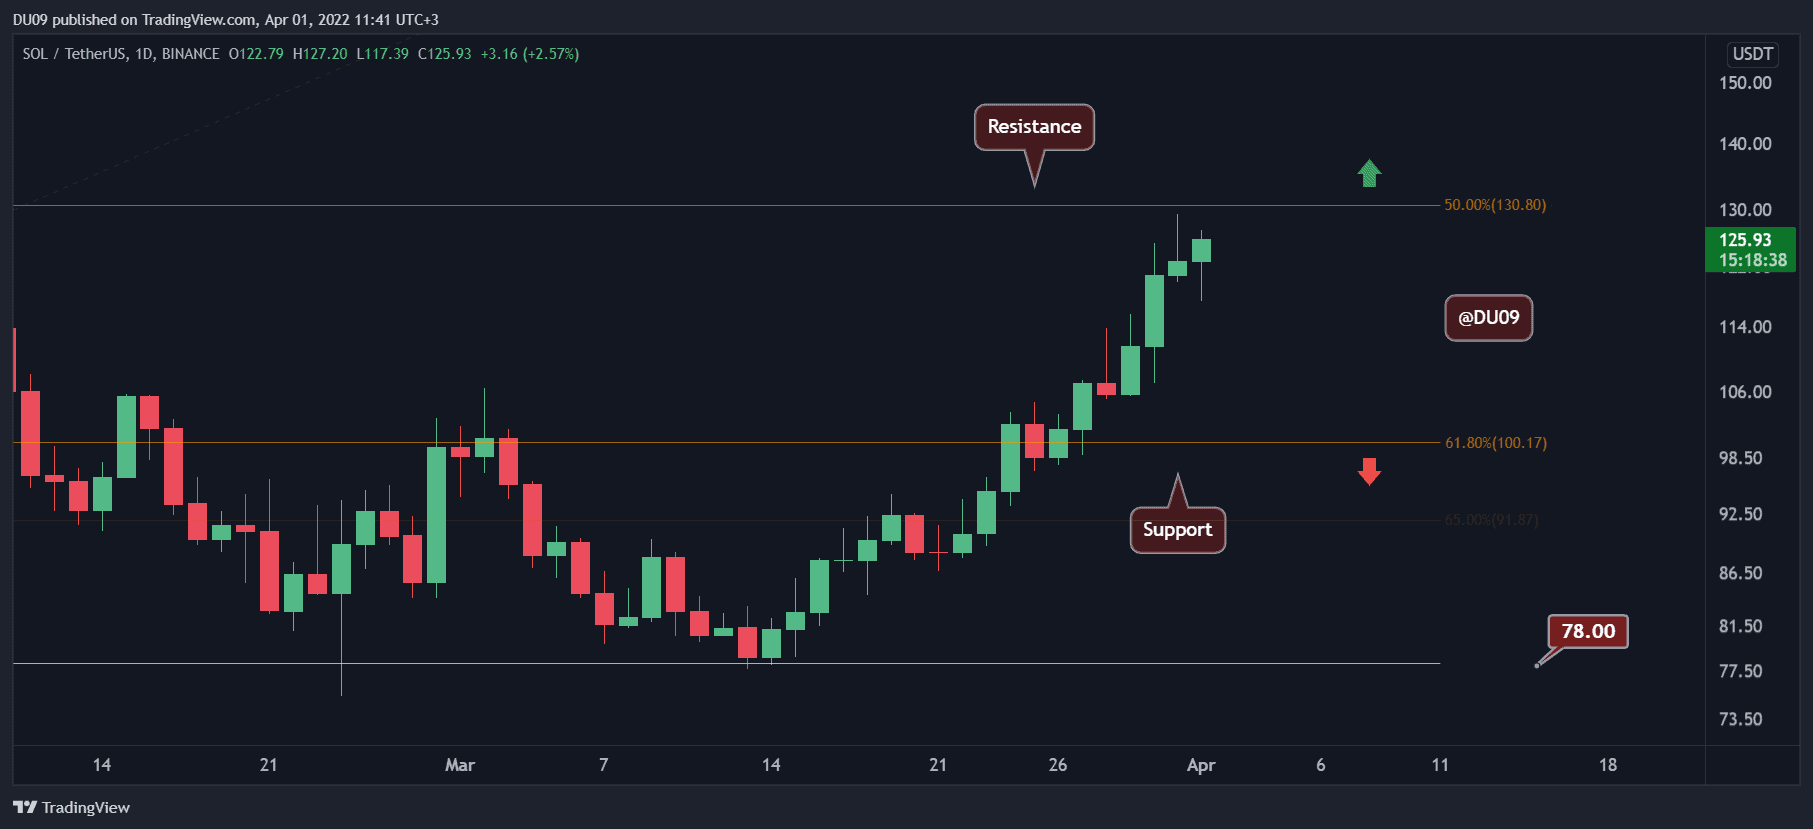
Solana has not stopped surprising us this week, with prices continuing to move higher despite a market pullback. In the past seven days, SOL has registered a 23% price increase.
The bullish momentum remains very strong, but the price is quickly approaching key resistance at $130. The current rally has been ongoing since the 14th of March and the longer it goes the higher the chance that an eventual pullback will occur.
The indicators do not give any signs of weakness right now and the key support is found at $100. This gives buyers a lot of time to position themselves well before a possible correction.
Shiba Inu (SHIB)
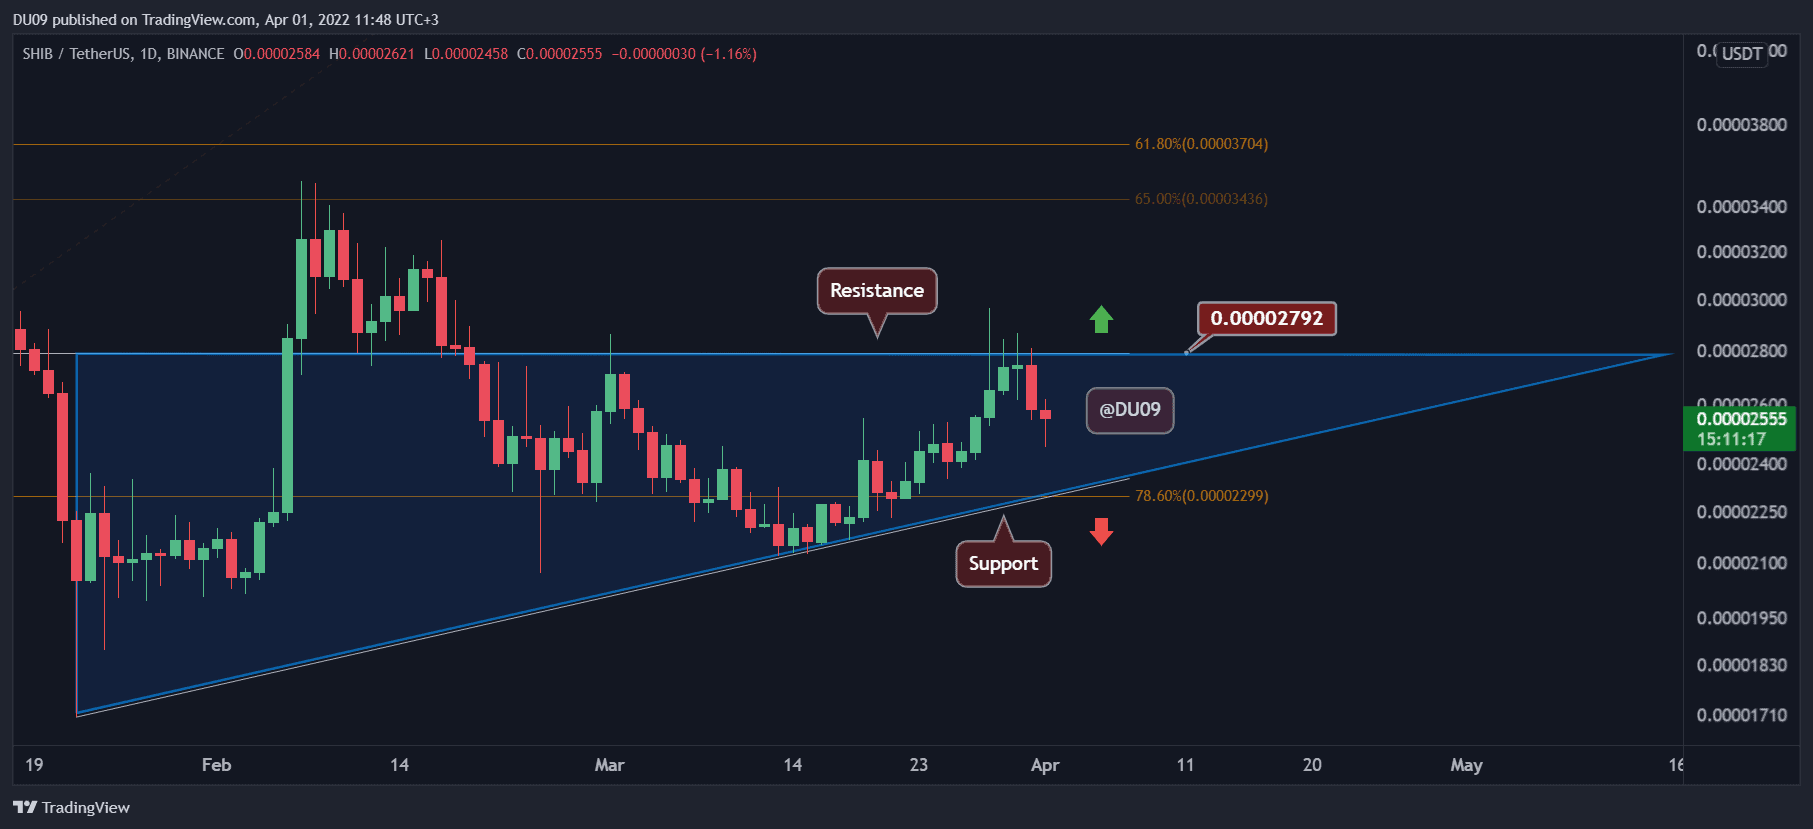
After a fantastic rally, SHIB’s glamor faded this week with price registering only a 4% price increase. This is because the key resistance at $0.000028 stopped it from moving higher. The indicators are also curving down, which may lead to a correction.
The MACD histogram on the daily timeframe shows a major decrease in momentum in the past three days with lower highs. A bearish cross is still some distance away, but market participants should not exclude a possible test of the key support at $0.000023.
Looking ahead, SHIB is likely to consolidate between the key support and resistance that would place price in an ascending triangle which is a bullish pattern. A break above this formation could lead to another major rally.
