Chainlink Price Analysis: LINK Rallies Over 30% in a Week, What’s the Next Target?
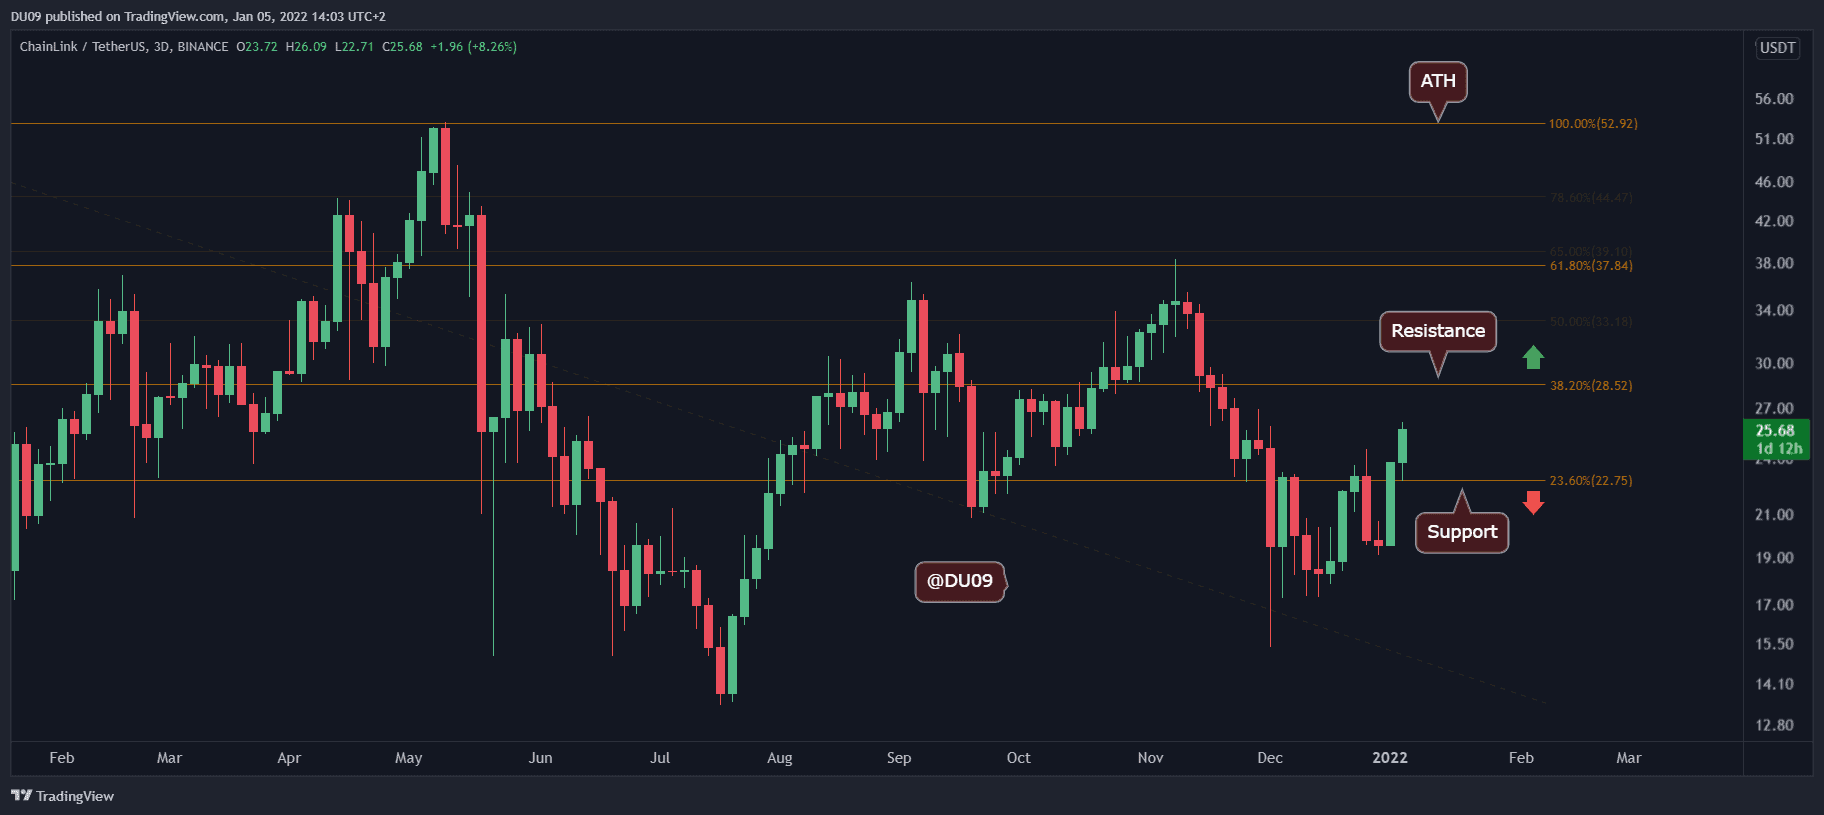
Key Support level: $23
Key Resistance level: $28
After a bullish cross on the daily MACD, LINK entered into a sustained rally with great volume, which has catapulted the price over $20. LINK turned the $23 level into support and is now eying the next key resistance at $28. It is unlikely that LINK can break that level on the first try, but momentum remains strong and favors bulls.

Technical Indicators
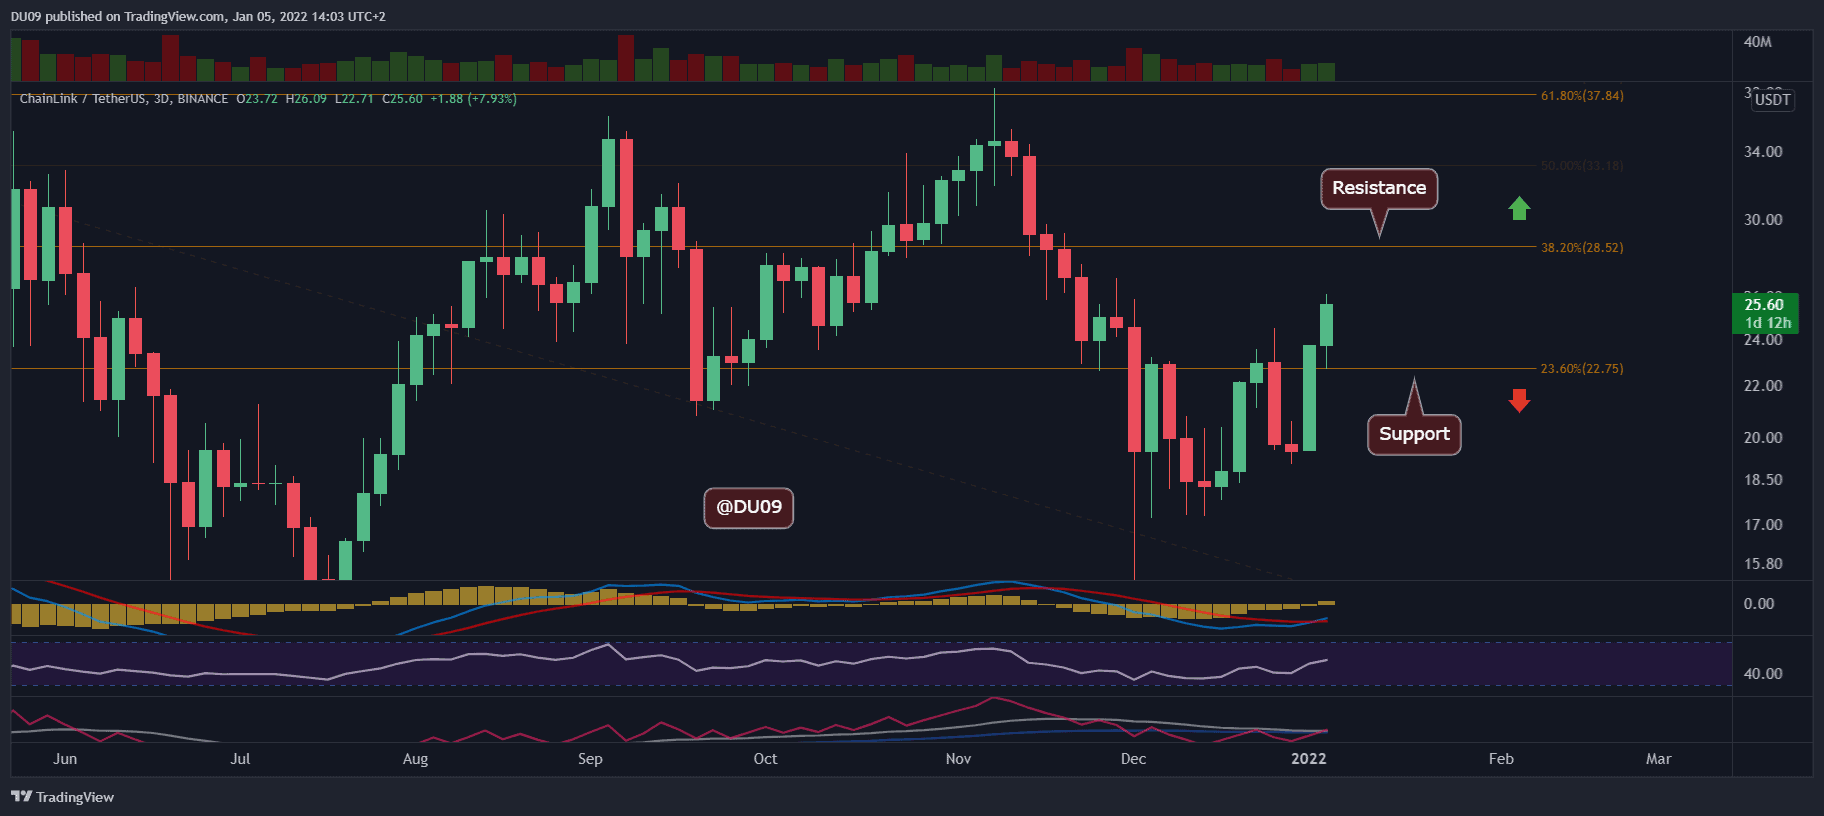
Trading Volume: The sustained volume has put LINK back into the spotlight as the price moved higher. There is no sign of weakness, and the momentum is clearly bullish. This may change as LINK approaches the key resistance.
RSI: The daily RSI is moving higher fast, and at this rate, it can soon enter the overbought zone. This is not a concern right now, but it will become important once the price hits the resistance.
MACD: The daily MACD has been bullish for a while, and now it also completed a bullish cross on the 3-day timeframe. This is significant and may indicate that the cryptocurrency is due for a sustained rally even beyond the current resistance.

Bias
The bias on LINK is bullish. The strong volume and price action support this case.
Short-Term Prediction for LINK Price
LINK managed to surprise the market. The current rally may continue for a while, and the big test will come once the cryptocurrency approaches the key resistance at $28.


