Cardano Tumbles 8% Weekly but How Low Can It Go? (ADA Price Analysis)
Cardano continues to be in a downtrend and it appears to be moving toward a critical support zone once again. How it behaves around it will likely determine the cryptocurrency’s direction going forward.
Key Support levels: $0.35
Key Resistance levels: $0.39
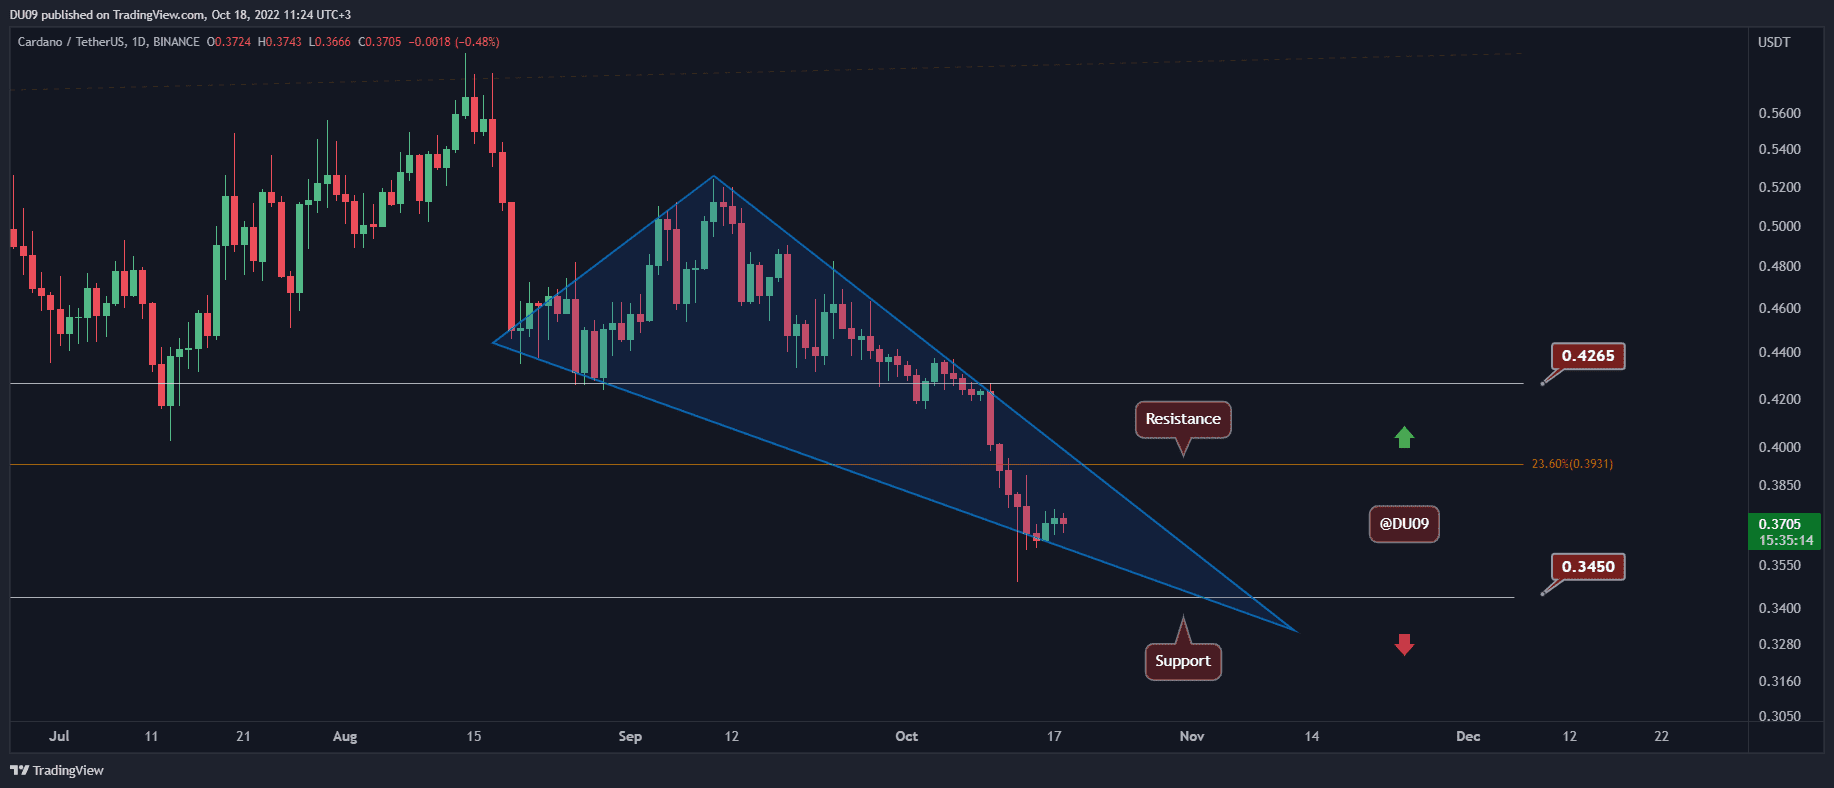
The breakdown that followed ADA’s tumble below $0.43 was severe, and the price managed to find some relief just above $0.35, which is the key support. In the process, the cryptocurrency formed a falling wedge represented in blue below.
The resistance is found at $0.39, and buyers lack the strength to push the price higher at this time.

Technical Indicators
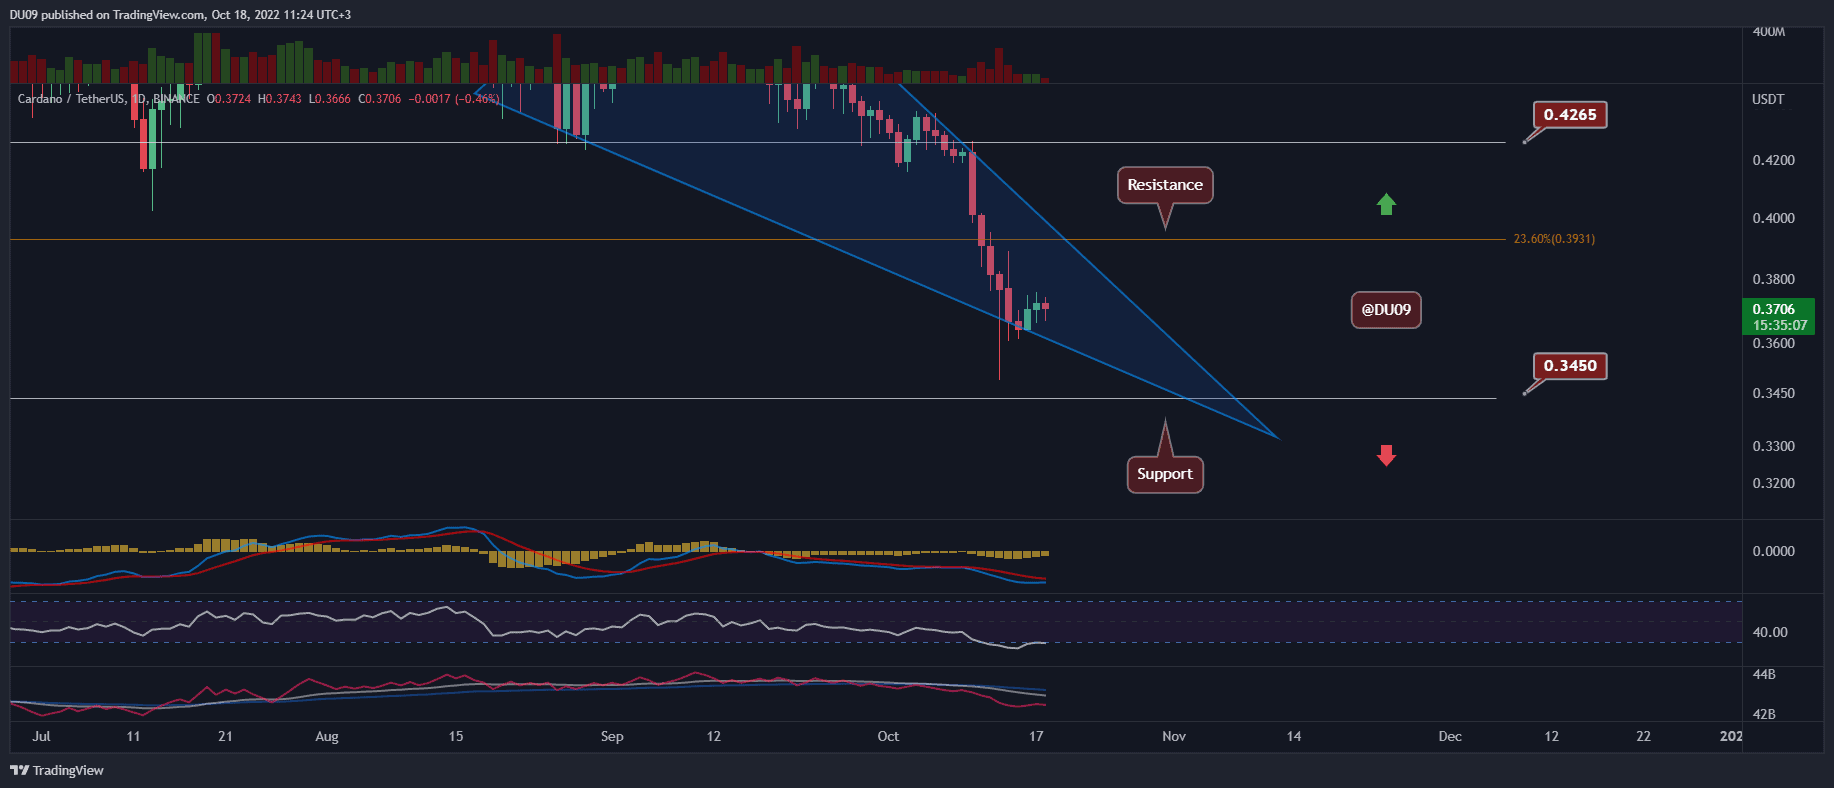
Trading Volume: The volume seems to be increasing as the price is going down, which is bearish. The current action is a textbook example.
RSI: The daily RSI is oversold and sits under 30 points. To date, buyers were unsuccessful to move away from this area.
MACD: The daily MACD is bearish, but the price appears to hold above the key support. However, this may not last.

Bias
The bias for ADA is bearish.
Short-Term Prediction for ADA Price
ADA’s price action shows a lot of weakness, and if buyers fail to return on the offensive, they will likely lose the key support at $0.35. So far, the best they could achieve was to temporarily halt the selloff. At this point, however, it appears that it’s more likely that the market will explore lower prices if something doesn’t change soon.
The post Cardano Tumbles 8% Weekly but How Low Can It Go? (ADA Price Analysis) appeared first on CryptoPotato.


