Cardano Struggling Below $1, Here’s What’s Next (ADA Price Analysis)
The crypto market, which has been highly correlated with the performance of US stocks recently, managed to recover some losses after global markets opened green yesterday. Will this propel Cardano to break the important resistance at $1?
Technical Analysis
By Grizzly
The Daily Chart:

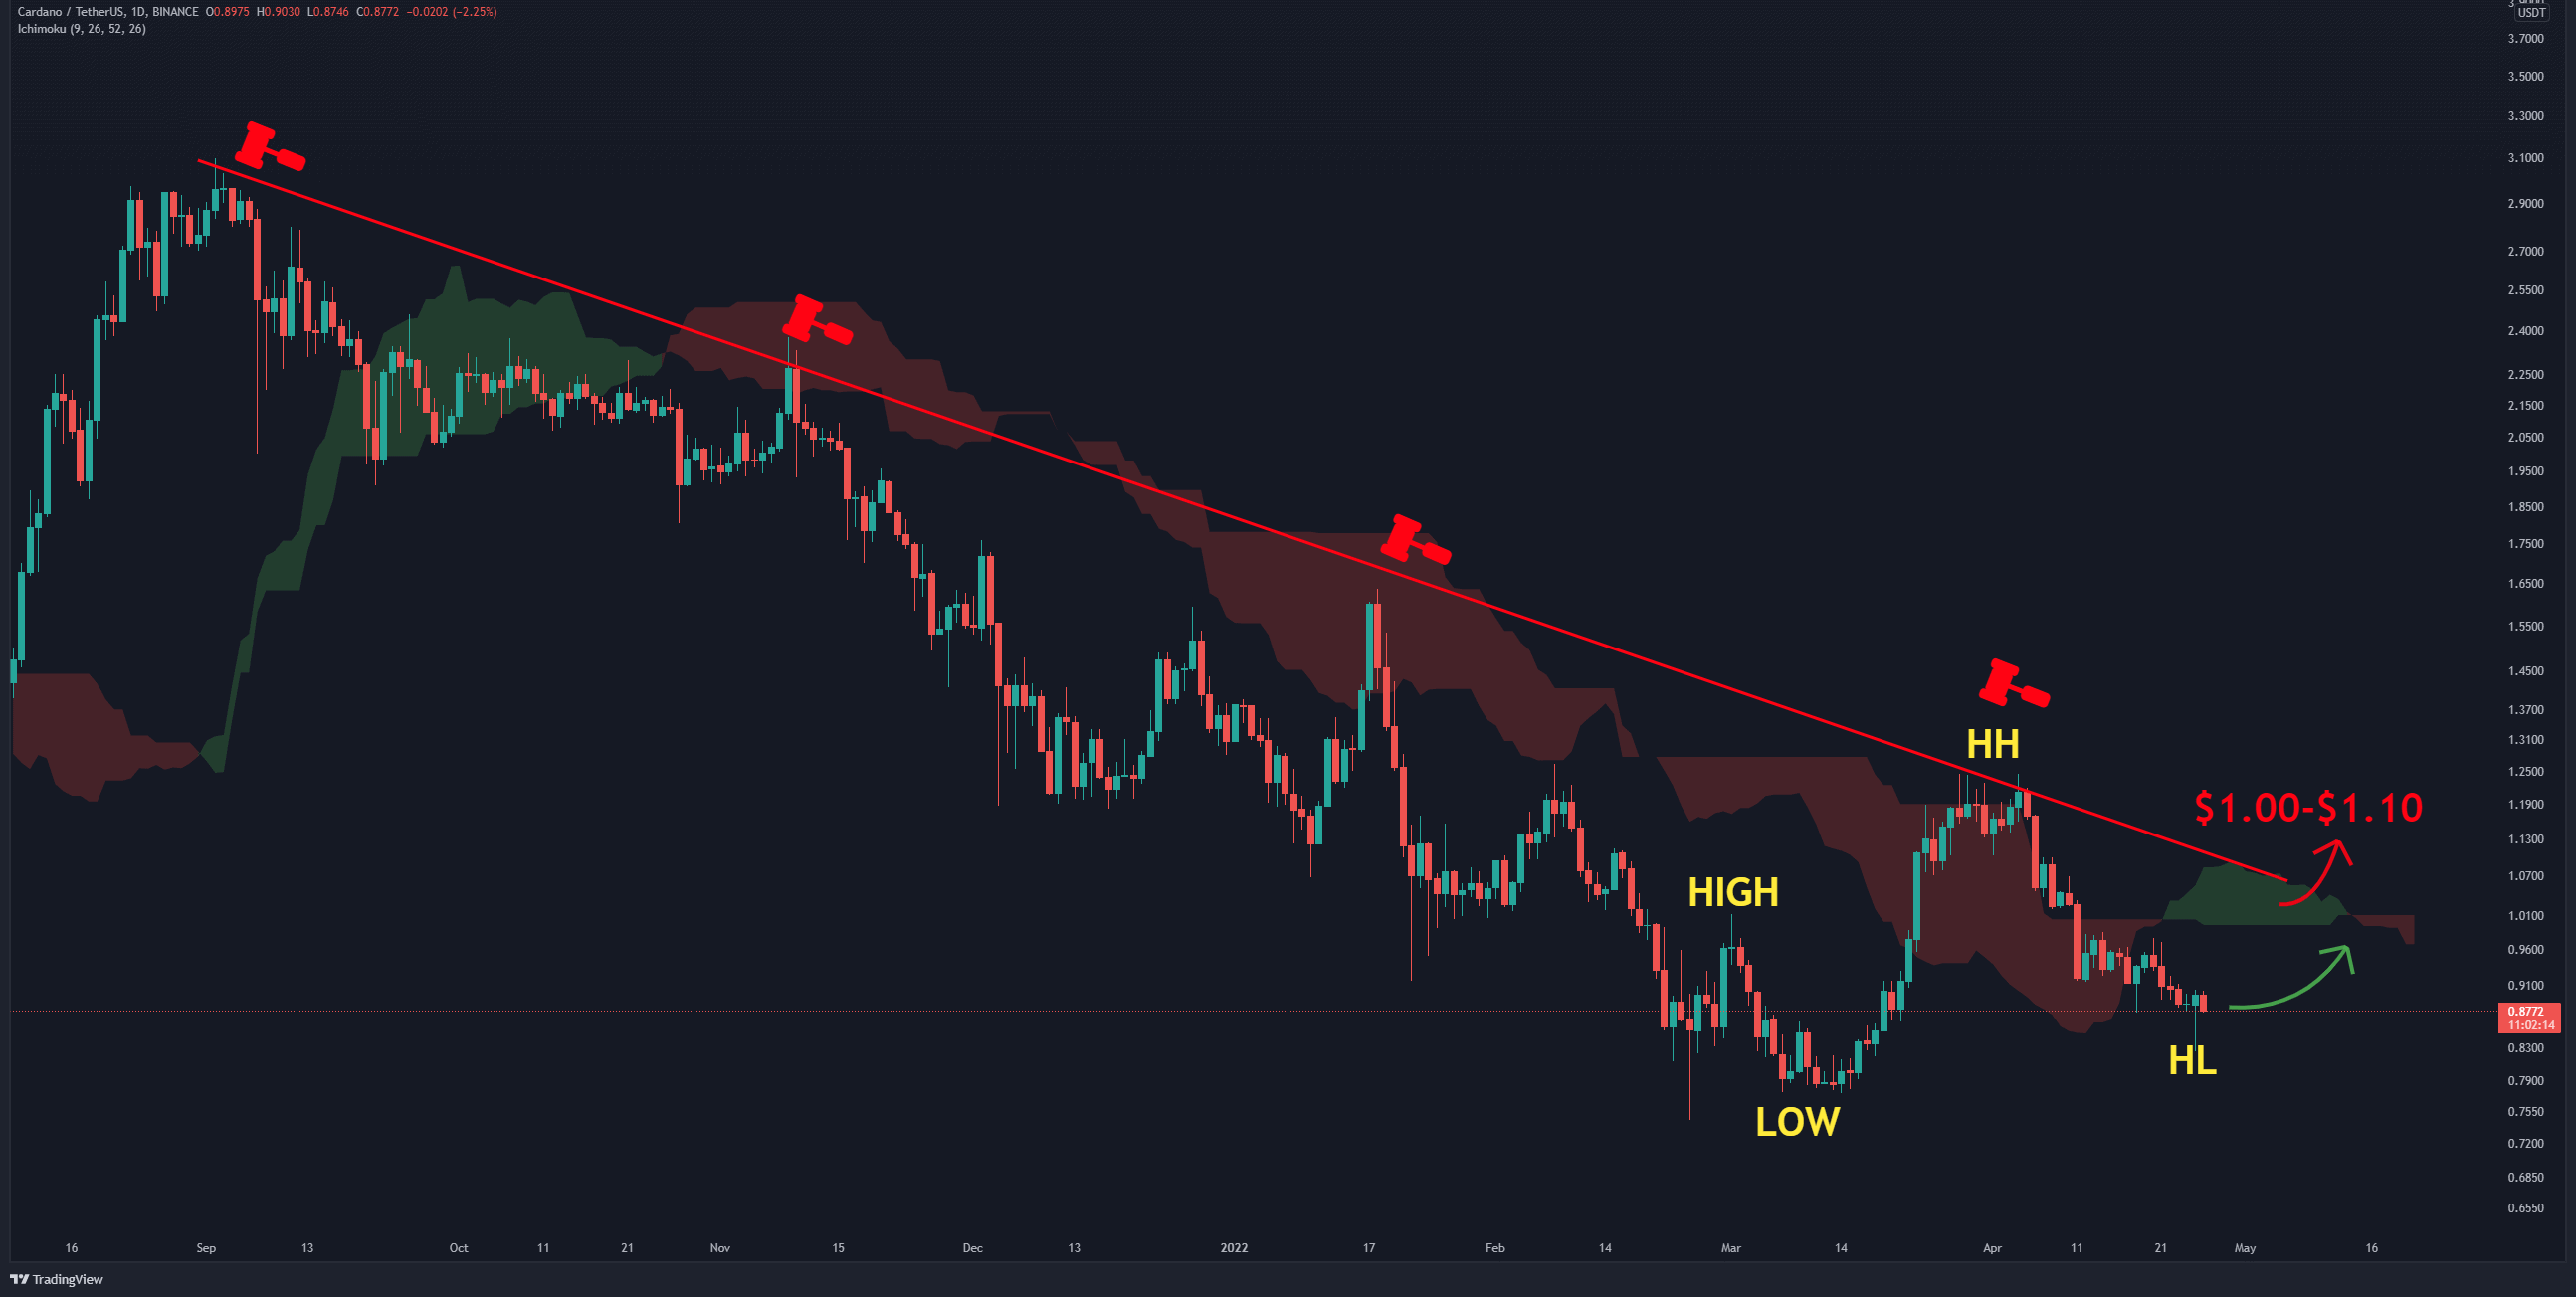
On the daily timeframe, the ADA price failed to break above the dynamic resistance again (marked red), and the bears pushed it down by 33%, causing the critical level at $1 to be lost.
Currently, the horizontal support at $0.82 has prevented further losses. The movement structure is such that the price is forming a bullish pattern as higher highs and higher lows represent signs of a reversal. But the main challenge is to break the resistance in the range of $1-$1.1, and if the bulls can take back this level, then it would be easier to determine that the downtrend is coming to an end. Otherwise, the support at $0.77 may be retested.
RSI 30d indicator and MACD are moving in the bearish zone.
Moving Averages:
MA20: $0.95
MA50: $0.97
MA100: $1.01
MA200: $1.35
Exchange Orderbook Analysis
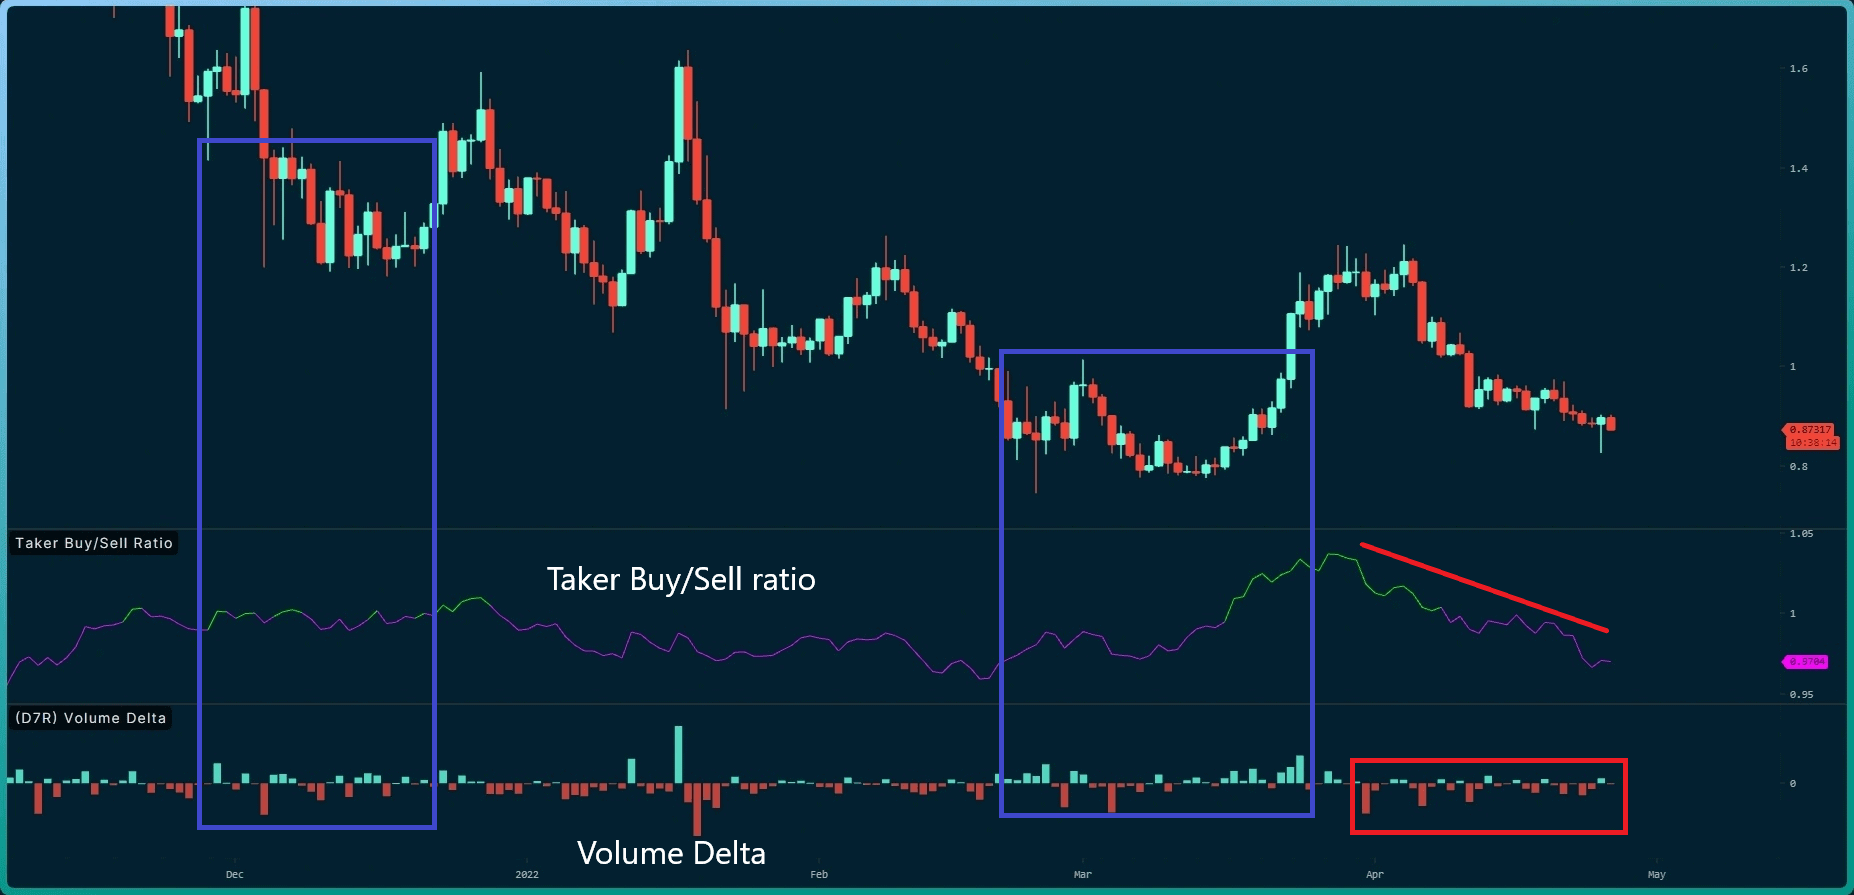
The comparison between buyer and seller takers and the volume delta shows that the sellers have the upper hand in this area.

In the zones marked with a blue rectangle, the upward trends (even temporary) have been accompanied by an increase in the strength of the buyer takers. At the moment, the strength of seller takers is gradually diminishing. However, it seems that it is still not enough.
On-chain Analysis
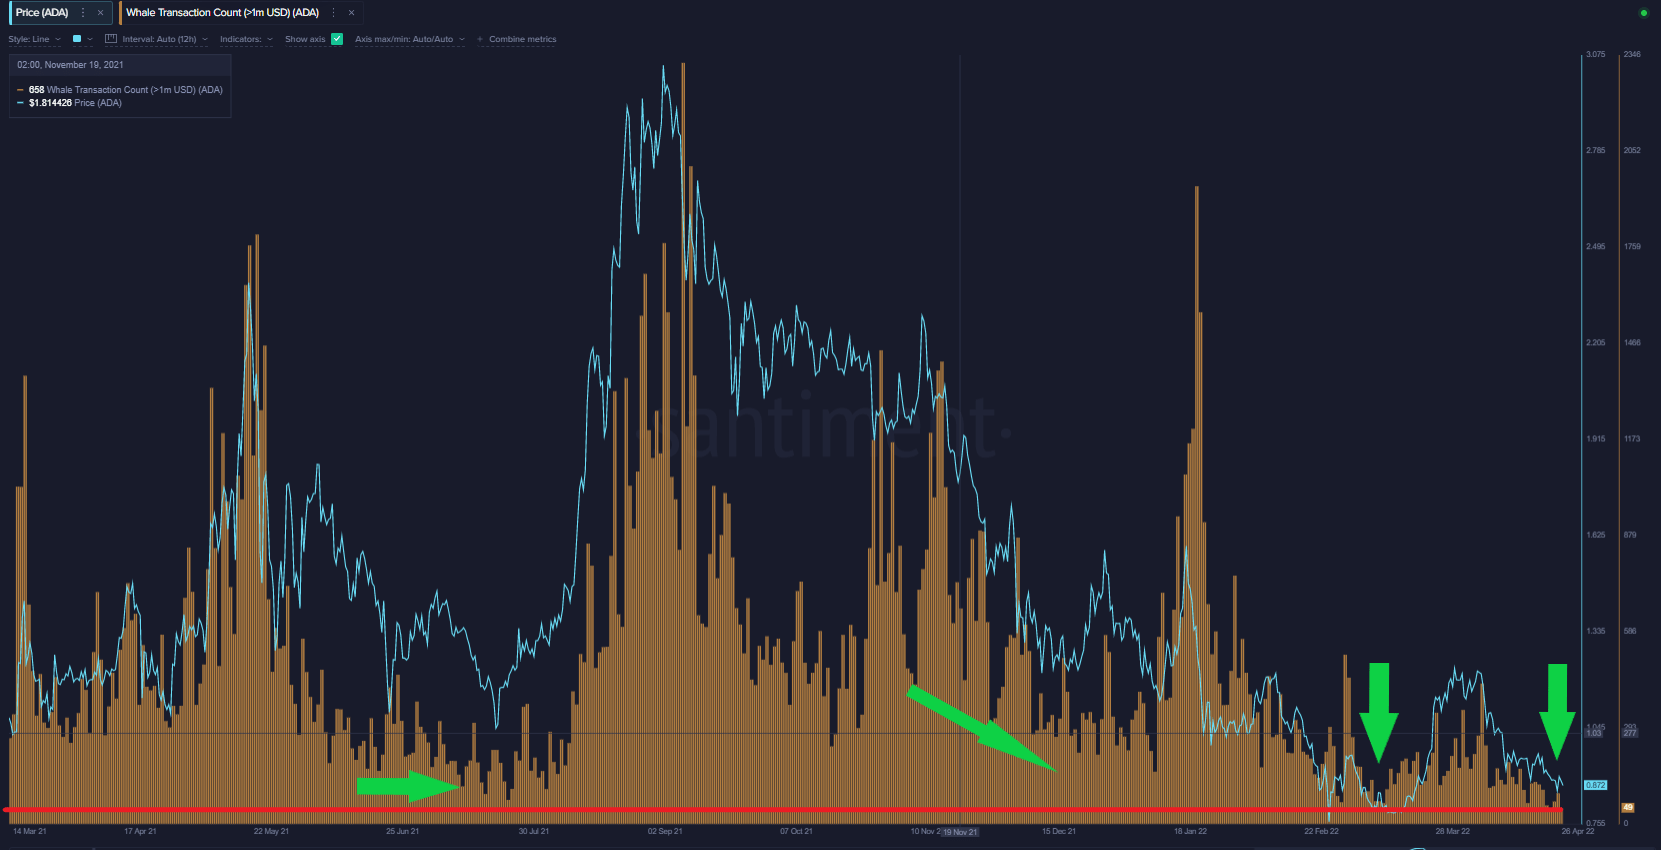
The whale transaction count is above 1M, and it indicates the number of transactions transferring more than 1m USD.

This metric has reached its lowest level in recent years and shows that whales are less inclined to move their coins, indicating a local bottom.


