Cardano Spikes 4% in a Day, but Is The Worst Over? (ADA Price Analysis)
After making a lower low in December, Cardano surprised the market in the new year by opening in green.
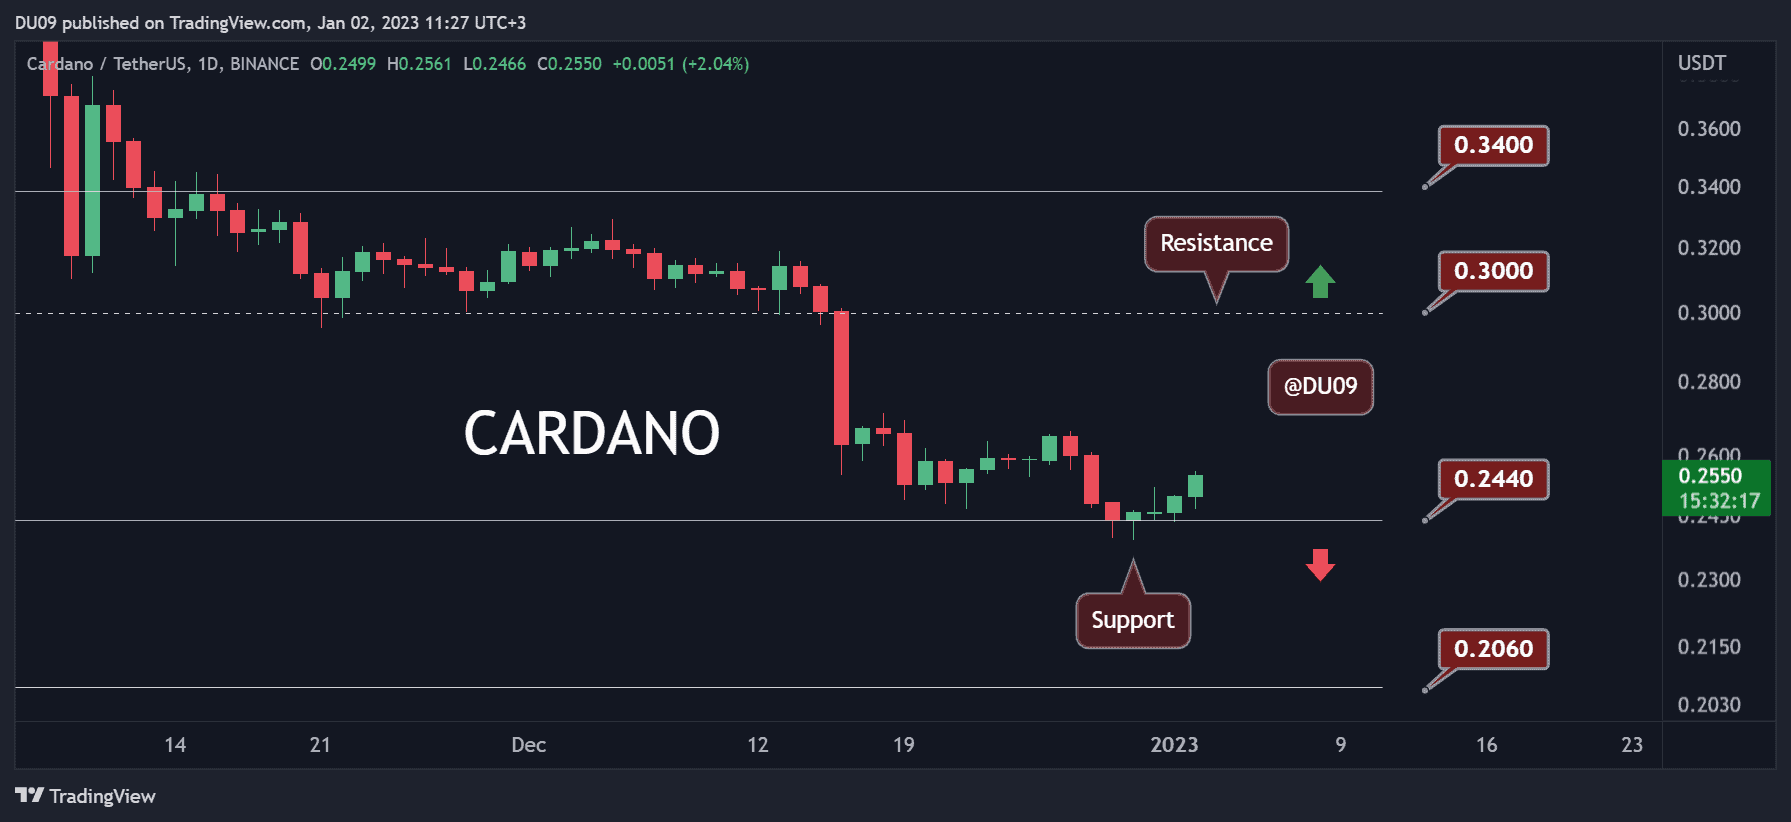
Key Support levels: $0.24, $0.20
Key Resistance levels: $0.30, $0.34
Optimism is building up as Cardano seems to have found good support at $0.24. Since the start of 2023, ADA is in green and does not appear to be looking back. If this momentum continues then, this cryptocurrency could even target $0.30, which is the next key resistance.

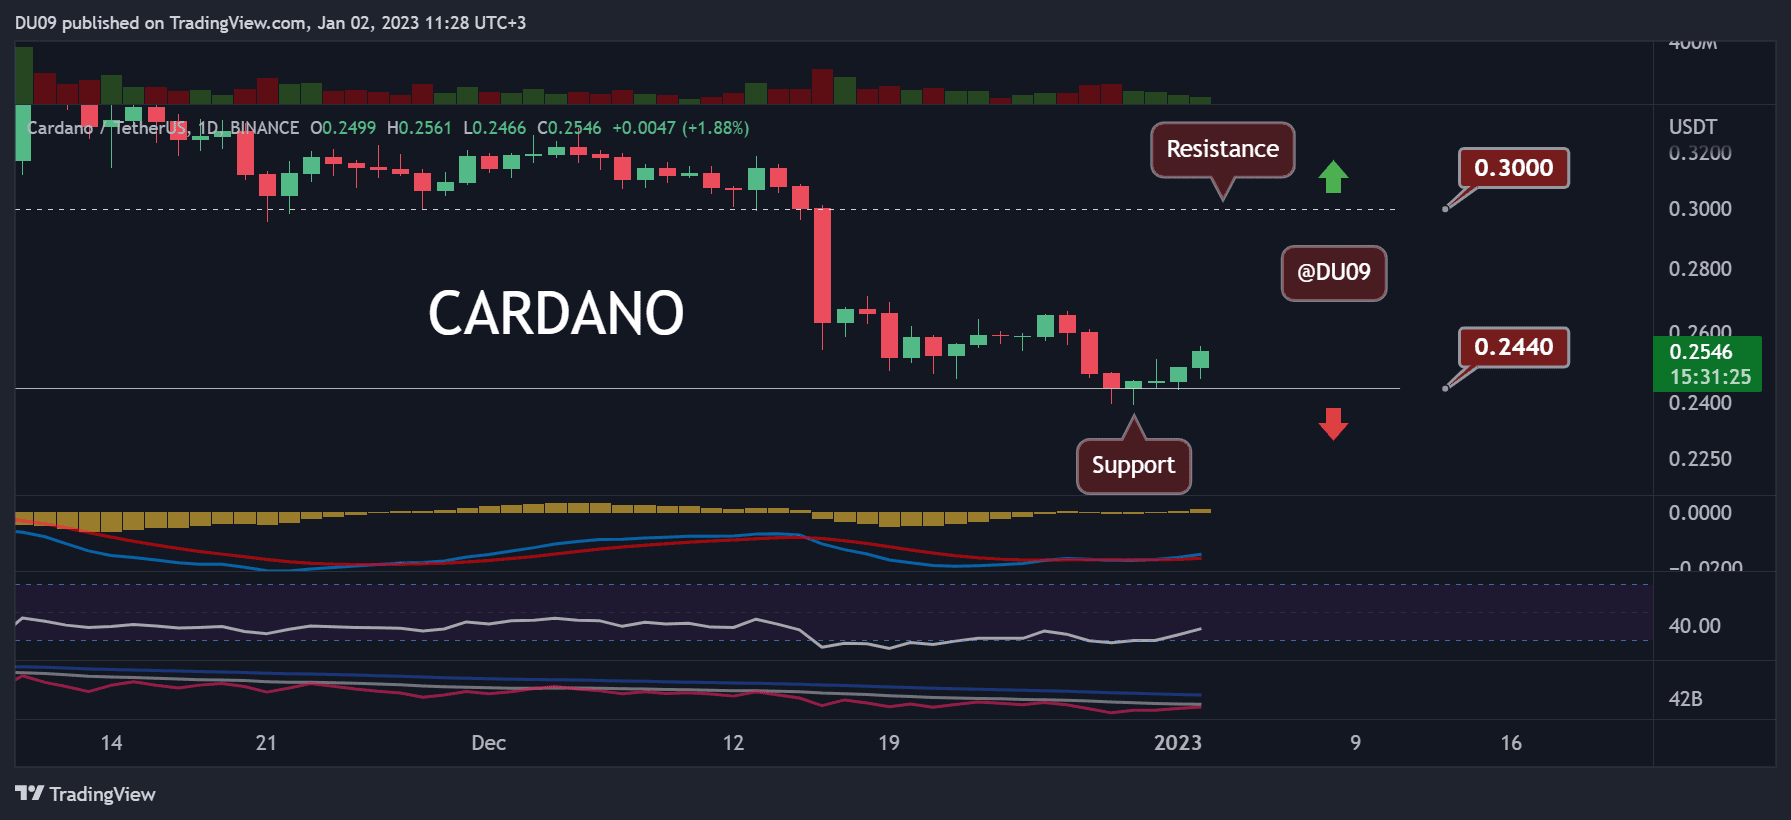
Trading Volume: The volume is rather flat, but despite this, ADA closed in the green for the past three days. Buyers may be returning.
RSI: The daily RSI made a bullish divergence as the price fell to a yearly low in December 2022. This is promising, particularly in light of the current price action.
MACD: The daily MACD charted a bullish cross on New Year’s Eve. Perhaps this was the signal buyers waited for.

Bias
The bias for ADA is leaning bullish, but a clear break of the key resistance at $0.30 is needed to confirm it.
Short-Term Prediction for ADA Price
With a good start in 2023, ADA could attempt a recovery. The indicators seem to support such a reversal in the price action, but market participants need to be careful in case this is just a bull trap. It’s important to keep a close eye on the $0.30 resistance, as that will be decisive on where Cardano moves next.
The post Cardano Spikes 4% in a Day, but Is The Worst Over? (ADA Price Analysis) appeared first on CryptoPotato.


