Cardano Price Analysis: Will ADA Fall to $0.6 After 11% Weekly Drop?
Cardano’s price has been correcting gradually over the last few months after a significant rally in November.
Yet, there are multiple strong support levels available to push the price higher in the coming weeks.
By Edris Derakhshi (TradingRage)
The USDT Paired Chart
Looking at the USDT-paired chart, the asset has been trapped inside a large falling wedge pattern below the $1.3 resistance level. Currently, the market is dropping toward the lower boundary of the pattern and the $0.8 support zone, which could result in a bullish rebound.
Yet, even if these levels get broken to the downside, the 200-day moving average, located around the $0.6 mark, will likely prevent the price from dropping lower in the short term.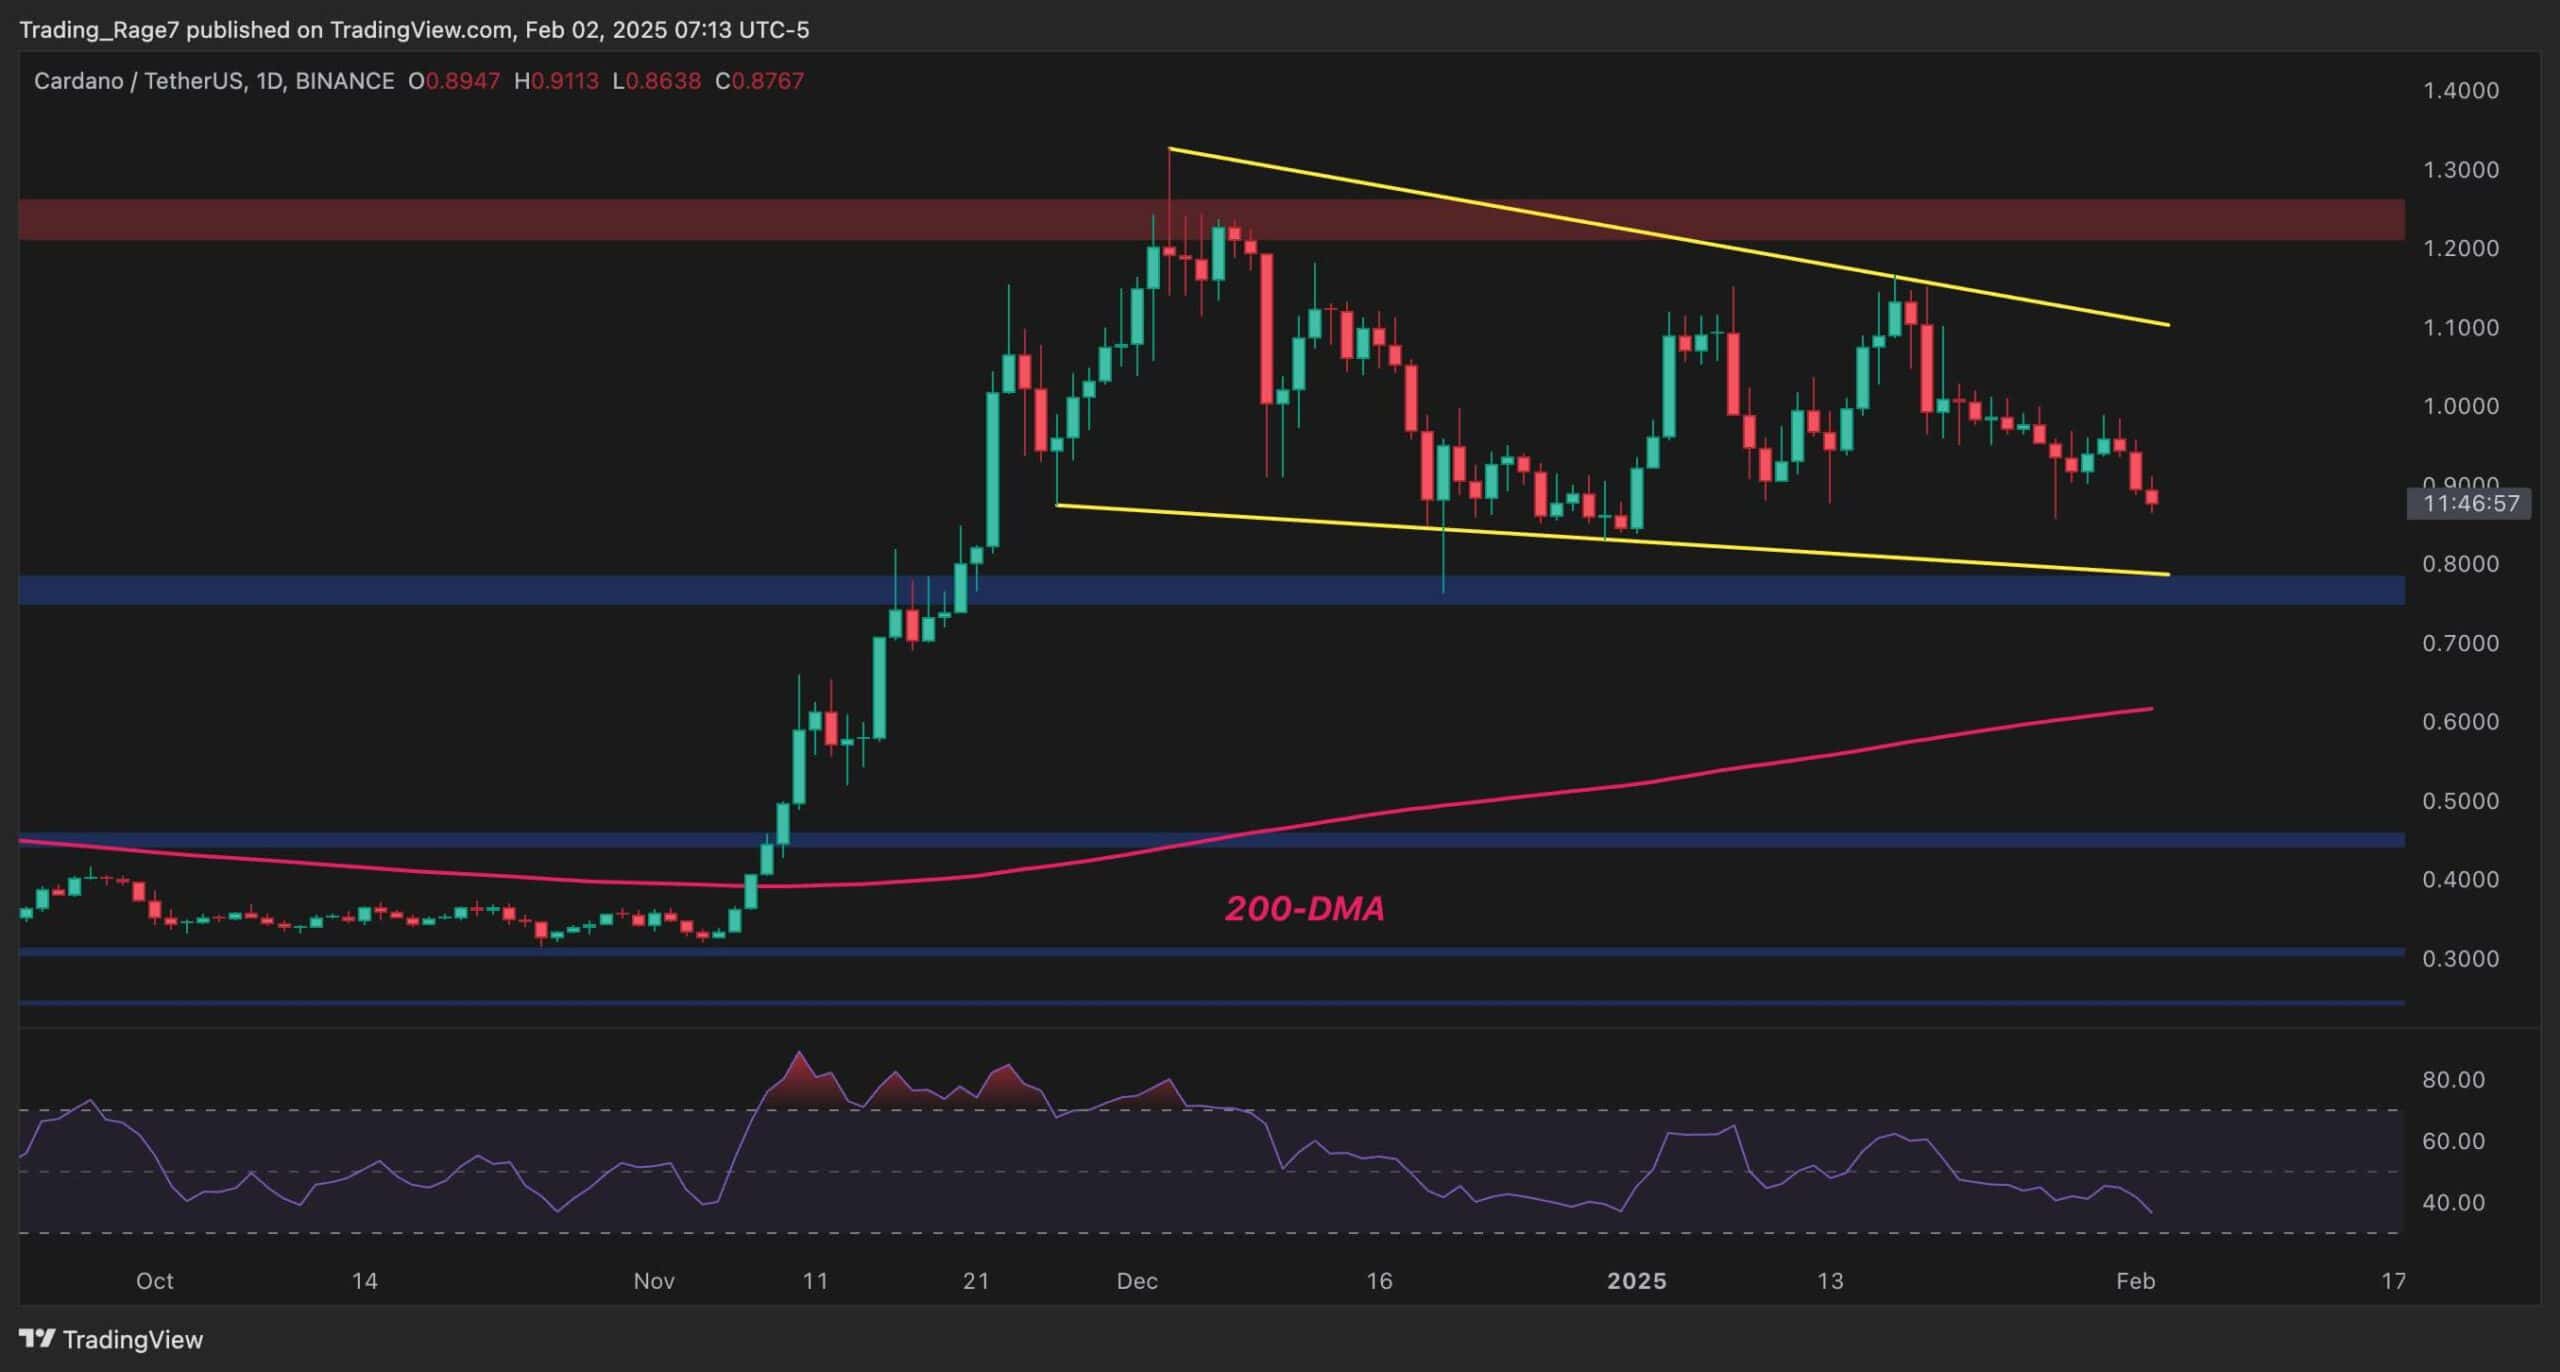
The BTC Paired Chart
Looking at the ADA/BTC chart, the former has been consolidating between the 1,300 SAT and the 900 SAT levels over the past months.
Currently, the market is testing the 900 SAT support zone and is likely to break it to the downside, with the momentum being bearish. In this case, a deeper decline toward the 200-day moving average, located around the 750 SAT mark, could be expected in the upcoming weeks.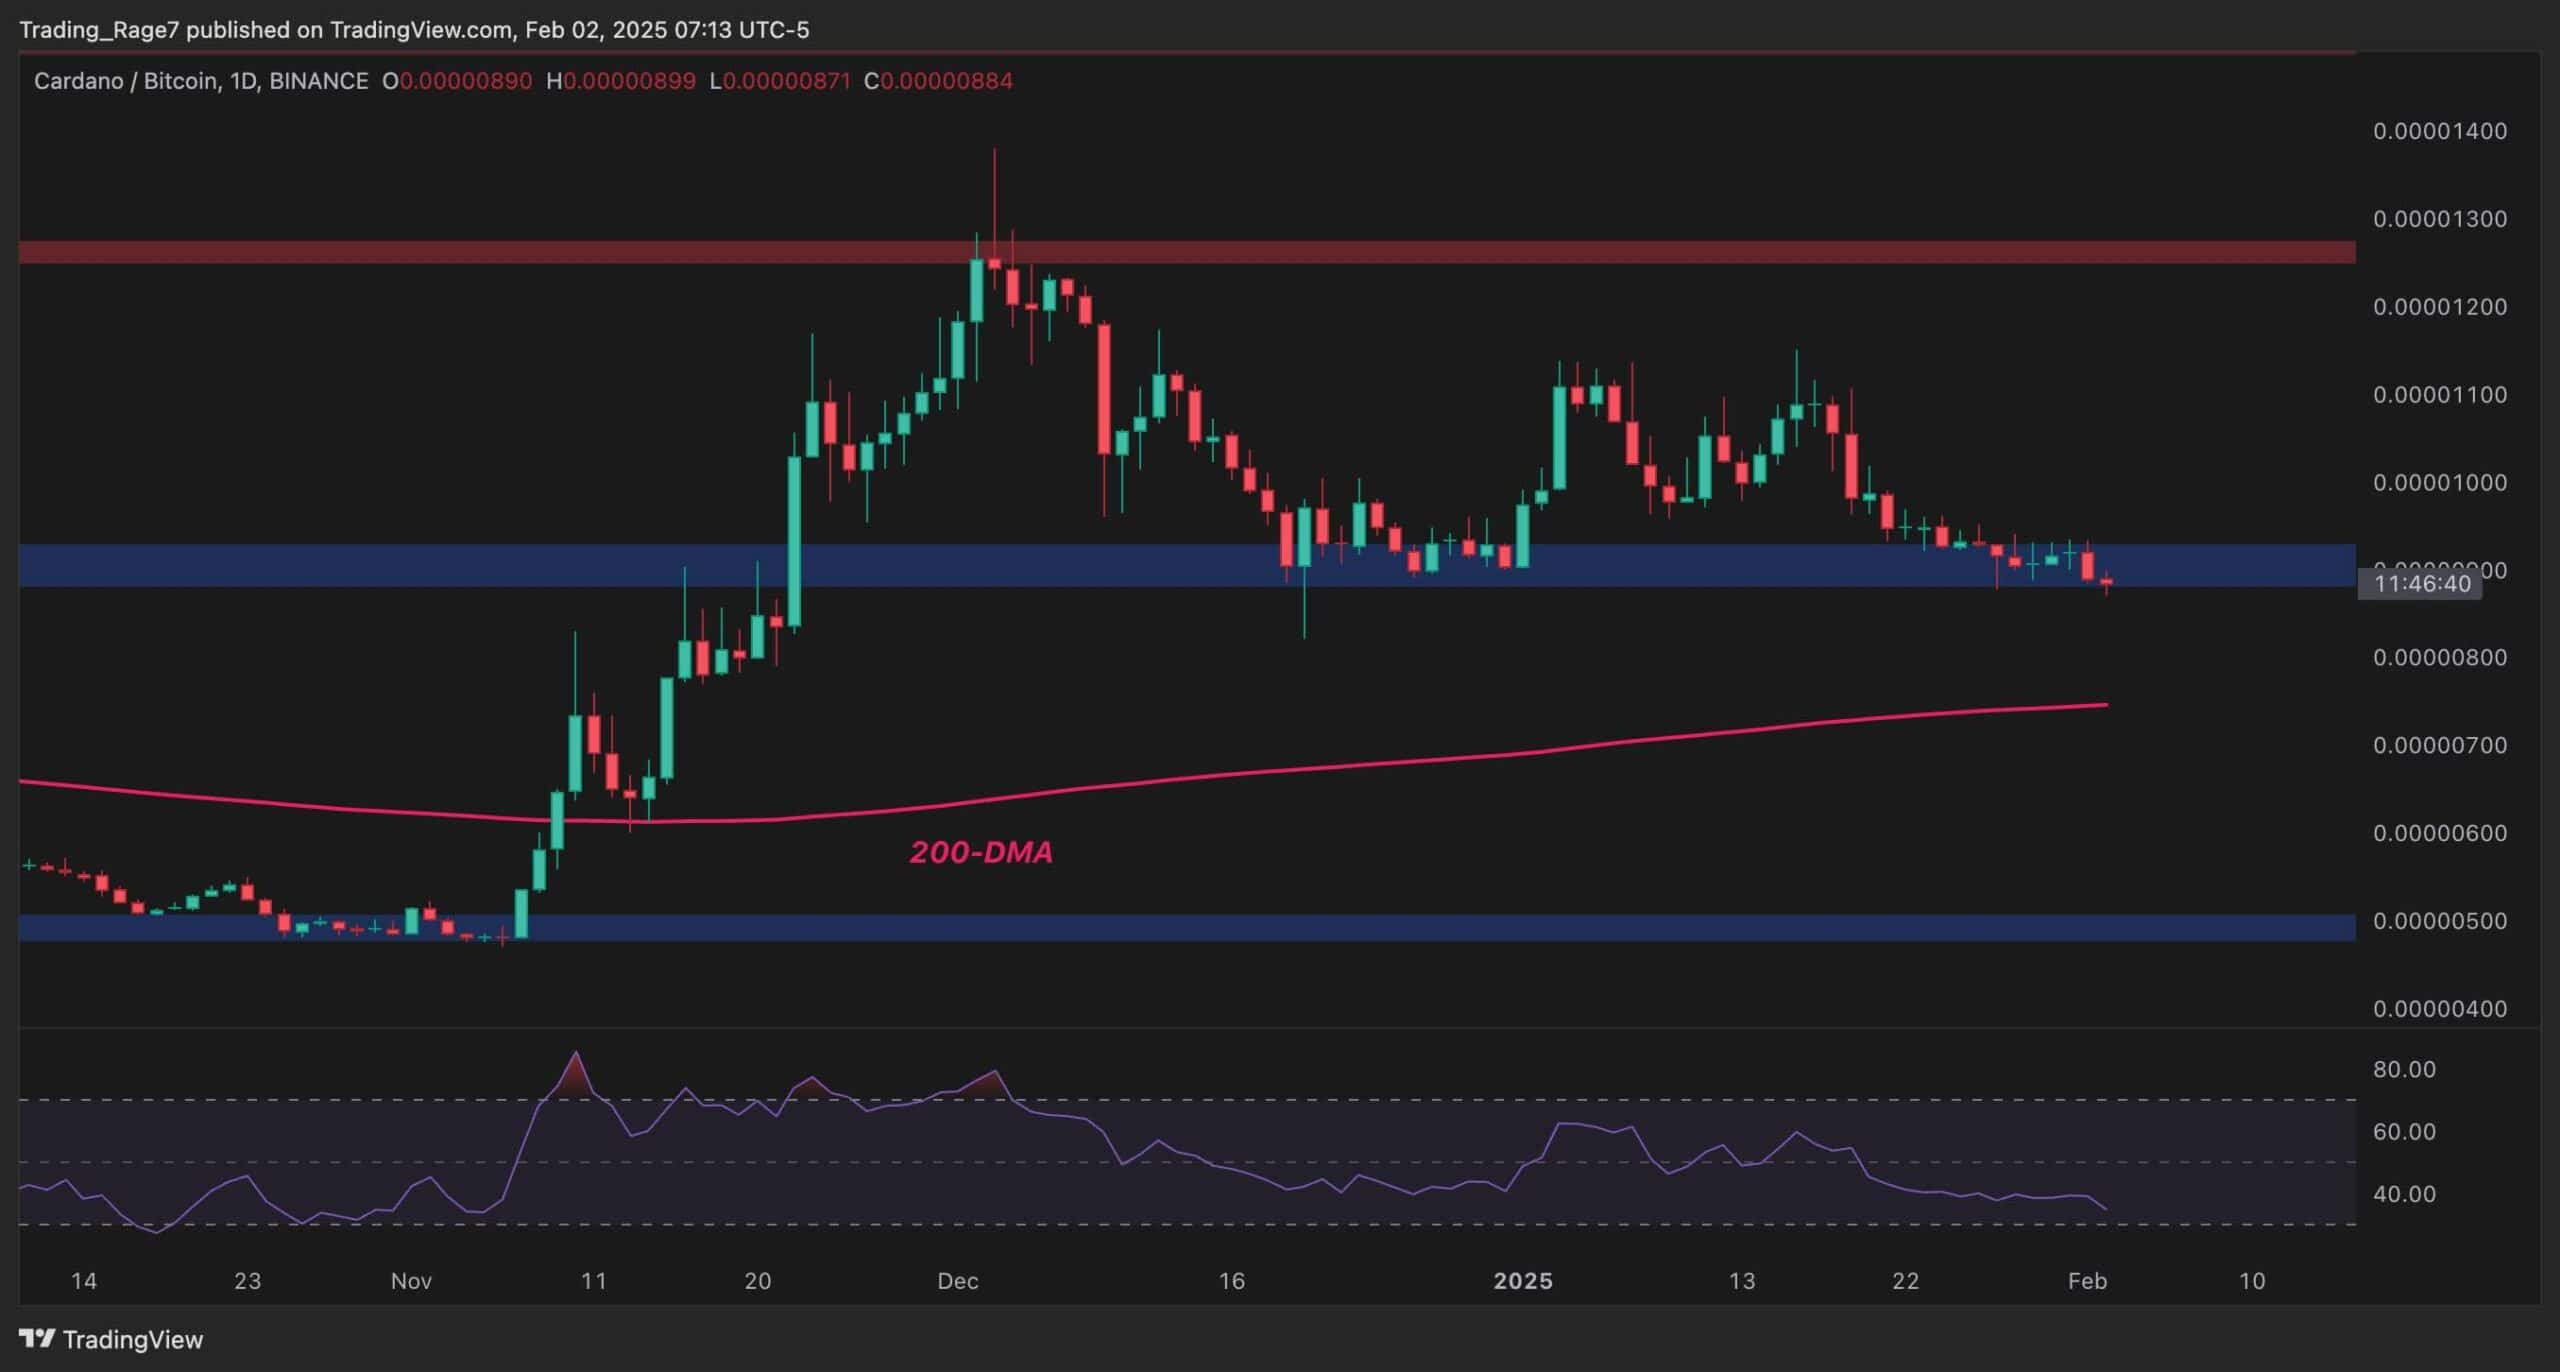
The post Cardano Price Analysis: Will ADA Fall to $0.6 After 11% Weekly Drop? appeared first on CryptoPotato.