Cardano Price Analysis: Following the Correction, $1 Inbound for ADA?
ADA/USD – Cardano Bulls Back On The Offesnive
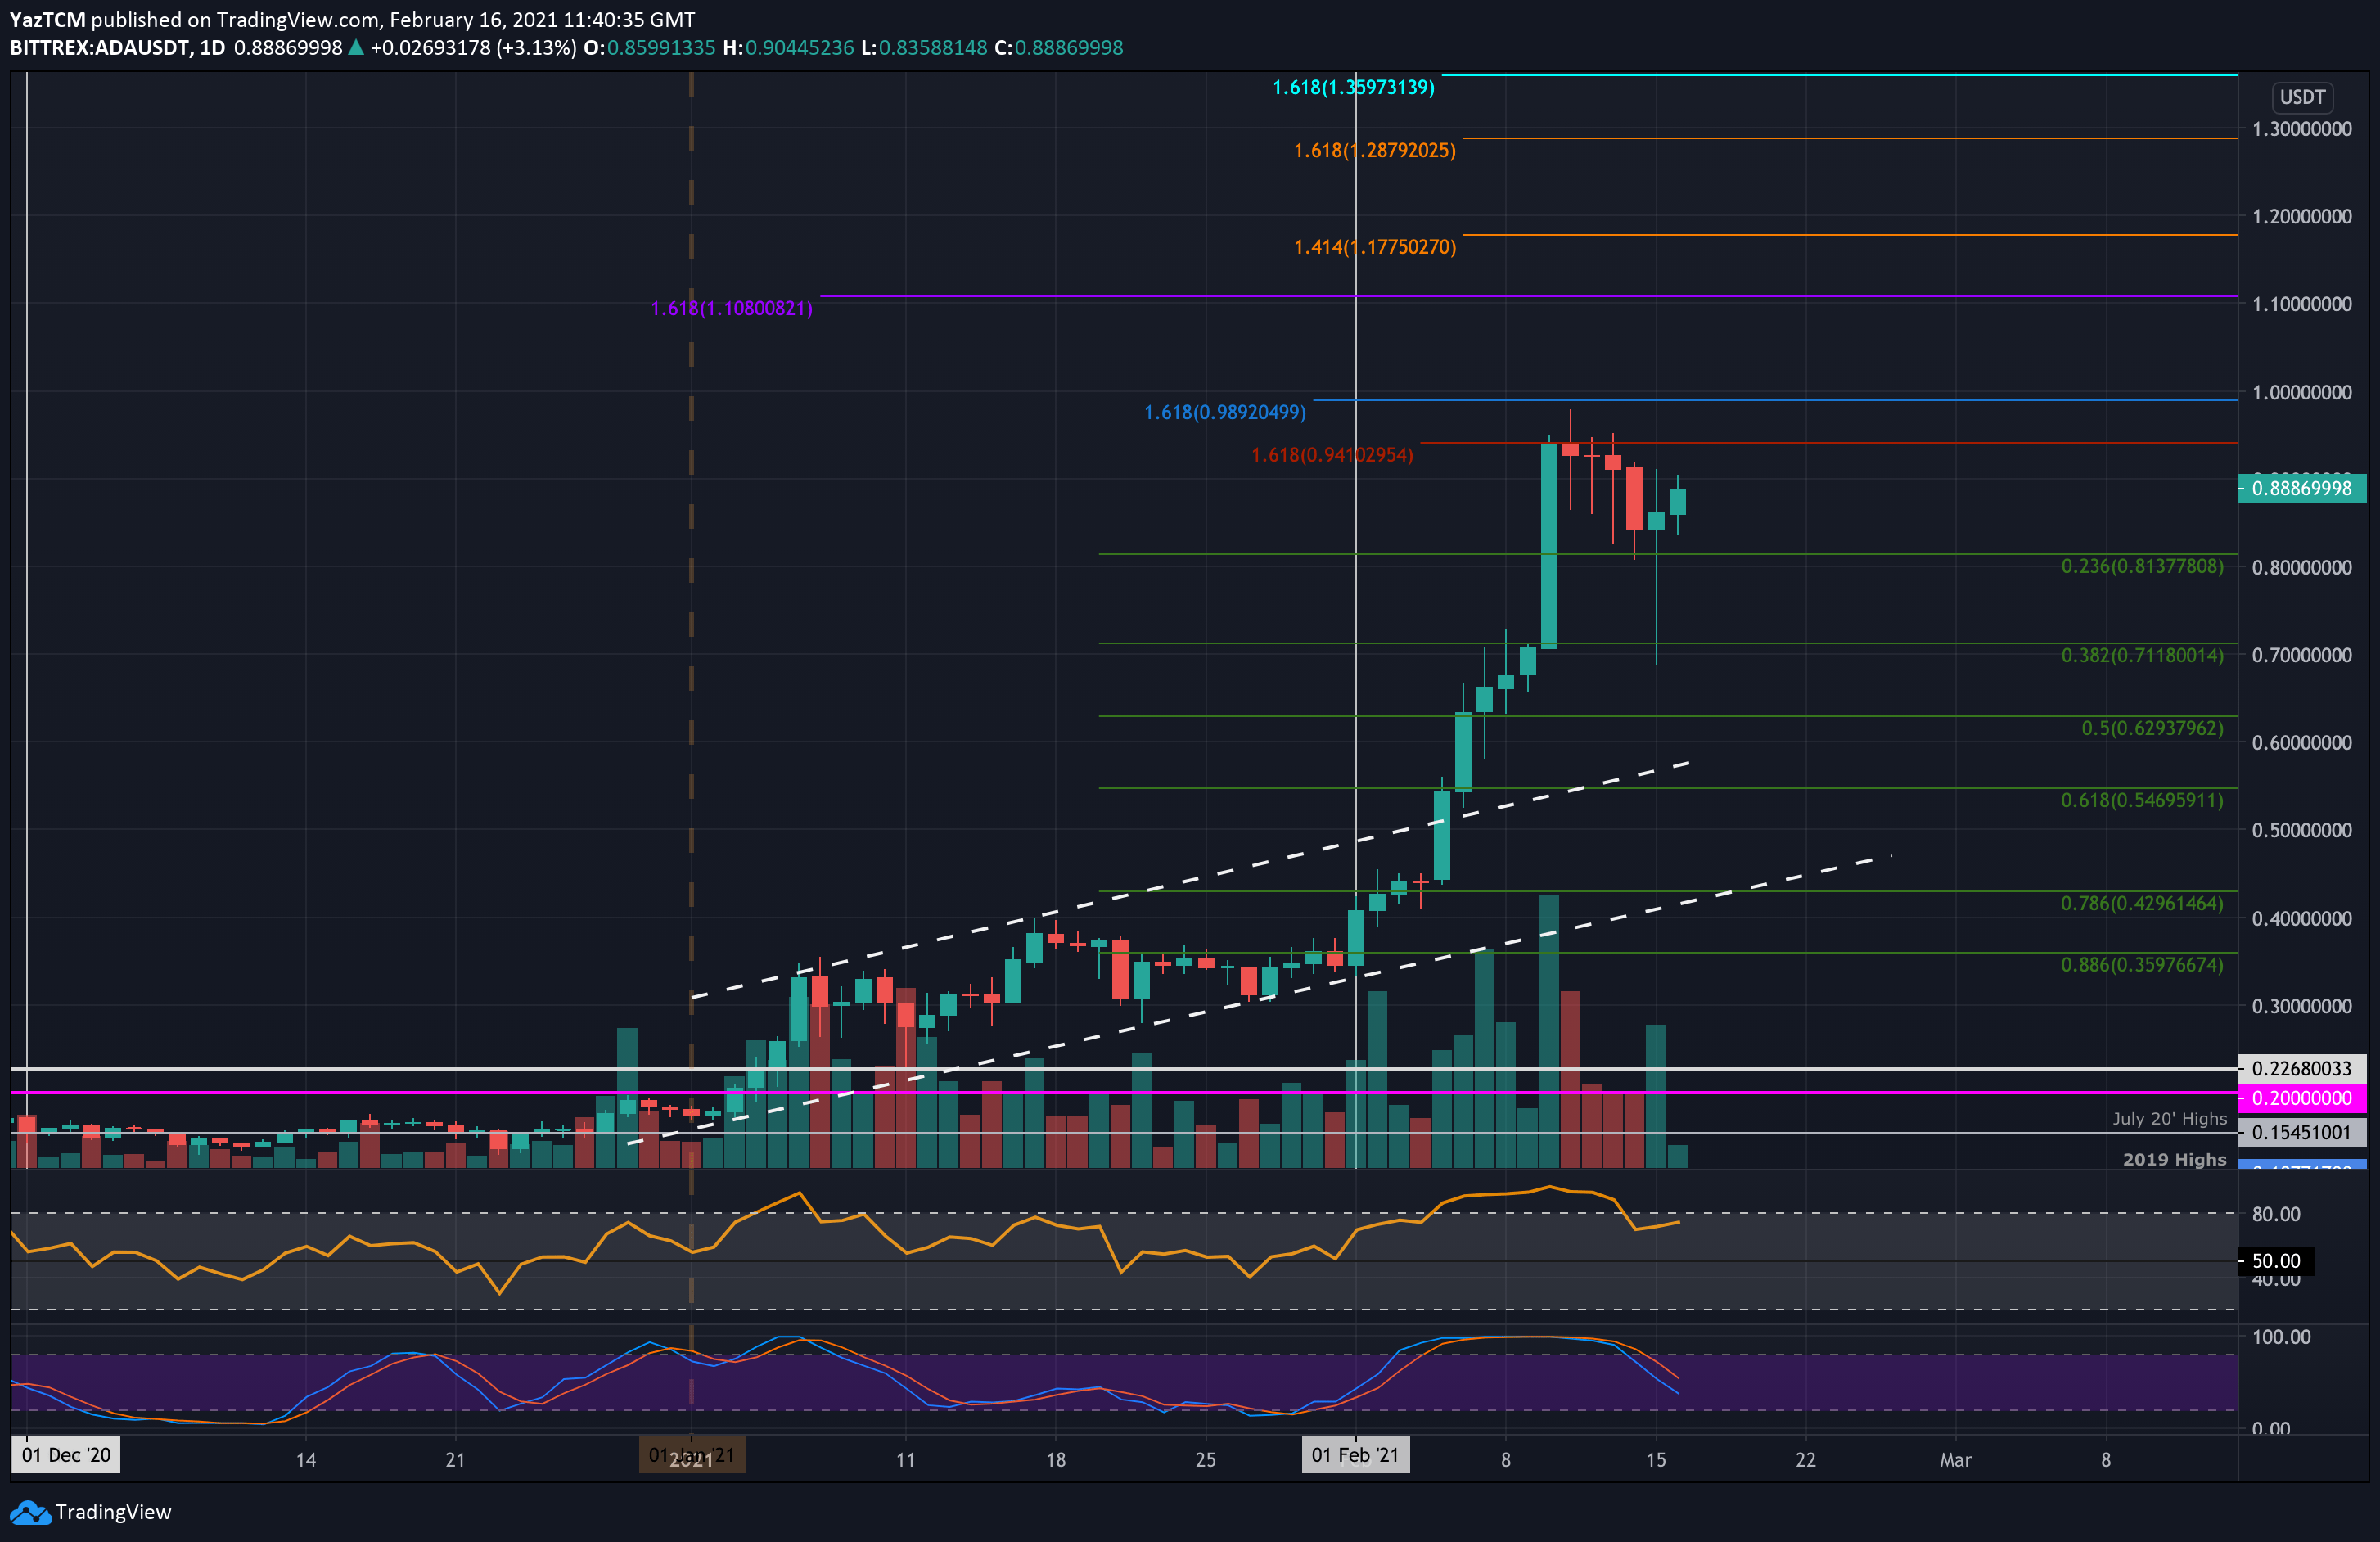
Key Support Levels: $0.813, $0.711, $0.629.
Key Resistance Levels: $0.941, $1.00, $1.10.
Cardano had pushed higher above an ascending price channel at the start of February and started to turn parabolic. It continued to surge until it met resistance at $0.941 (1.618 Fib Extension – red) last week.
From there, ADA started to decrease. It managed to find support at $0.813 (.236 Fib) and defended this level pretty well. Yesterday, ADA did spike as low as $0.7 but quickly recovered back above $0.813 before the daily candle closed.
ADA has now started to push higher as it makes an attempt to break above $0.9.
ADA-USD Short Term Price Prediction
Looking ahead, the first resistnace lies at $0.941 (1.618 Fib Extension – red). This is followed by $0.989 (1.618 Fib Extension – blue), and $1.00. Beyond $1.00, additional resistance lies at $1.10, $1.17 (1.414 Fib Extension – orange), and $1.28 (1.618 Fib Extension – orange).
On the other side, the first level of support lies at $0.813 (.236 Fib). This is followed by $0.711 (.382 Fib), $0.629 (.5 Fib), and $0.546 (.618 Fib).
The RSI was trading at extremely overbought conditions last week as it met the high of $0.941. It has since dropped lower, allowing the buyers some breathing room before pushing higher again.
ADA/BTC – Bulls Defend July 2020 High-Day Closing Price
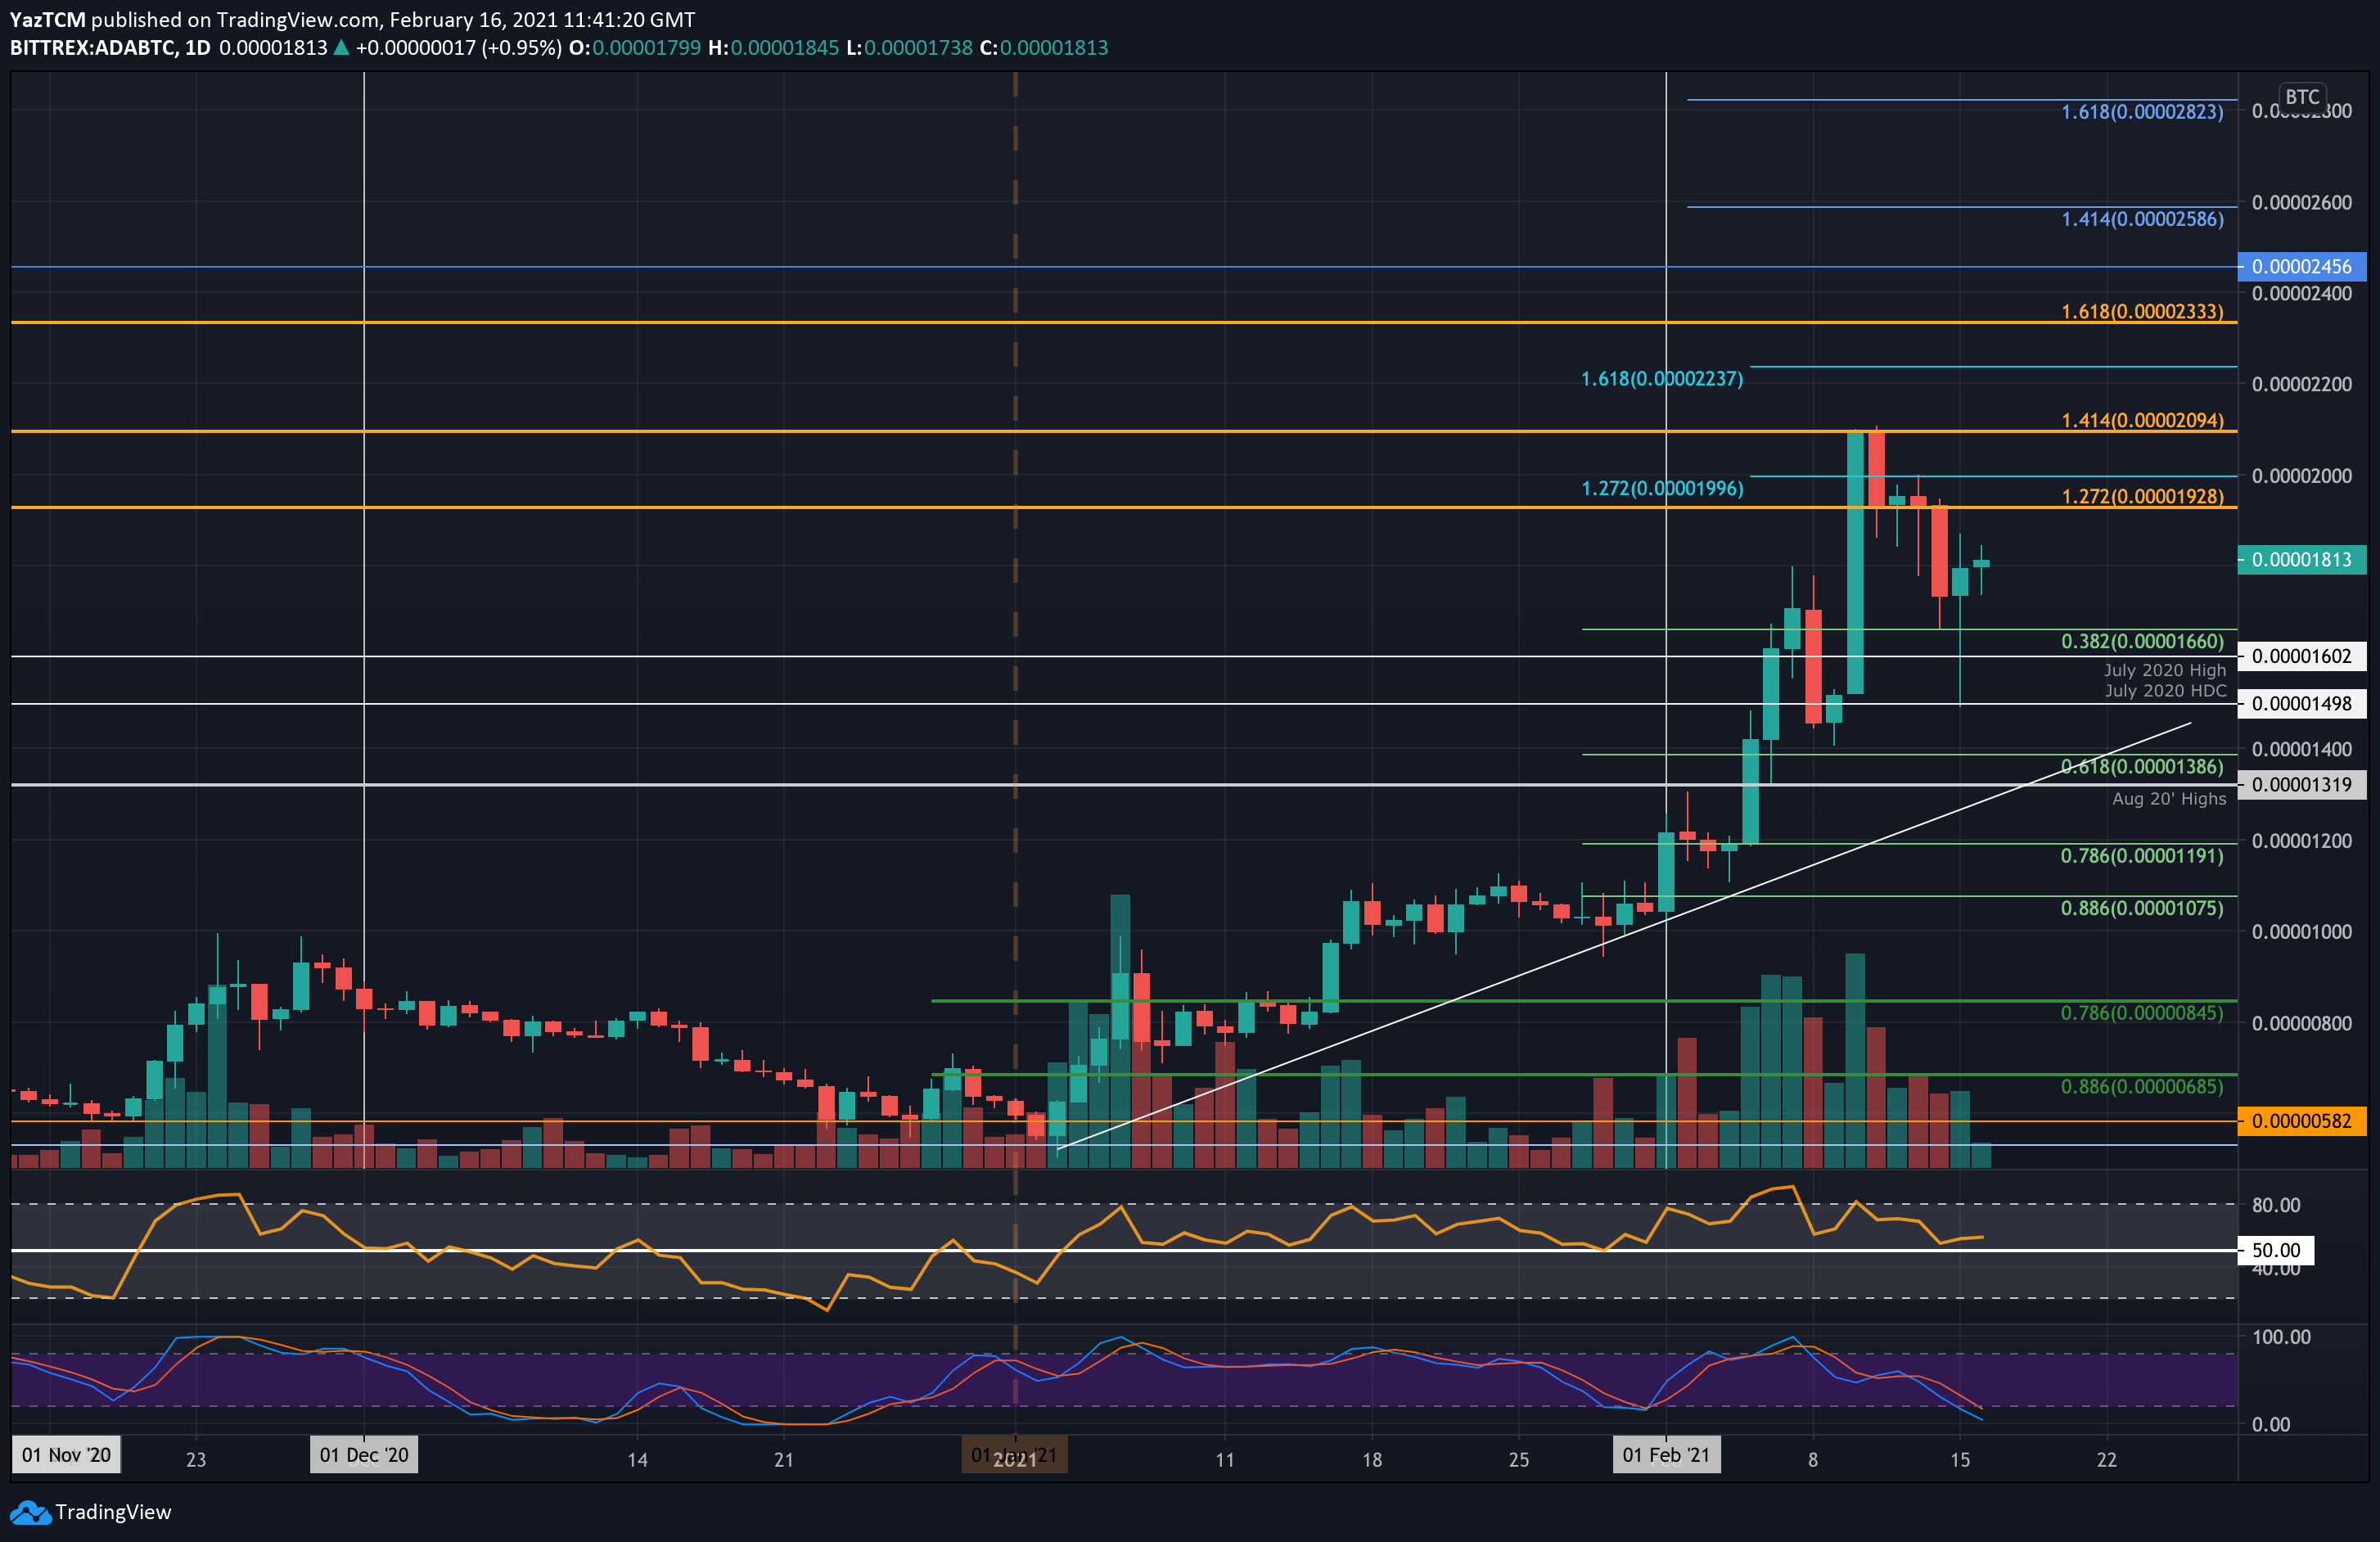
Key Support Levels: 1660 SAT, 16000 SAT, 1500 SAT.
Key Resistance Levels: 1928 SAT, 2000 SAT, 2095 SAT.
Against Bitcoin, ADA had pushed as high as 2095 SAT (1.414 Fib Extension) last week. It could not continue further above there and has been dropping for the past few days.
It had found support at 1660 SAT (.382 Fib) but spiked much lower into 1500 SAT (July 2020 high-day close) yesterday. It quickly recovered from these lows and managed to close above 1660 SAT by the time the candle closed.
Today, ADA is attempting its recovery as it hits 1813 SAT.
ADA-BTC Short Term Price Prediction
Looking ahead, the first resistance lies at 1928 SAT (1.272 Fib Extension – orange). This is followed by 2000 SAT, 2095 SAT (1.414 Fib Extension – orange), 2237 SAT, and 2333 SAT (1.618 Fib Extension – orange).
On the other side, the first support lies at 1660 SAT (.382 Fib Retracement). This is followed by 1600 SAT (July 2020 High), 1500 SAT (July 2020 HDC), and 1385 SAT (.618 Fib & Rising Trend Line Support).
The RSI has returned to the midline and has bounced from it slightly, indicating the bulls remain in control of the market momentum.