Cardano Price Analysis: All Eyes on $1 as ADA Explodes 8% Daily
Key Support levels: $0.78, $0.68
Key Resistance levels: $1, $1.2
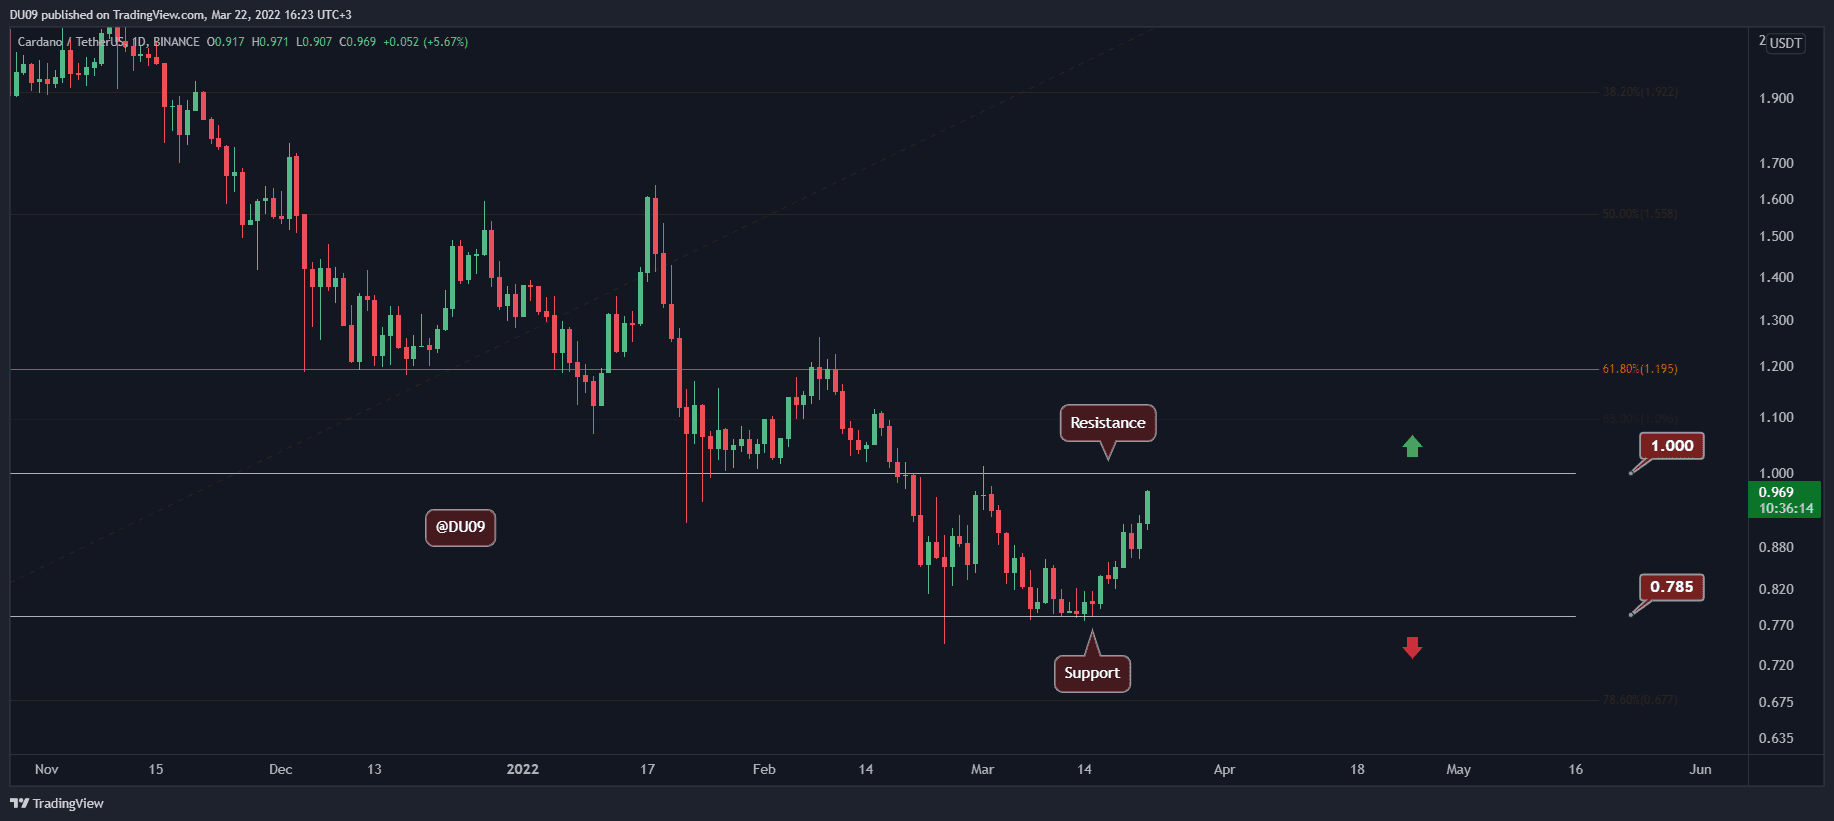
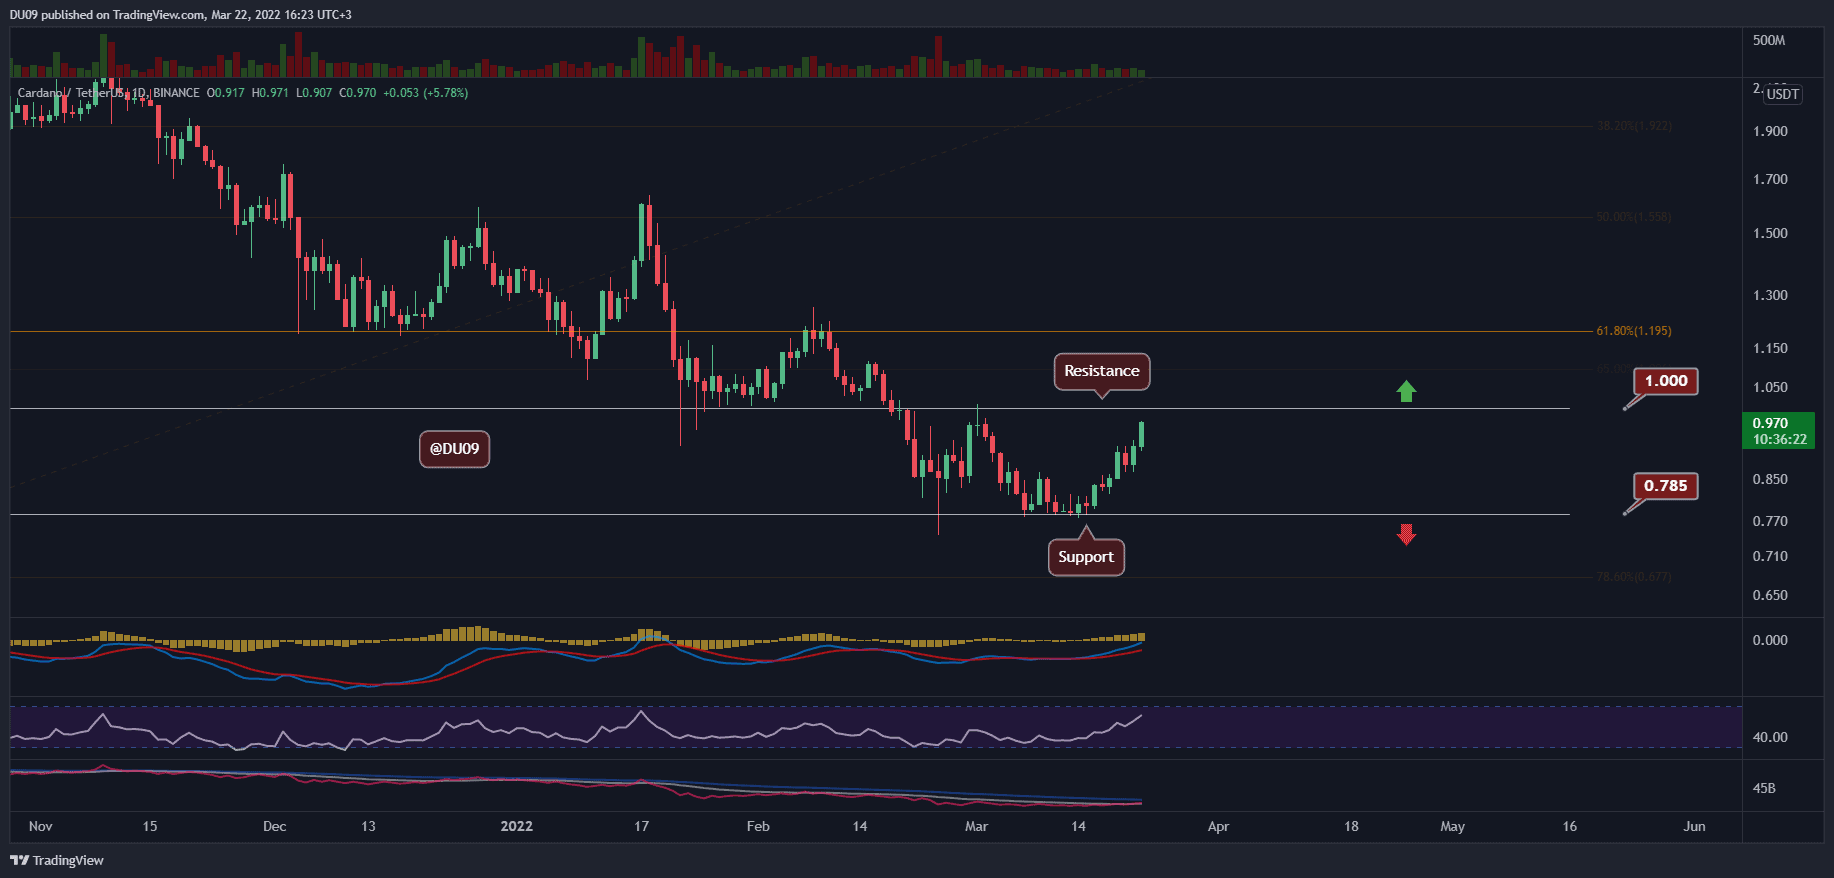
After successfully testing the $0.78 level as support, ADA’s price quickly moved higher and is now approaching the key resistance at $1, which will be a significant test for buyers. The indicators are also turning quite bullish on this most recent price action, but volume continues to be lacking.
Technical Indicators
Trading Volume: The volume remains flat so far. This is not ideal, but all eyes are on the key resistance at $1, which will be decisive in where ADA is headed next.
RSI: The daily RSI is bullish and moving higher towards the overbought area. If the cryptocurrency is rejected at the key resistance, then the RSI may fall before passing 70 points.
MACD: The daily MACD moving averages are expanding, and the histogram is making higher highs. This is a significant bullish signal without any signs that it can reverse at this time.
Bias
The current bias is bullish.
Short-Term Prediction for ADA Price
ADA is due to test the $1 level, which will be a very contested price area where both bulls and bears are likely to come up swinging. High volatility is to be expected. If $1 price level can be turned into support, then ADA’s path opens up to a higher valuation.


