Cardano Price Analysis: ADA Surges 13% And Finally Conquers 1000 SAT
- Cardano starts the monthly opening on a bullish foot with a total of 13% gains over the past hours.
- The price is increasing following a huge daily buying volume.
- Against Bitcoin, ADA surged above last month’s high after seeing 11.11% gains today.
ADA/USD: Cardano Signals Fresh Increase
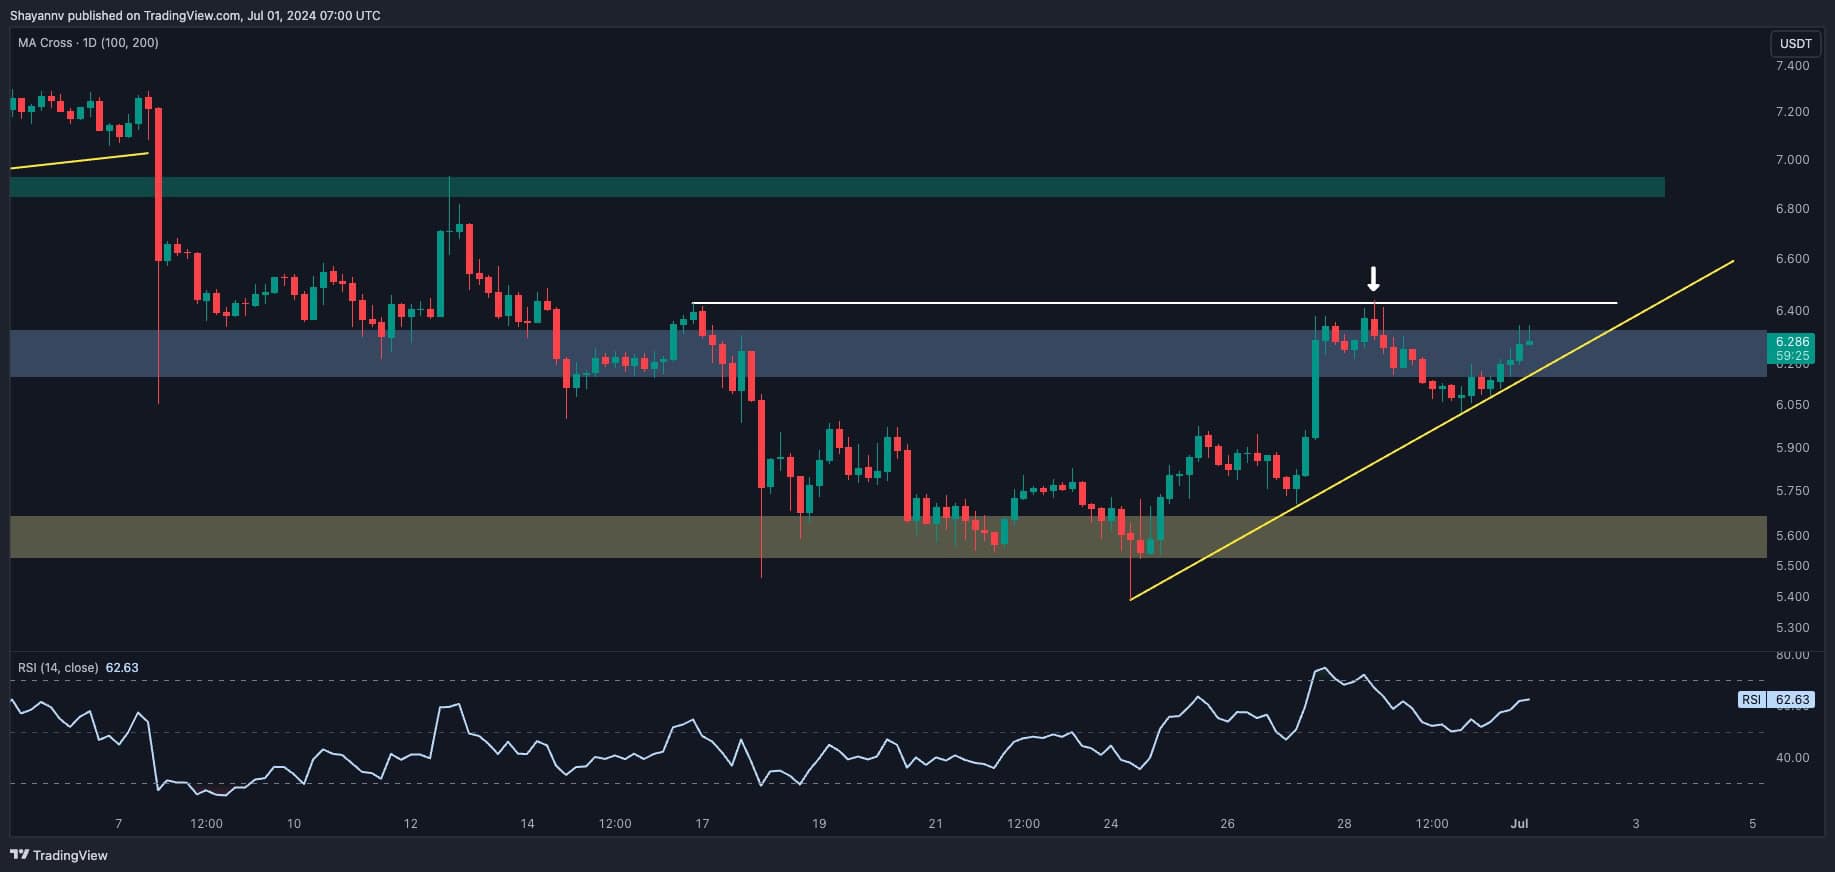
Key Resistance Levels: $0.095, $0.97, $0.1
Key Support Levels: $0.082, $0.075, $0.064
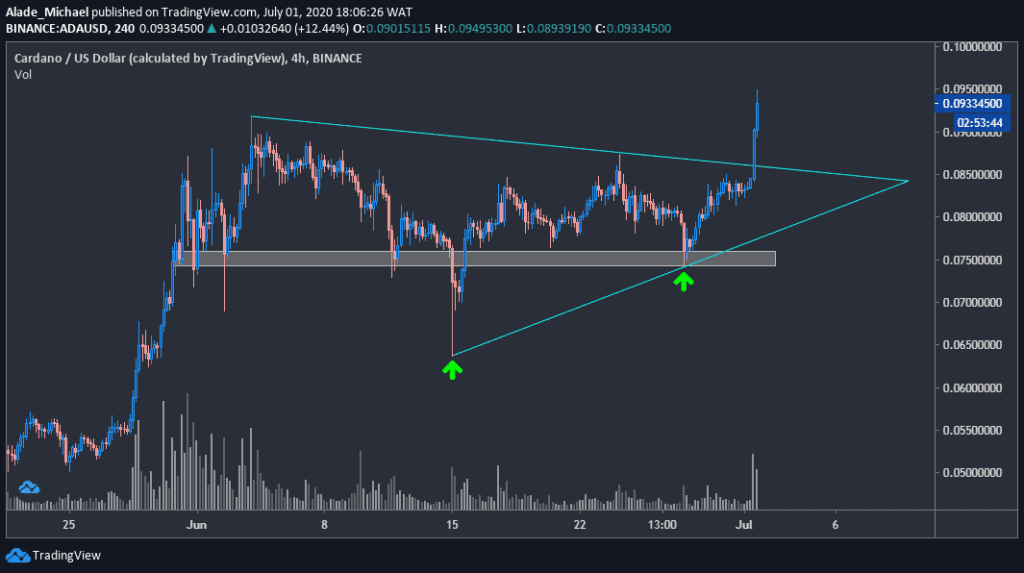
The price of Cardano is up by 12.50% over the past hours due to the weekly recovery in the entire crypto space. It started to regain strength since it wicked at $0.064 in mid-July – where the green arrows started to form.
Followed by a steady push (the second green arrow) from around $0.075 – a crucial demand area – the price is now breaking out from a triangle pattern, which suppressed buying pressure for the past four weeks now. The current 4-hour candle closes above this triangle just validate a fresh bullish cycle for Cardano – it may not last if sellers show strong interest.
But looking at the pattern from a technical perspective, strong bullish action is expected to take place in the next few days, even if a bearish play takes place. However, it’s essential to watch out for a pullback.
Cardano Price Analysis
After breaking out from the triangle today, the price surged to $0.095 level and dropped briefly to around $0.0933 against the US Dollar. If the price continues to increase and retakes the daily peak, a new high may come around $0.97 and potentially $0.1 level in the coming days.
A false breakout might send the price back to a daily low of $0.082, inside the triangle. It may encounter the grey demand zone at $0.075 if the price drops further. The mid-July bearish exhaustion at $0.064 remains the last defense line for the bulls. Once it breaks, Cardano may completely reverse the trend on the 4-hour outlook.
But if the 0.085 level should hold as support, more positive action is much likely to come into play.
ADA/BTC: Cardano broke July Resistance
Key Resistance Levels: 1100 SAT, 1200SAT, 1300 SAT
Key Support Levels: 900 SAT, 843 SAT, 774 SAT
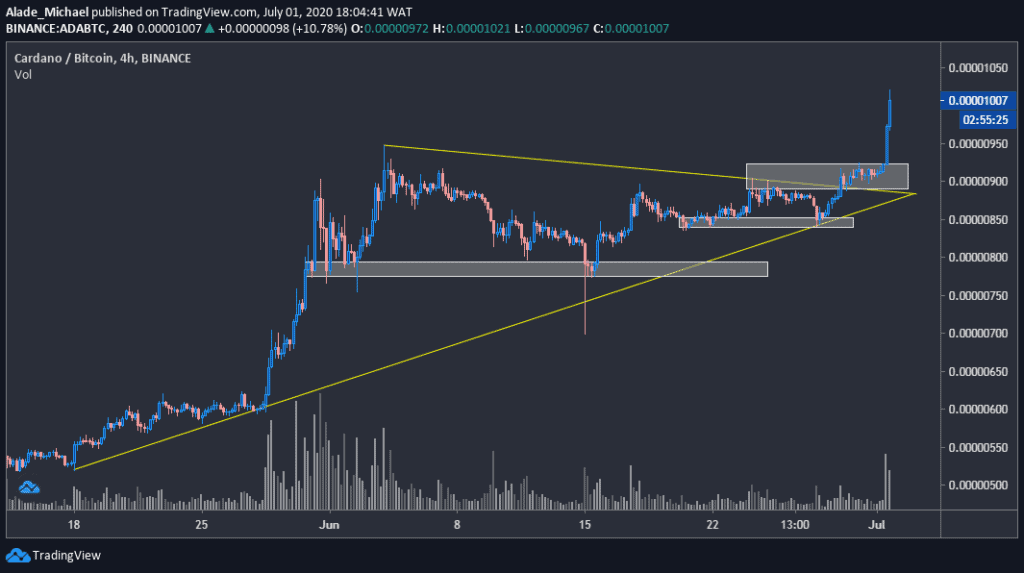
Following the latest increase, Cardano surpassed last month’s high (947 SAT) and recorded a new daily high above around 1017 SAT about a few hours ago. The price has dropped to around 1007 SAT at the time of writing.
Meanwhile, the sudden increase was plotted from around 843 SAT – now weekly support – but it became significant after breaking out from an ascending triangle on Monday. This breakout could be the starting point of a second wave for Cardano as buying volume continues to increase.
But if the price drops, a pullback can be expected to around 900 SAT – where the price saw a two-day consolidation inside the immediate grey box – before resuming bullish.
Cardano Price Analysis
Looking at the current market structure, the price is likely to increase to 1100 SAT level if buyers continue to step into the market. The next buying target above this level is 1200 SAT, and perhaps 1300 SAT in the coming days.
However, if the price pulls back and fails to find support at 900 SAT, the next level to consider is the weekly low of 843 SAT. Below this, support lies at 774 SAT – the last grey area on the chart.
The post Cardano Price Analysis: ADA Surges 13% And Finally Conquers 1000 SAT appeared first on CryptoPotato.