Cardano Price Analysis: ADA Signals Bullish Divergence, a Retest of $1.3 Incoming?
Despite ADA dropping to support, it has formed a bullish divergence, indicating a possible move higher soon.
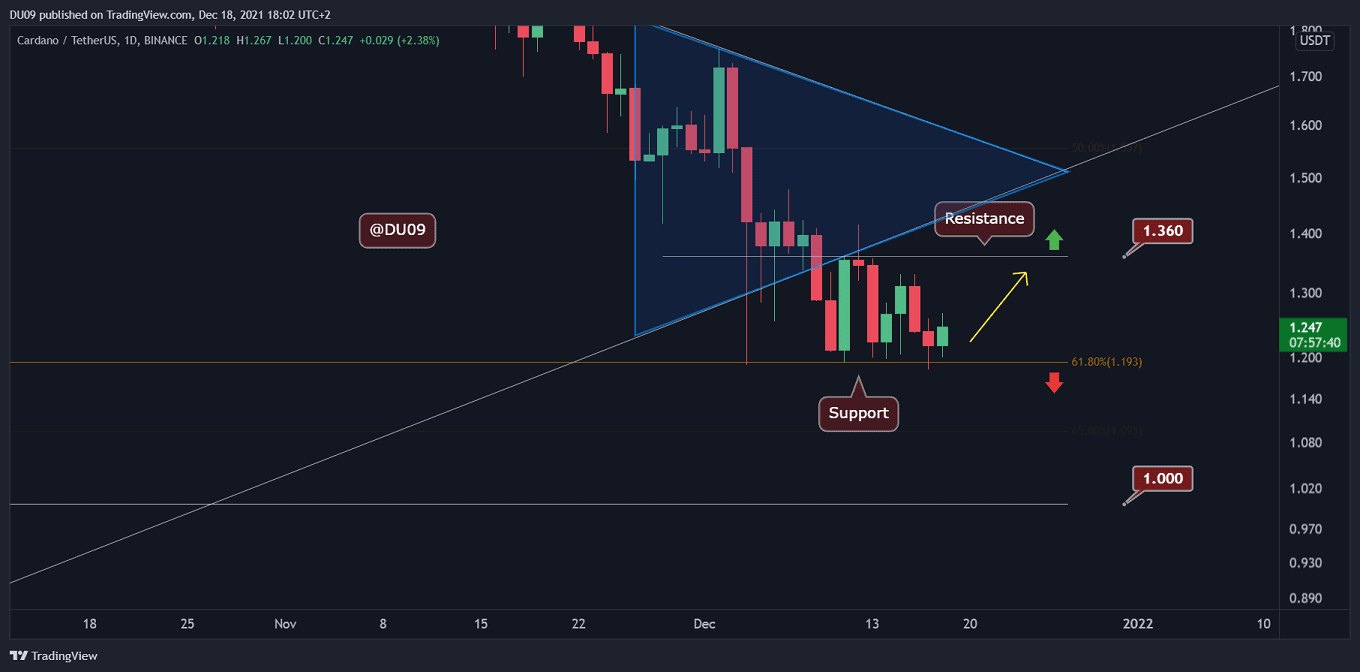
Key Support levels: $1.2, $1
Key Resistance level: $1.3, $1.5
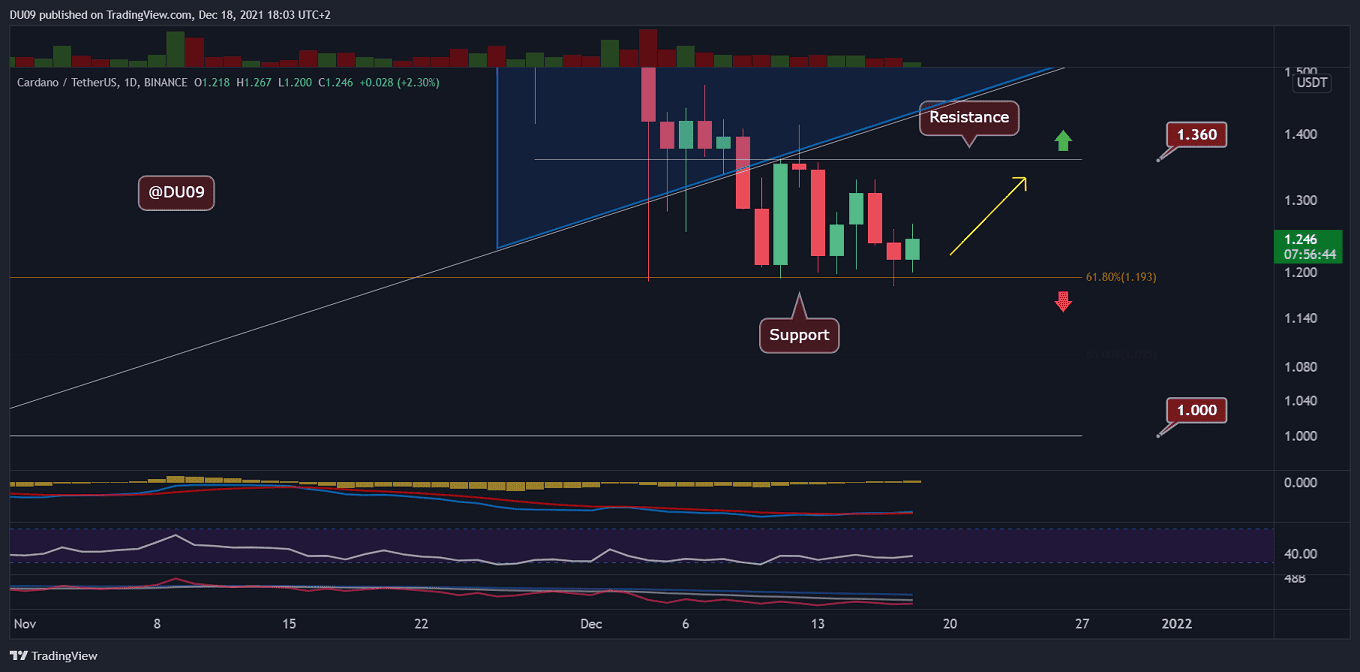
ADA retested the support at $1.2 yesterday, making a lower low. However, the RSI has made a higher low, signaling a bullish divergence. So long the key support level holds, ADA has a good chance of getting back into the uptrend and maybe attempting to break out of the resistance at $1.3.
Technical Indicators
Trading Volume: Volume is low, but this is typical for weekends. The coming weekdays may bring some much-needed volatility back to ADA.
RSI: As mentioned above, there is a bullish divergence at the daily RSI. This is a positive sign for buyers and may give them the momentum needed to escape from this area and break higher.
MACD: The MACD on the daily timeframe did a crossover to the positive side last week. The bulls maintained this momentum so far despite the support level being retested. If this continues, ADA will likely attempt a rally soon.
Bias
The current bias is neutral. If ADA can break above the key resistance at $1.3 and close above it then the bias can change to bullish.
Short-Term Prediction for ADA Price
ADA’s price is just above the key support at $1.2, and it will likely stay here until momentum changes; of course, this is also dependent on the overall crypto market’s momentum. The indicators support the option of retargeting the $1.3 resistance, but this has yet to be seen during the next week.