Cardano Price Analysis: ADA Recovers 6% In a Day, What’s Next?
ADA/USD – Buyers Rebound From $1.88 Support
Key Support Levels: $$2.00, $1.88, $1.80.
Key Resistance Levels: $2.20, $2.40, $2.50.
ADA bounced by a total of 6% over the past 24 hours since finding support at $2.00 yesterday. The cryptocurrency had broken beneath the 50-day MA on Monday and spiked lower on Tuesday until support was met at $1.88, provided by a 1.414 Fib Extension.
The buyers regrouped at $1.88, allowing them to push toward $2.00 when the daily candle closed. Yesterday, ADA bounced from $2.00 and continued beyond $2.20. It now needs to break the September descending trend line before attempting the 50-day MA around $2.40.
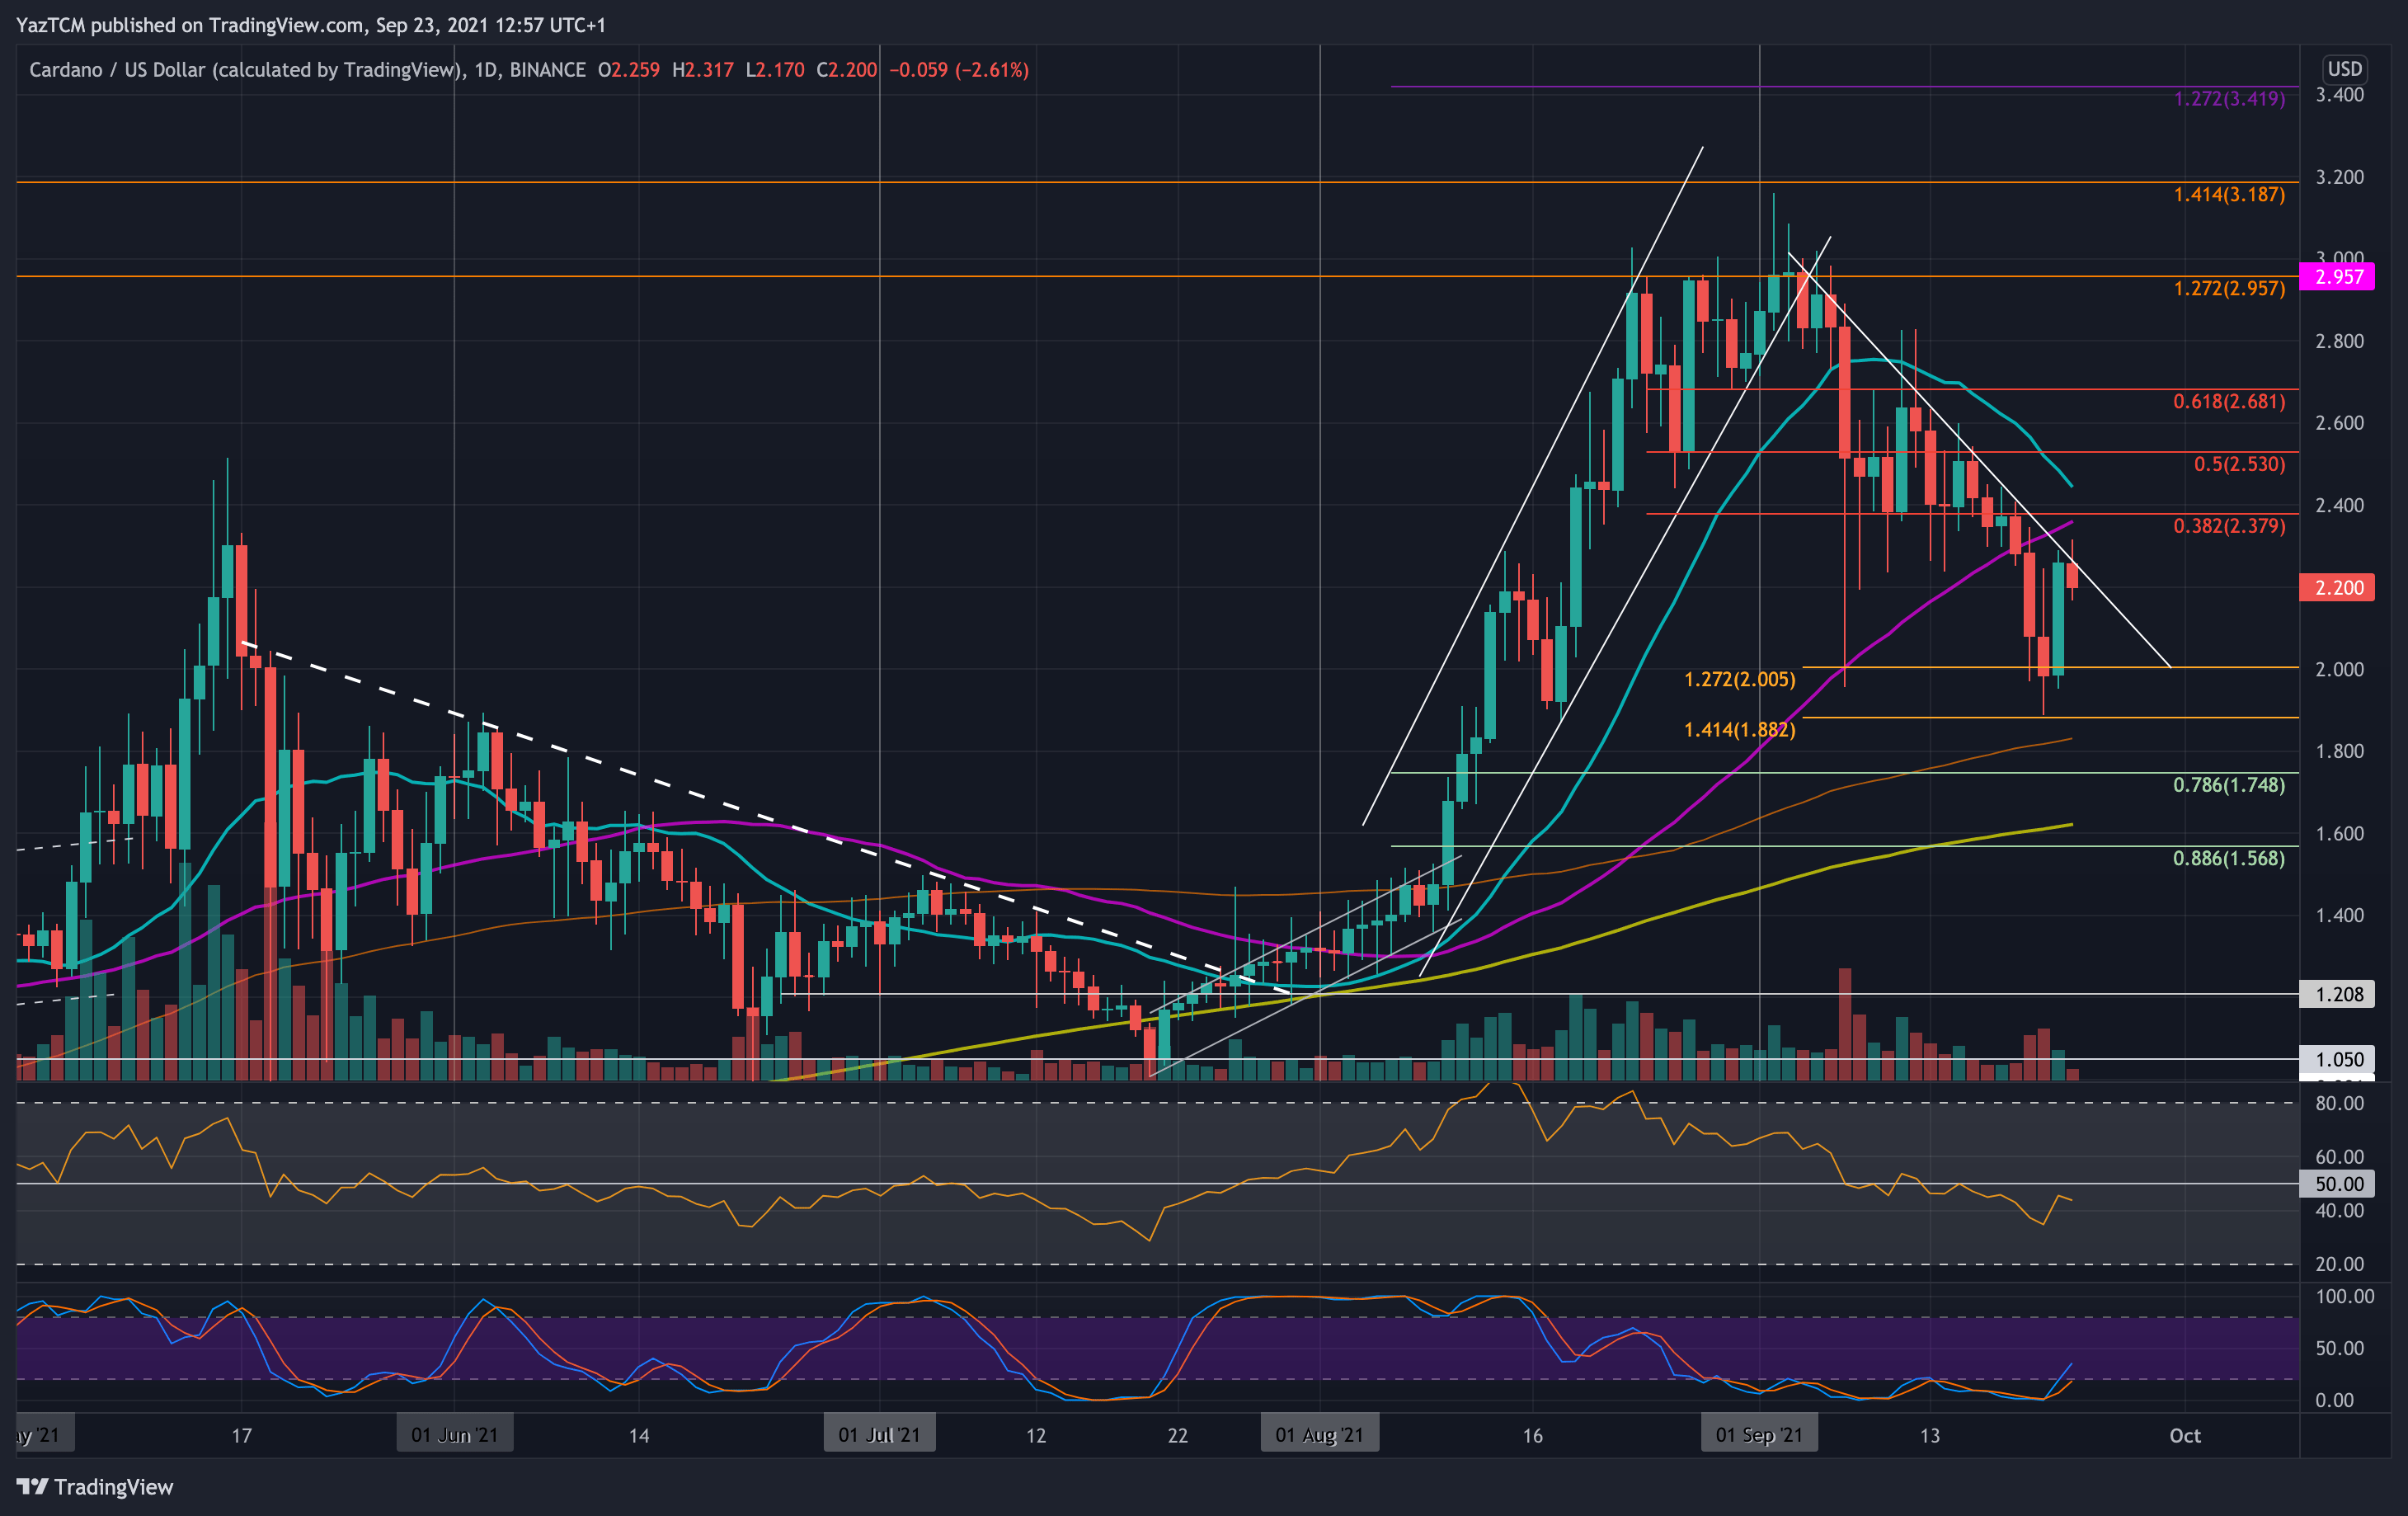
ADA-USD Short Term Price Prediction
Looking ahead, the first resistance lies around $2.20 (falling trend line). This is followed by $2.40 (bearish .382 Fib & 50-day MA), $2.50 (20-day MA), and $2.68 (bearish .618 Fib).
On the other side, the first strong support lies at $2.00. This is followed by $1.88 (downside 1.414 Fib Extension), $1.80 (100-day MA), $1.75 (.786 Fib), and $1.60 (200-day MA).
The RSI is heading back toward the midline, indicating the bearish momentum might be starting to fade.
ADA/BTC – ADA Rebounds From 4800 SAT Support.
Key Support Levels: 5000 SAT, 4800 SAT, 4715 SAT.
Key Resistance Levels: 5200 SAT, 5500 SAT, 6000 SAT.
ADA is also in the middle of a recovery against BTC as it broke above the 50-day MA to sit above 5000 SAT. The cryptocurrency fell beneath 5000 SAT last week and continued below the 50-day MA on Sunday to meet the support at 4800 SAT.
The market held 4800 SAT through the early days of this week and eventually surged above the 50-day MA and 5000 SAT yesterday to reach as high as 5200 SAT. It has since dropped back to 5000 SAT.
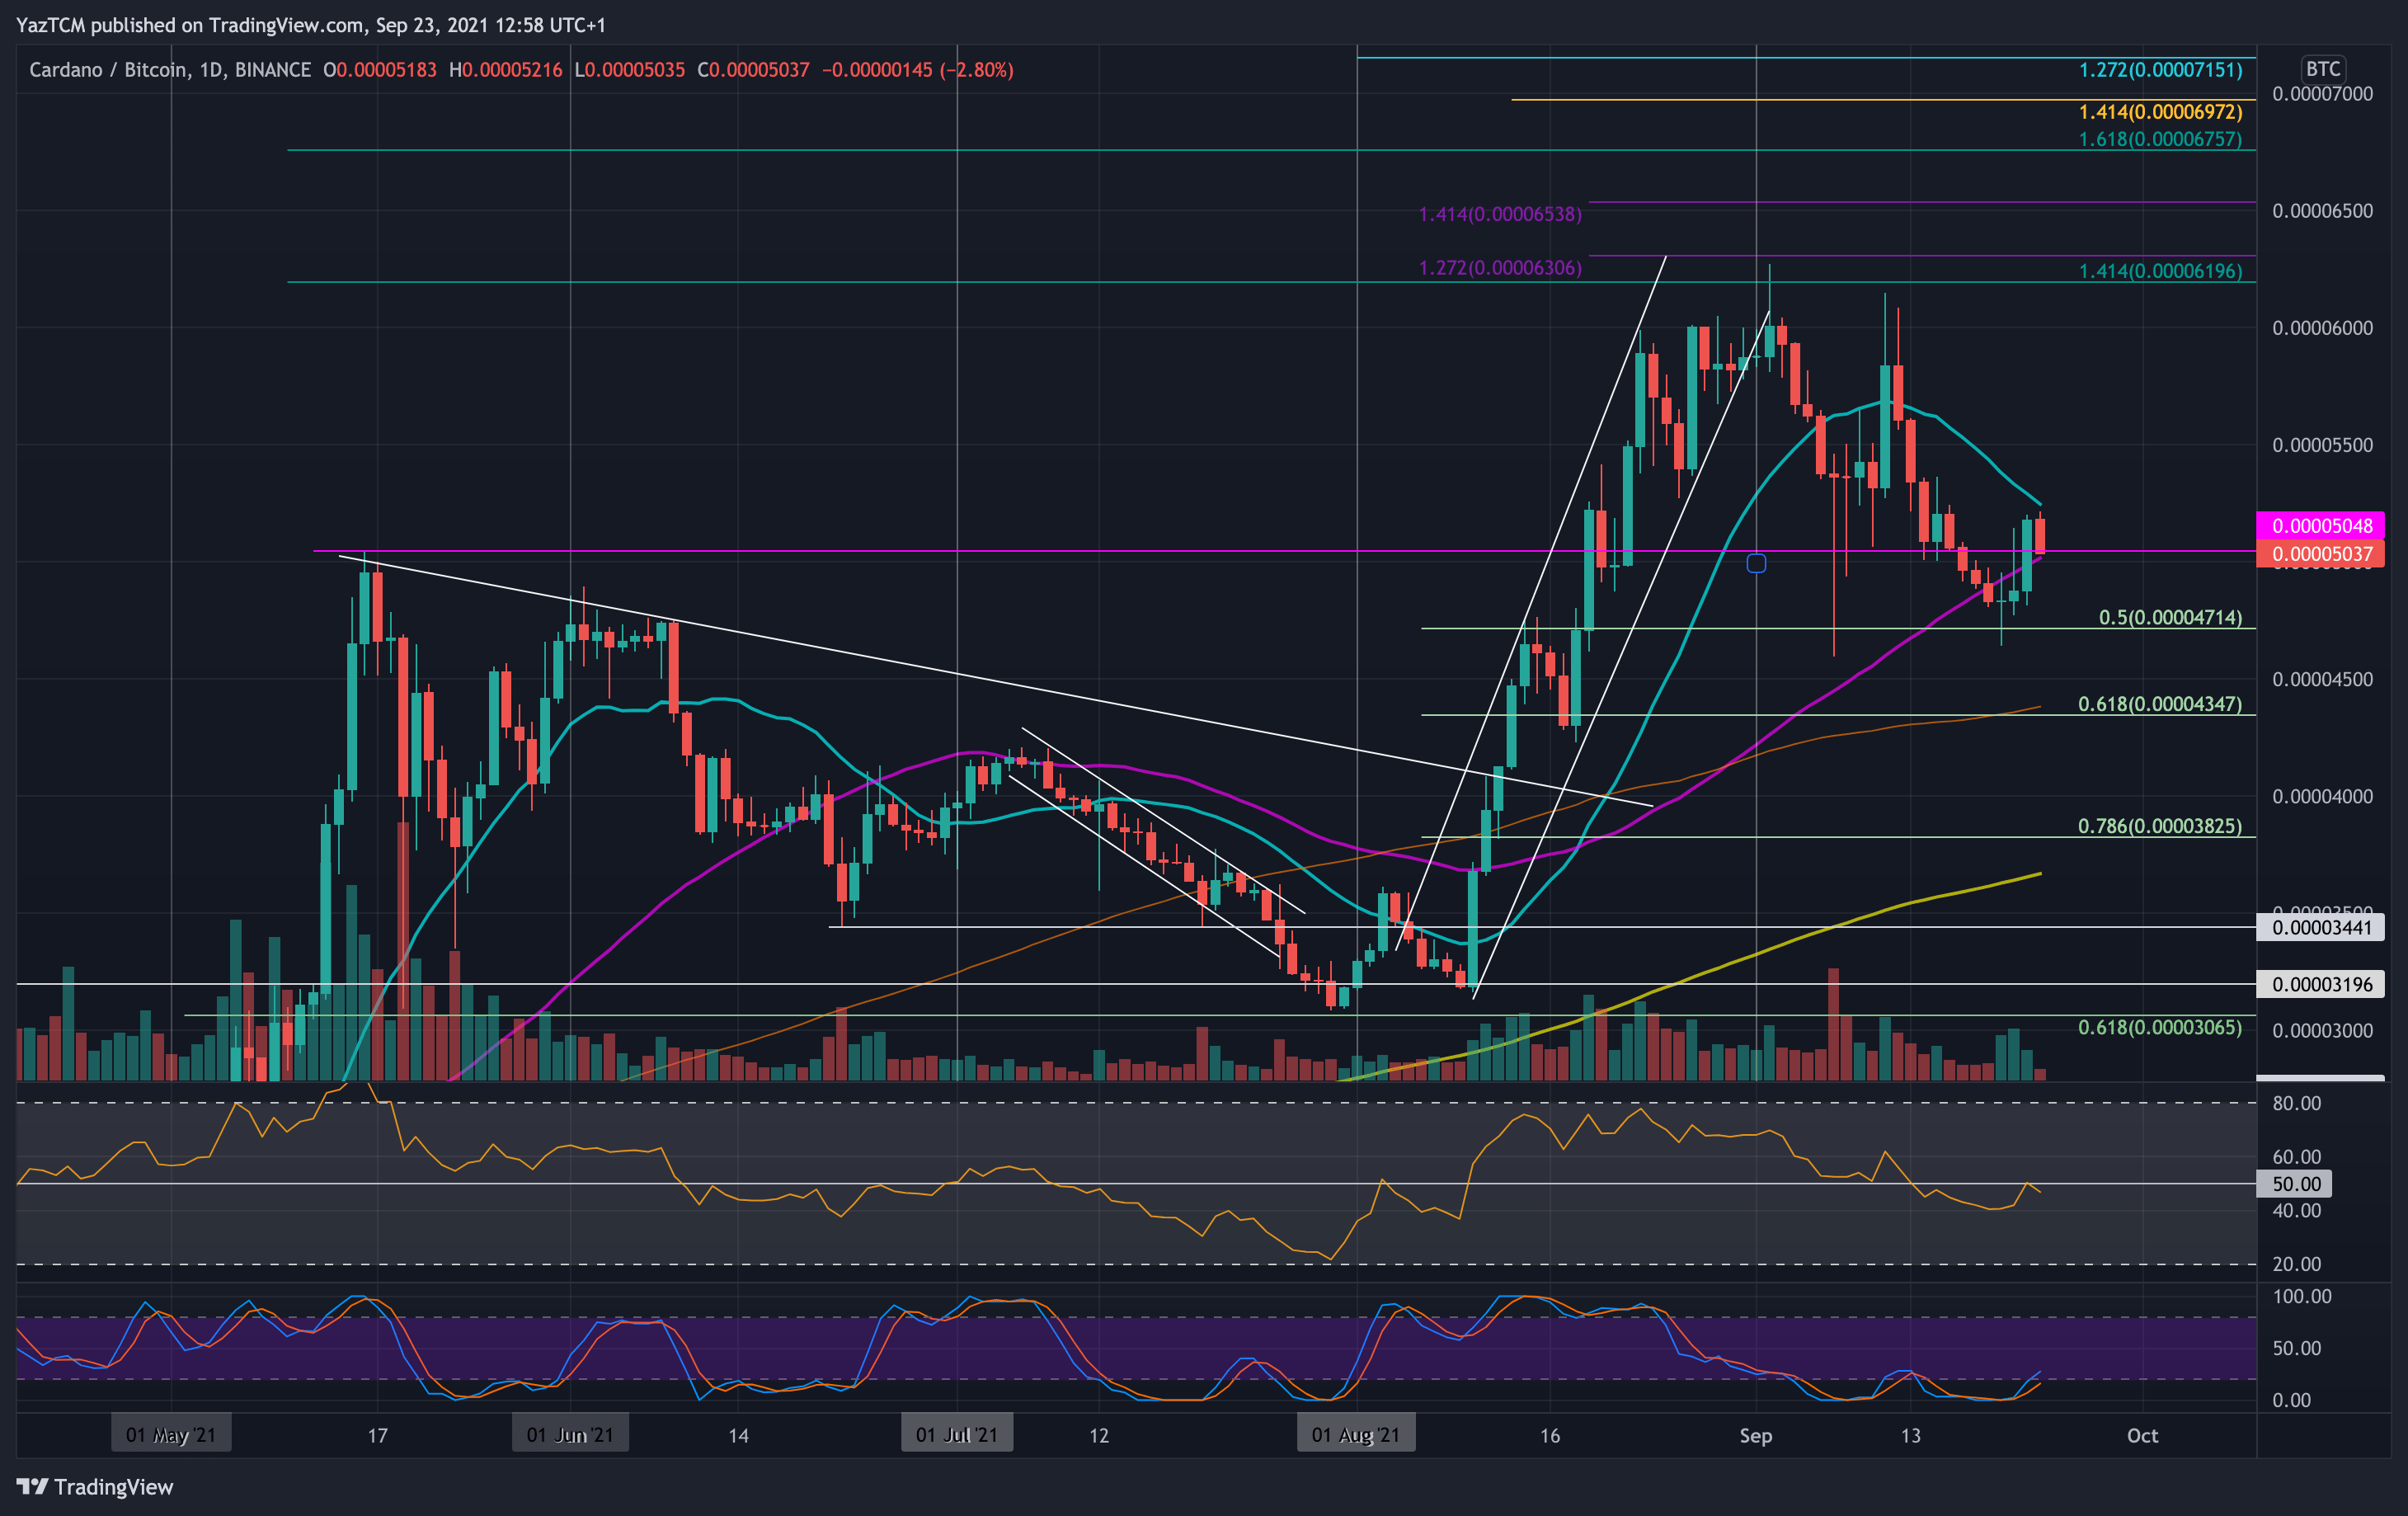
ADA-BTC Short Term Price Prediction
Looking ahead, the first resistance lies at 5200 SAT (20-day MA). This is followed by 5500 SAT, 6000 SAT, and 6300 SAT (1.272 Fib Extension).
On the other side, the first support lies at 5000 SAT (50-day MA). This is followed by 4800 SAT, 4714 SAT (.5 Fib0, 4500 SAT, and 4350 SAT (.618 Fib & 100-day MA).
The RSI remains beneath the midline and was recently rejected from the level, indicating the bears are still battling to push beneath 5000 SAT.