Cardano Price Analysis: ADA Recovers 20% in Days, Here’s the Next Target
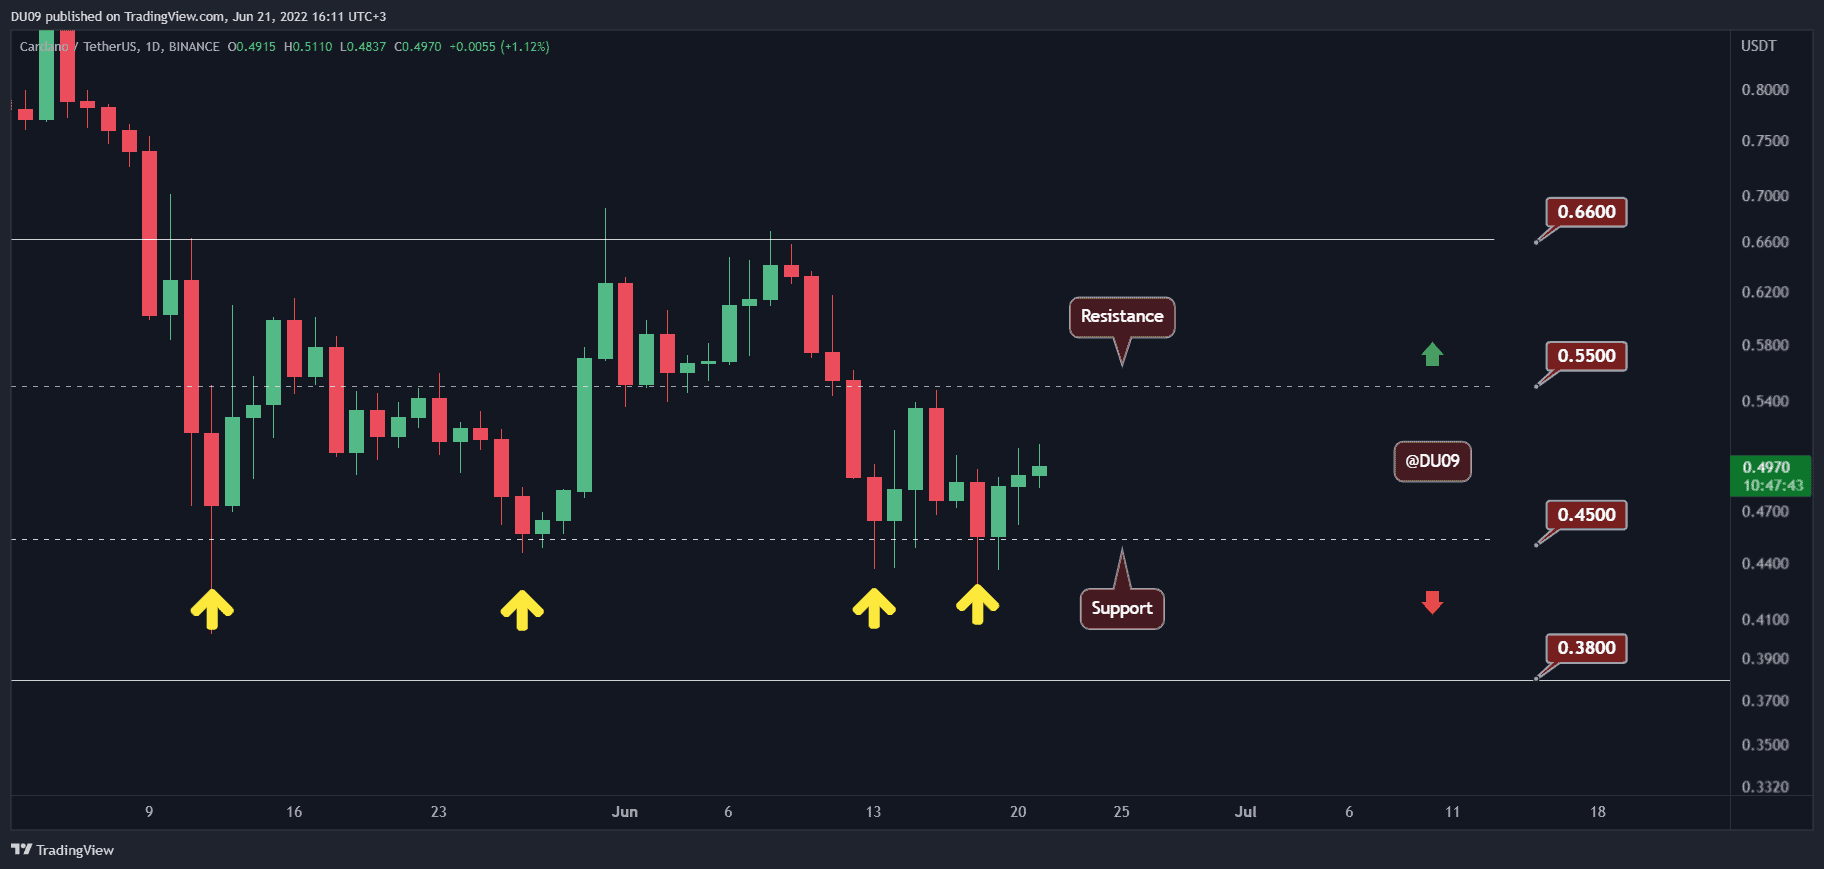
ADA managed to hold well at the key support on June 18th, and since then, the price has rallied by over 20%.
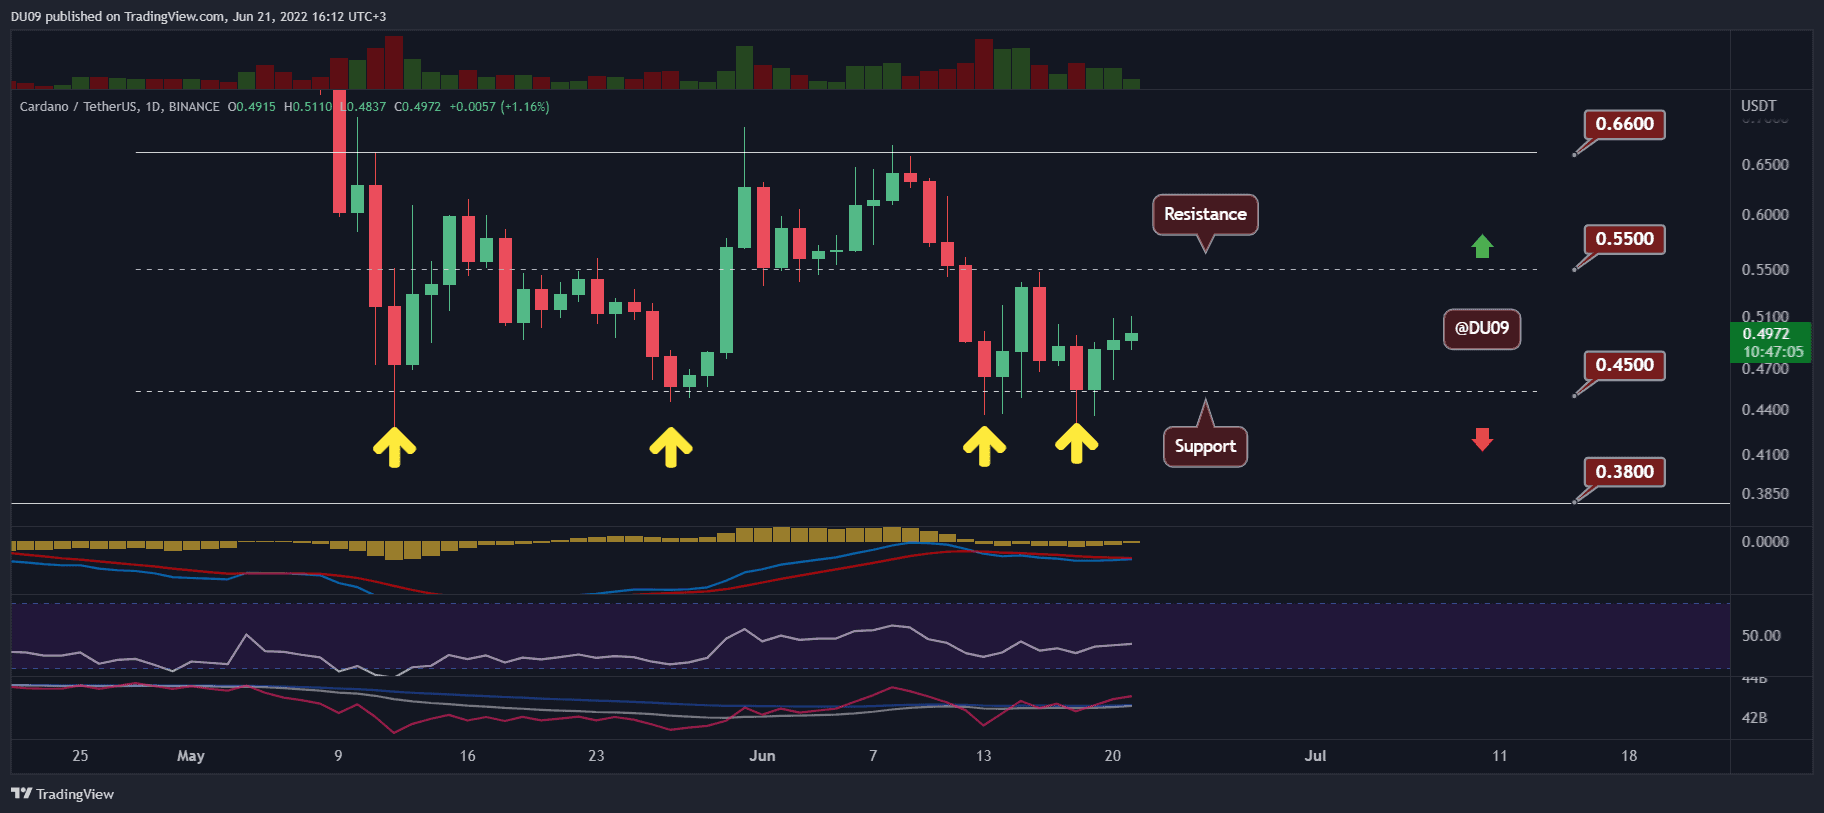
Key Support levels: $0.45, $0.38
Key Resistance levels: $0.45, $0.55
ADA is again moving towards the key resistance at $0.55 after four successful tests of the key support at $0.45. Buyers came in strong at this level which turned the price action around. The last time ADA attempted to break the key resistance, it was quickly rejected there.
Technical Indicators
Trading Volume: The buying volume is somewhat sustained, and it has managed to push the price above the key support. If this continues, ADA could soon test the key resistance.
RSI: The daily RSI managed to make a higher low and is found at 45 points at the time of this post. To have more confidence in the price action, the RSI has to make a higher high as well.
MACD: The daily MACD remains bearish, but a bullish crossover appears imminent if this buy volume is maintained. That could turn the price action bullish if confirmed.
Bias
The bias for ADA is neutral. A clean break of support or resistance is needed to change this bias.
Short-Term Prediction for ADA Price
ADA is on a path to test the key resistance at $0.55. If momentum picks up as the cryptocurrency’s price increases, then it could attempt a breakout and rally further to the next challenge at $0.66. For this to happen, the overall market has to enter a relief rally as otherwise, ADA may be stuck in its current range for a longer period of time.