Cardano Price Analysis: ADA Finds Support At Critical Level, Is $1 Retest Incoming?
Last Thursday, ADA plunged below key support; however, the Cardano native token was able to recover quickly. Since then, ADA saw a decent rebound with a long wick below the key support.
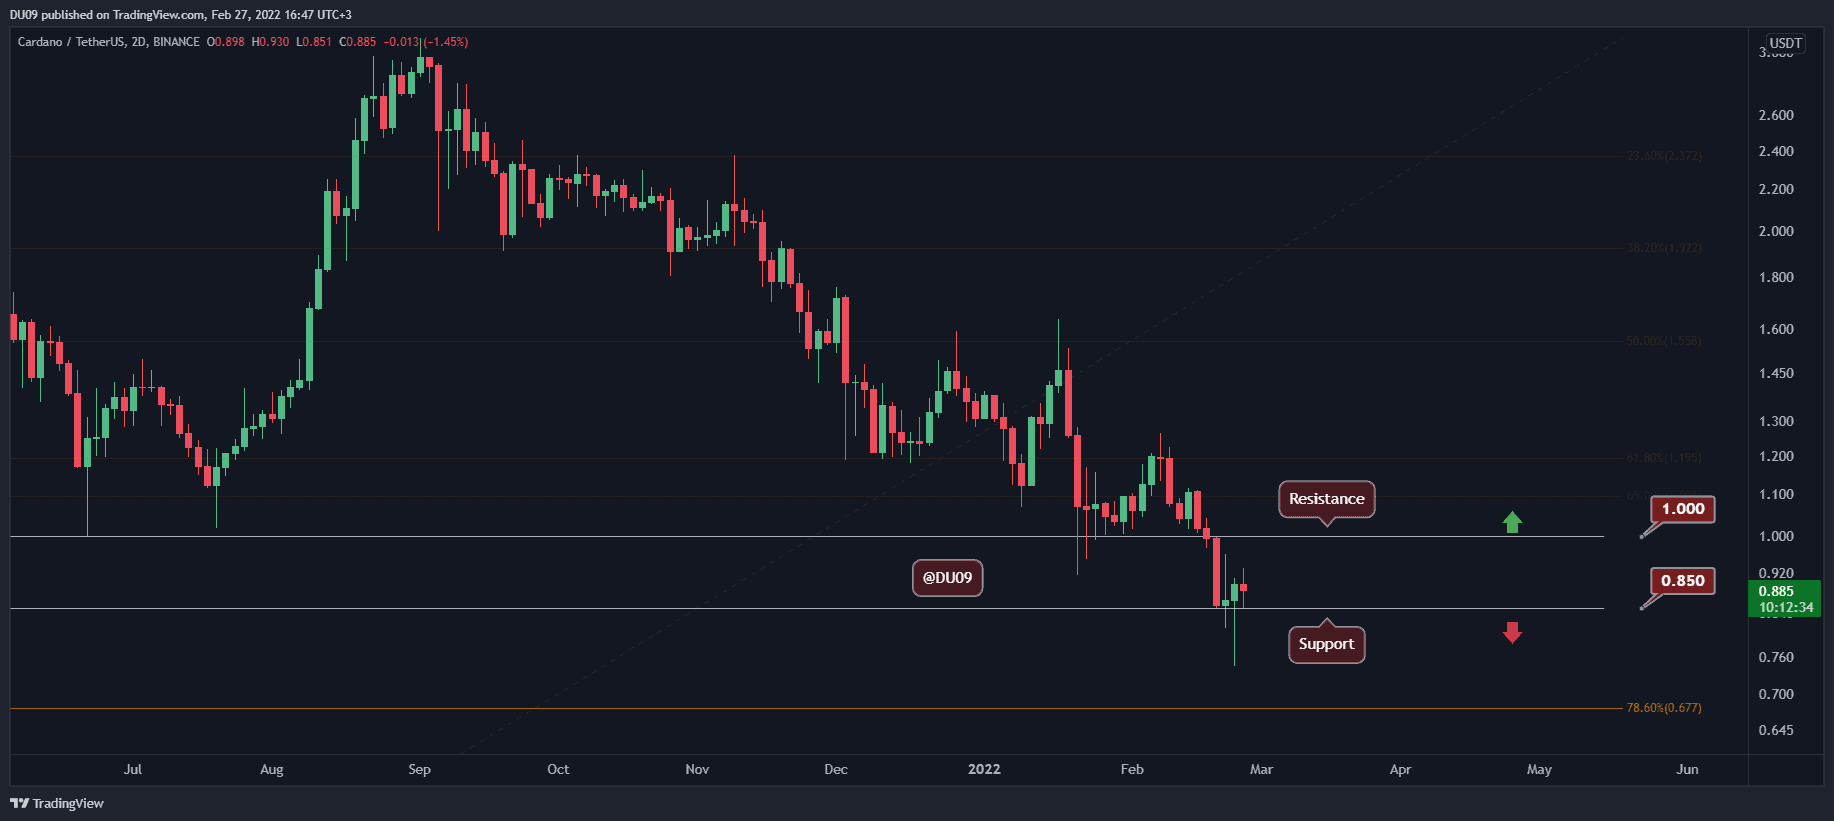
Key Support levels: $0.85
Key Resistance levels: $1, $1.1
In our most recent analysis, ADA wicked below the critical support at $0.85, but it managed to reclaim it and confirm this level as support since then. This is a textbook bullish price action, but the main question is if ADA can sustain above the critical support level.
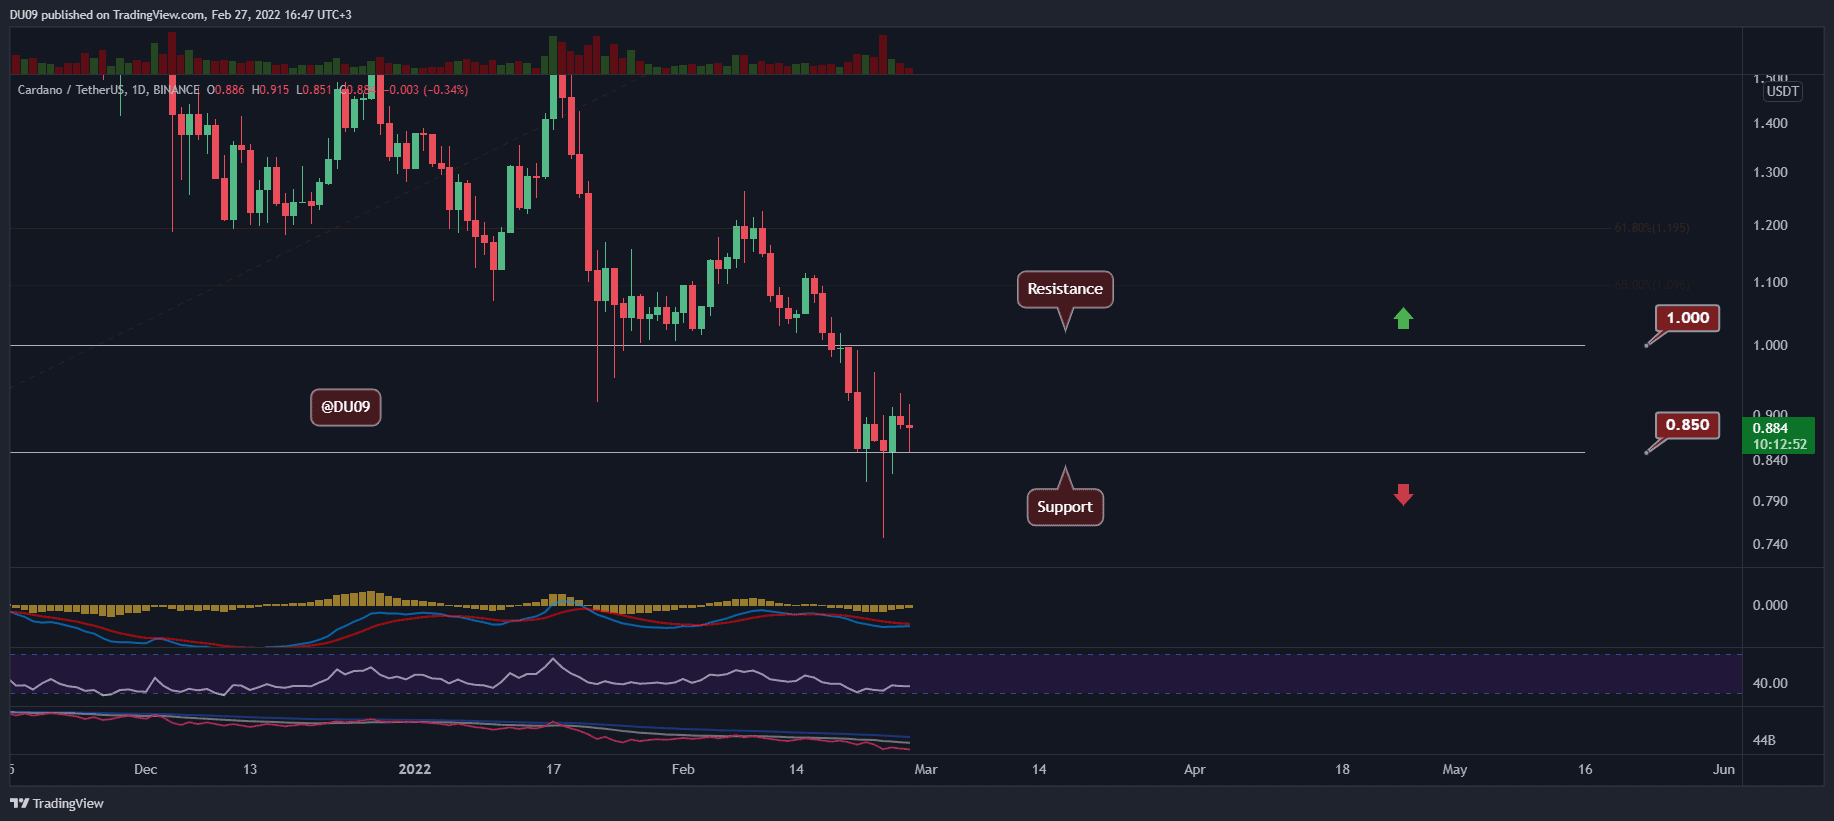
Technical Indicators
Trading Volume: Strong volume following this most recent recovery. The big question now is if ADA can sustain it and push the price towards the next key resistance amid $1.
RSI: The daily RSI is moving higher and closing on 40 points, making a higher low. Unless we see a bearish reversal soon, this might be a sign of optimism.
MACD: The daily MACD remains bearish, but the histogram makes higher lows. Momentum may soon shift in bulls’ favor after a prolonged correction that pushed ADA under $1.
Bias
The current bias is neutral. ADA has to break above $1 to turn bullish and maintain the key support at $0.85 on the other hand.
Short-Term Prediction for ADA Price
If it holds above the key support, the most likely scenario for ADA is to test the resistance at $1. That will be decisive for where ADA’s price is headed next. At the time of this post, the support at $0.85 was well defended by buyers.