Cardano Price Analysis: ADA Facing Key Resistance at $1, What’s Next?
Like the rest of the crypto markets, ADA had recently seen major volatility. The bears were able to push the price down to over 30% since April’s high of $1.25, but on the other hand, the bulls have not yet been able to break out of the descending channel that accompanied the price from the all-time high.
Technical Analysis
Technical Analysis By Grizzly
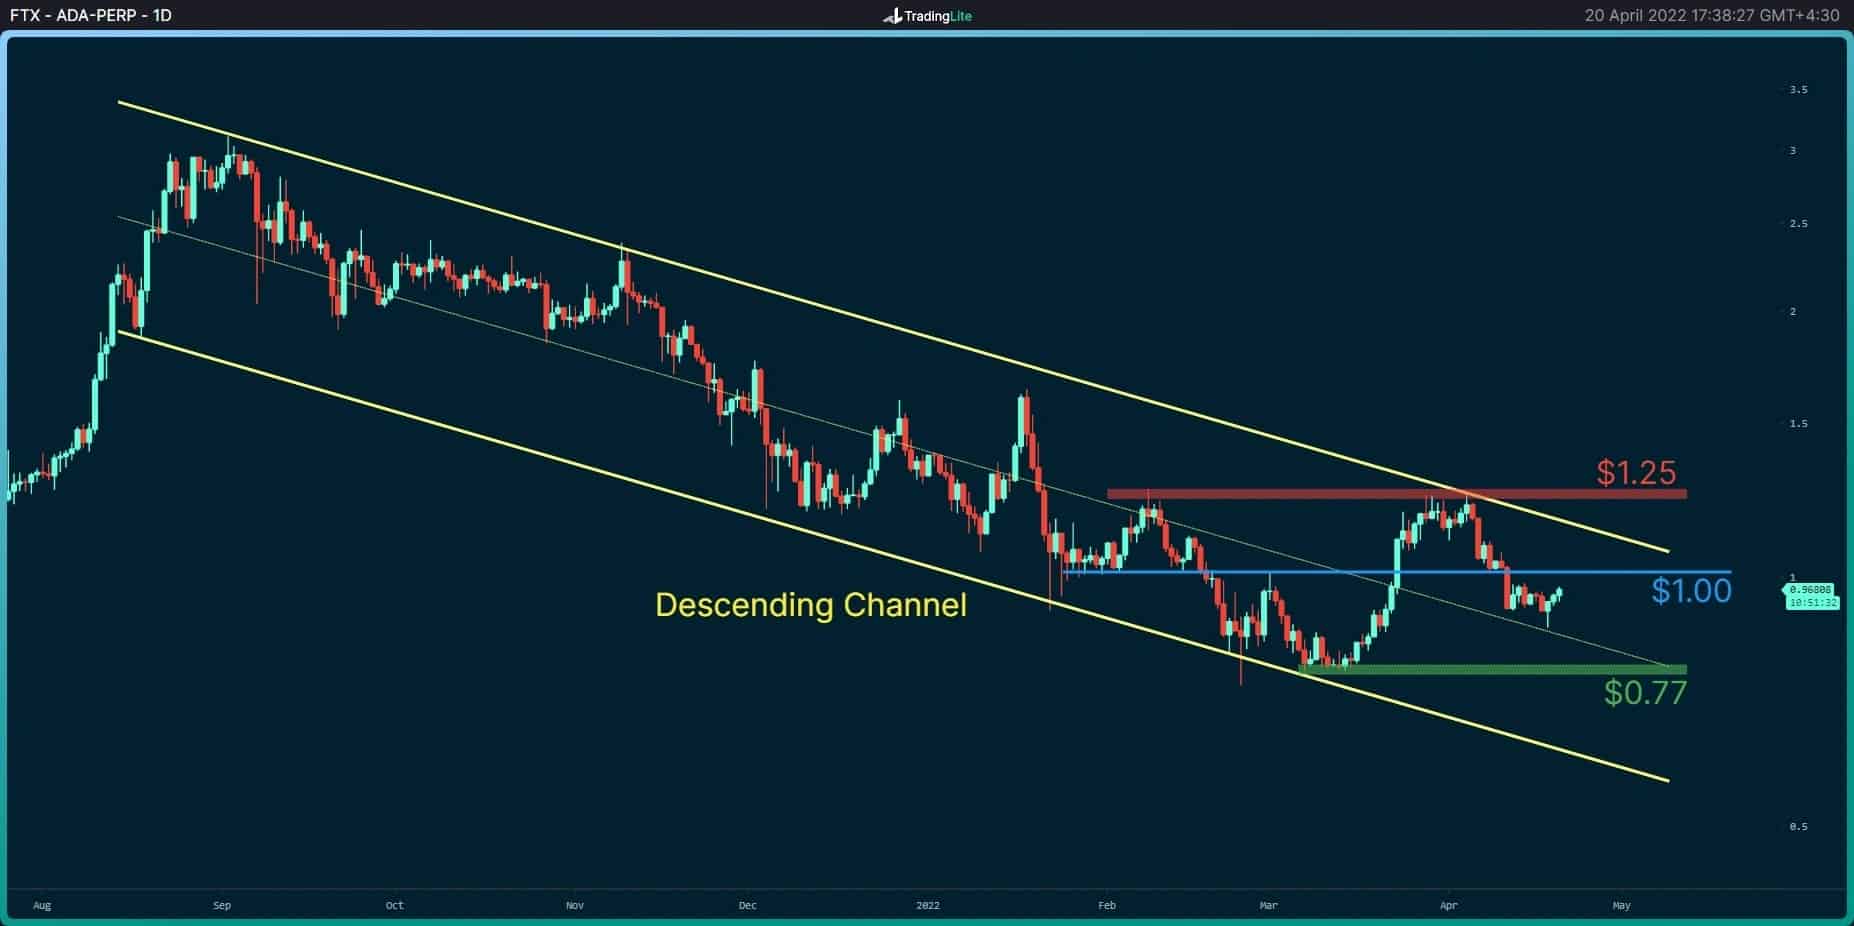
The Daily Chart:
After increasing 60% in March, Cardano holders hoped to reach higher levels. However, the bears took control of the market in early April.
Cardano is currently amid the channel’s midline, which has an intersection with horizontal support at $0.86. The first challenge for ADA is to break the critical resistance at $1. If this happens, ADA might soon target the top of the channel.
To turn mid-term bullish, ADA must be able to cross the resistance barrier at $1.25, which got rejected in the previous attempts. On the other hand, if the market continues to drop, the green level at $0.77 might serve as support.
Moving Averages:
MA20: $0.93 (acts as support)
MA50: $0.94 (acts as support)
MA100: $1.01 (acts as resistance)
MA200: $1.04 (acts as resistance)
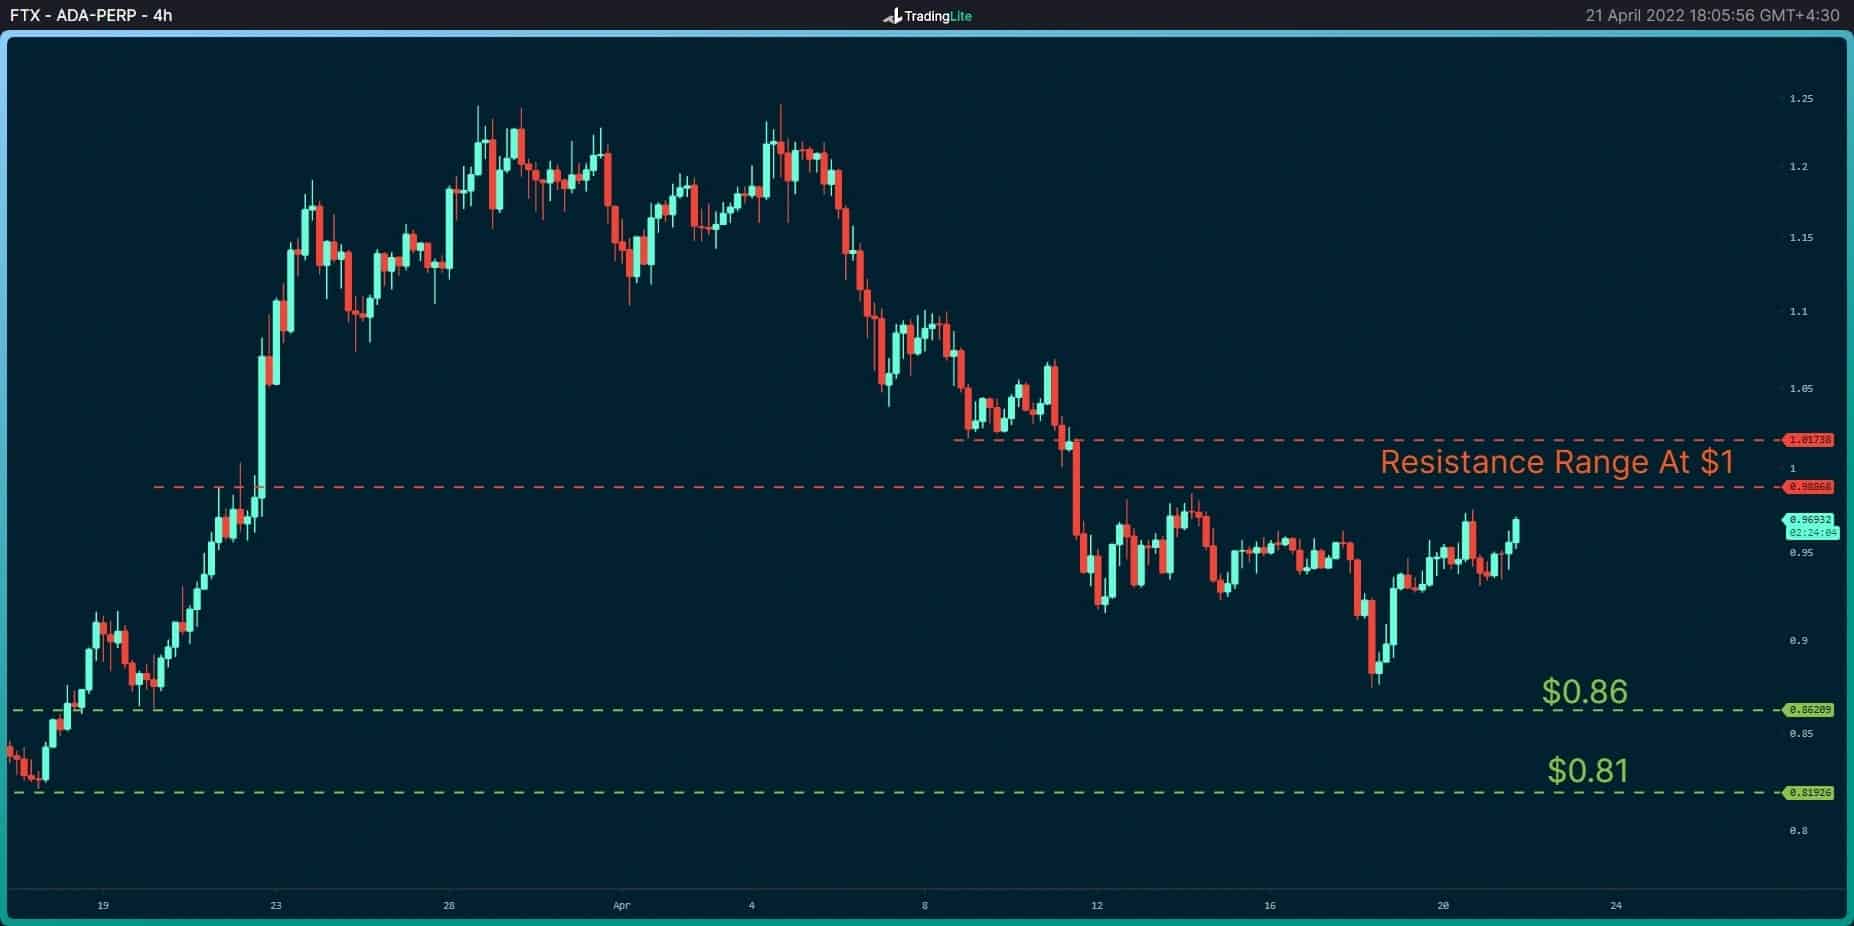
The 4-Hour Chart
On the 4-hour timeframe, ADA is trading below the resistance range (marked red) following a V-shape recovery. The most significant challenge right now is indeed to break this resistance.
On the other hand, the support range located at $0.81-$0.86 has proved to preserve the price well.