Cardano Price Analysis: ADA Downtrend Reversal Following 10% Daily Surge?
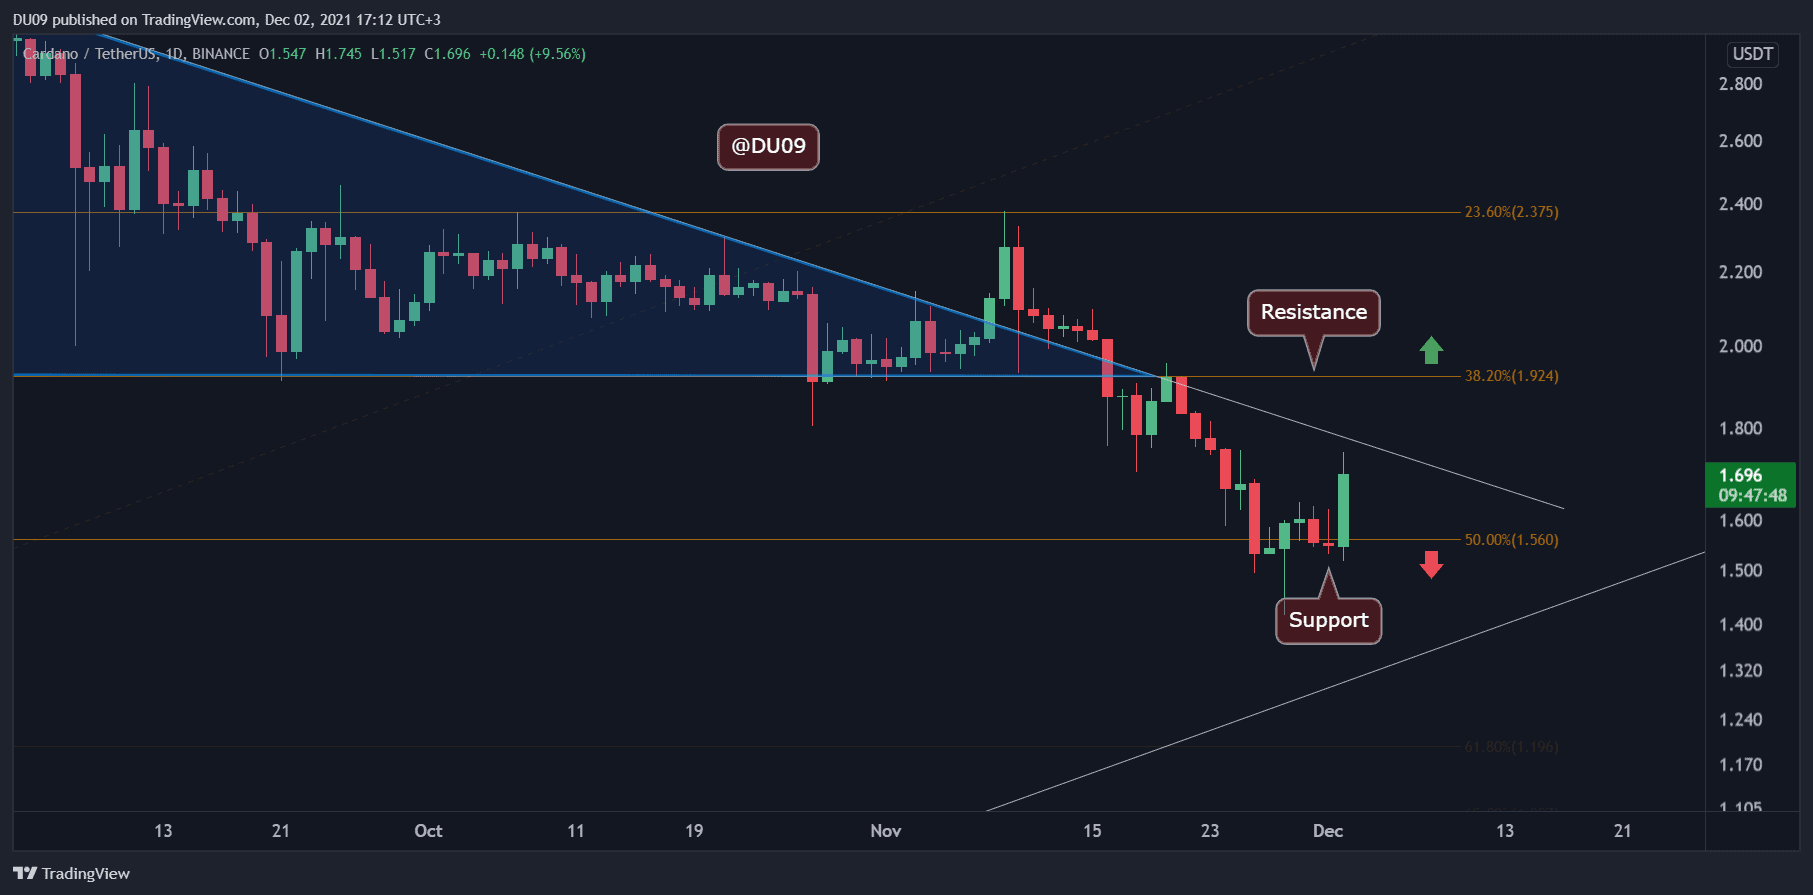
Key Support levels: $1.5
Key Resistance level: $1.9
ADA found good support on the $1.5 level, and today, bulls moved the price closer to the key resistance at $1.9. If they can sustain this momentum, then ADA has a good chance to break above it and start a new rally.
This price action is also a significant sign of strength, particularly when most of the market is in red today.

Technical Indicators
Trading Volume: Today, the volume was good from the bulls, and that pushed prices up in a very short period. It is important that they sustain this momentum over the coming days. Otherwise, this may be a one-off.
RSI: The daily RSI is curving back up and appears ready to run. This is indicative of a potential reversal in the downtrend. Once the RSI makes a higher high, then this can be confirmed.
MACD: The MACD on the daily timeframe appears a day away from doing a bullish cross on the moving averages and histogram. If that happens, it may be the impulse needed by bulls to seriously test the $1.9 resistance level.

Bias
The current ADA bias is neutral. To turn bullish, the MACD has to flip to the positive side, and the price action needs to send ADA above $1.9.
Short-Term Prediction for ADA Price
It appears that the bulls may be plotting an attack of the $1.9 resistance level, but until then, it’s important to remain vigilant and be cautious of some serious incoming volatility.


