Cardano Price Analysis: ADA at Decision Point, Huge Move Incoming?
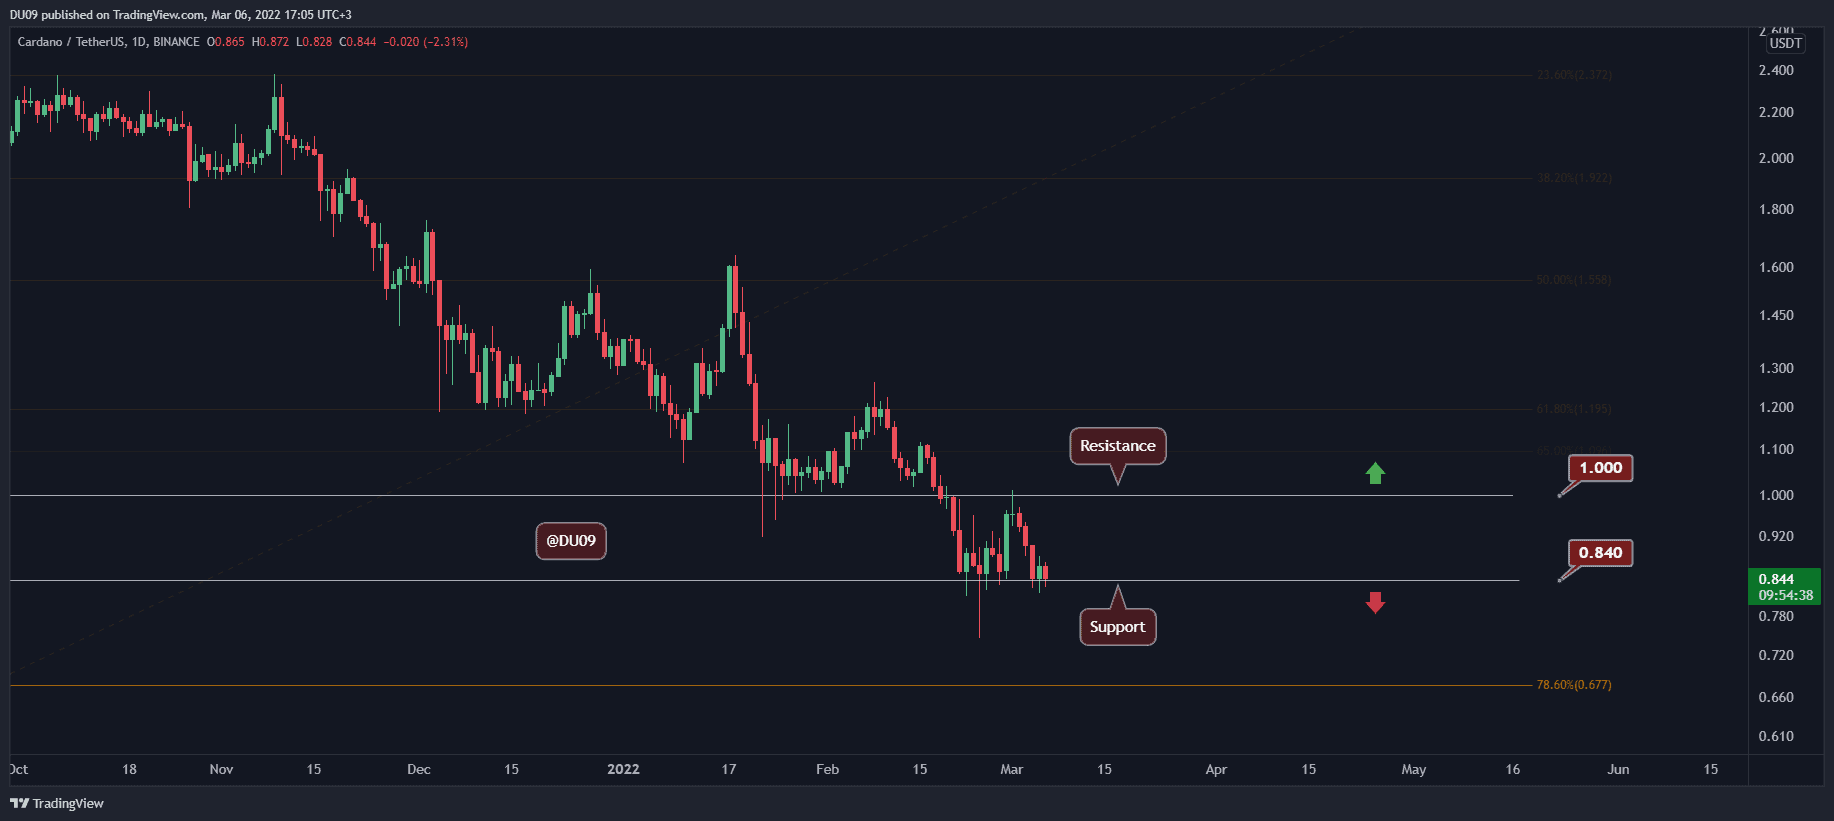
ADA’s price had found solid support upon the critical level at $0.84 and was managed to hold it for the past several days, also unable to move higher. This consolidation is likely to end sooner or later with a huge move.
Key Support levels: $0.84, $0.68
Key Resistance levels: $1, $1.1
As seen on the chart below, after getting rejected last week trying to break above the $1 key resistance level, ADA’s price quickly retraced down to retest the $0.84 mark. If buyers cannot push the price higher soon, then sellers may take the opportunity and break below the key support level, targeting the next major support at $0.68.

Technical Indicators
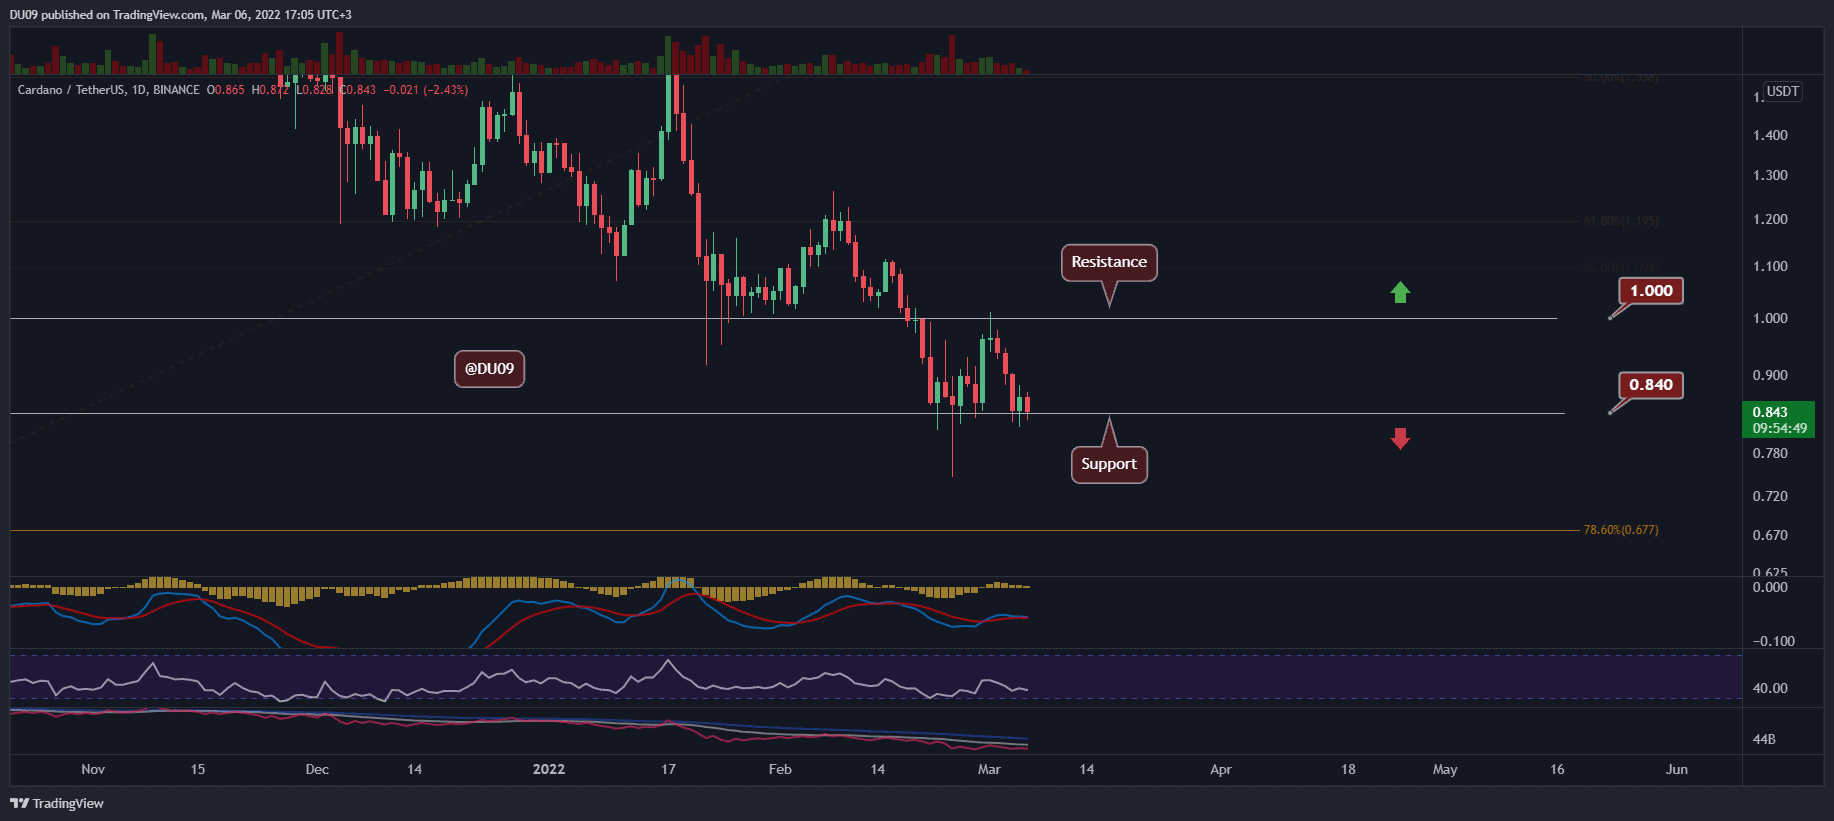
Trading Volume: The volume was very low over the past two days. Watch the price action and volume closely on Monday, as the new week starts. ADA will likely break lower if fear persists in the markets due to the ongoing Russia-Ukraine war.
RSI: The daily RSI has been making higher lows since it touched 30 points but was unable to make a higher high. This puts ADA at a decision point.
MACD: The daily MACD is quickly approaching a bearish crossover. If this occurs, then ADA may fall to the next key support level.

Bias
The current bias is neutral.
Short-Term Prediction for ADA Price
ADA appears weak and without seeing increased demand, the $0.84 support likely breakdown. The current crypto market sentiment is rather bearish which might push ADA lower if Monday’s price action opens in red.


