Cardano Bounces 4% Daily, Here’s the Main Challenge (ADA Price Analysis)
The situation in the global markets remains uncertain. The Federal Reserve will announce the interest rate today at the FOMC meeting, and many traders and investors are looking forward to the outcome.
Technical Analysis
By Grizzly
The Daily Chart
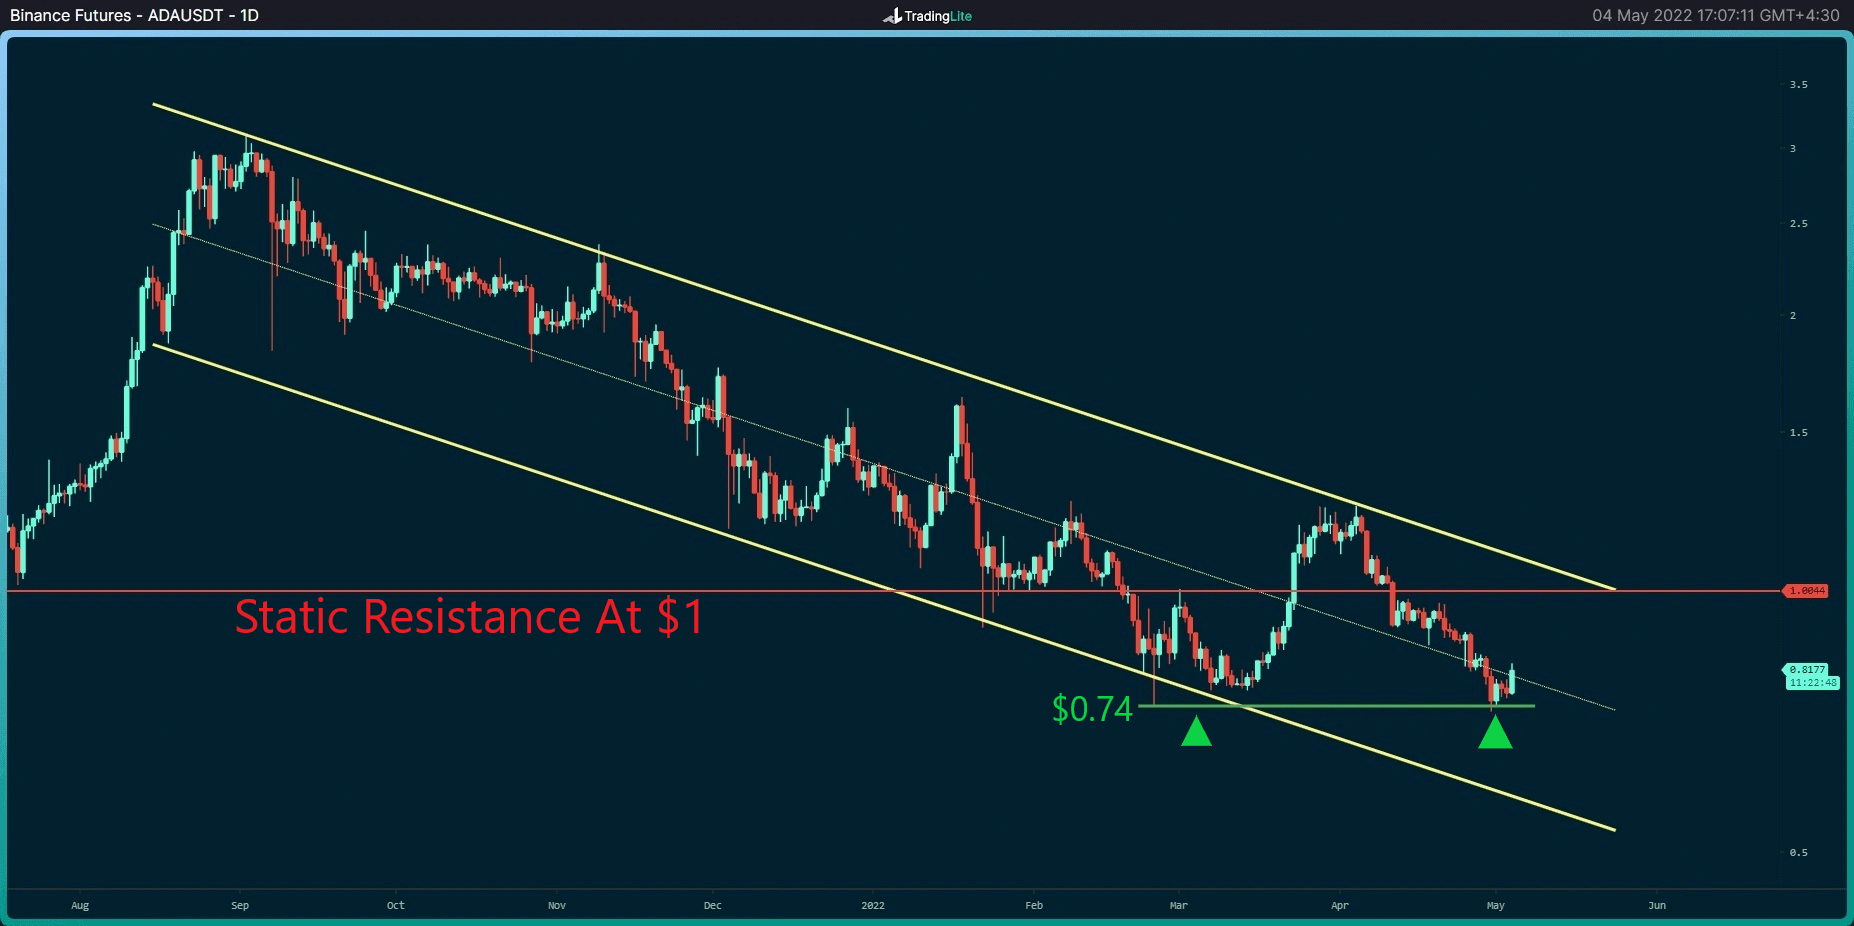
On the daily timeframe, Cardano continues to move down inside the descending channel (in yellow). The bears were able to push the price down from the highest level at $1.25 in early April, and the static support at $0.74 (in green) prevented ADA from dropping further.
Technically, the cryptocurrency is forming a double bottom pattern that is considered bullish. This pattern has the potential to push the price up to the static resistance at $1. However, the main challenge right now is the Federal Reserve’s policy of trying to reduce inflation. If the bulls can break out of the descending channel and form a higher high above $1.25, the way will be clear to reach higher levels.
Moving Averages:
MA20: $0.70
MA50: $0.76
MA100: $0.74
MA200: $0.85
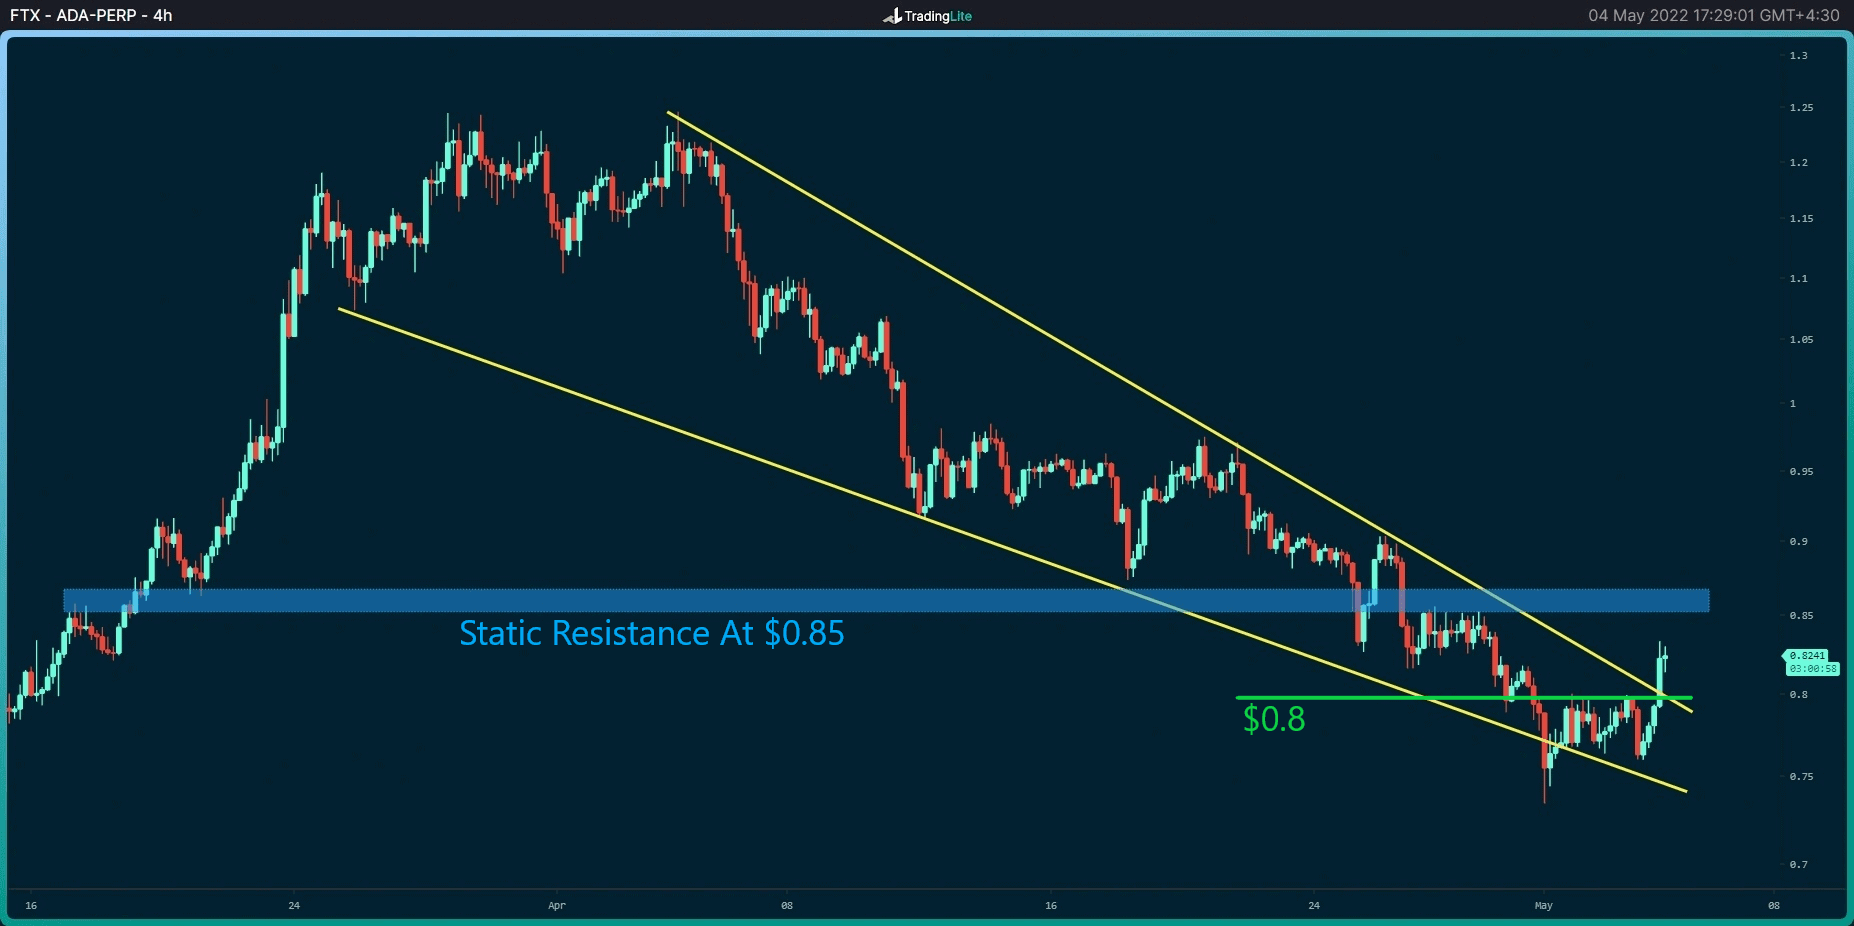
The 4-Hour Chart
On the 4-hour timeframe, Cardano was able to break out of a falling wedge (in yellow) that accompanied the price since the local top at $1.25 was recorded. If ADA can return above the horizontal resistance at $0.85, one can expect a short-term uptrend with the $1 target to be challenged. The level at $0.8 seems likely to be retested in the short term.