Calm Before the Storm? XRP Consolidates Below Critical Level (Ripple Price Analysis)
Ripple’s price has been ranging in a tight area over the past few weeks as the markets are heading into 2023. This might as well be a signal that the price is about to experience an outburst of volatility, as periods of prolonged calmness in the market are typically a precursor to that.
Technical Analysis
By: Edris
XRP/USDT Daily Chart:
On the daily chart, the price has been consolidating below the 50-day moving average for a while now. The 50-day and 100-day moving averages, located around the $0.37 and $0.39 levels, respectively, are currently flat after printing a bearish cross.
In case the price finally reaches and breaks above the 50-day moving average, the 200-day moving average and the $0.43 resistance area would be the next potential targets. On the other hand, if the price begins to fall, the key $0.3 support level would come into play once more.
A bearish breakout from this level would likely be disastrous for XRP, as a further crash would be expected.

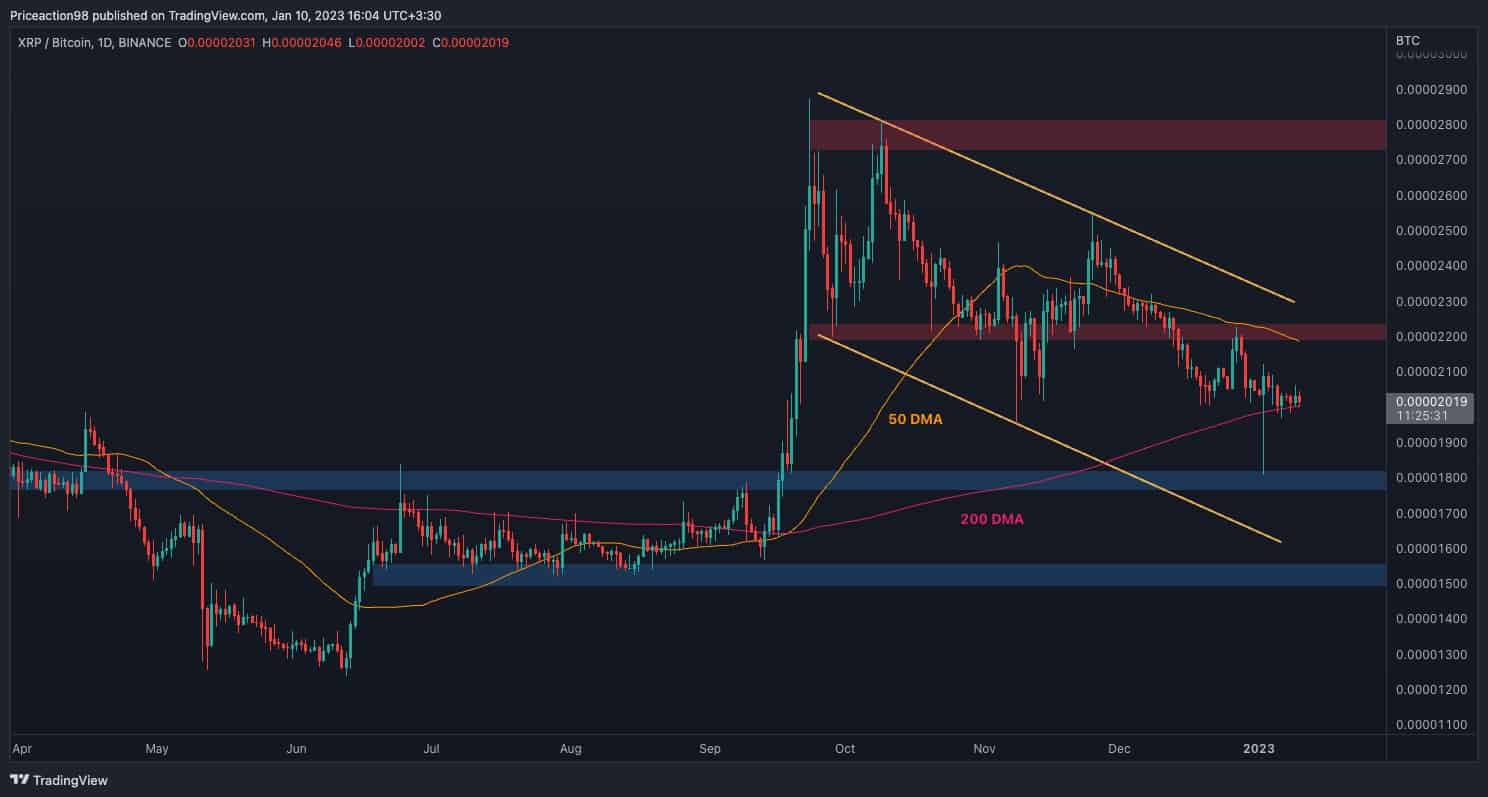
XRP/BTC Daily Chart:
Looking at the BTC paired chart, the price is yet to break out from either side of the large descending channel. The 200-day moving average has been holding the price for quite some time while being constantly tested over the last few days.
In case of a bullish rebound from the 200-day, the 50-day moving average trending near the significant 0.000022 SAT resistance level would be the next obstacle before the higher boundary of the channel comes into play. On the contrary, a breakdown of the 200-day moving average would likely lead to a rapid drop toward the 0.000018 SAT level in the short term.
To conclude, while the price action has been offering almost no clues on the direction of the next significant move, bullish and bearish scenarios have both been discussed in this analysis.
The post Calm Before the Storm? XRP Consolidates Below Critical Level (Ripple Price Analysis) appeared first on CryptoPotato.

