Calm Before the Storm: DOT Ready to Rally to $9? (Polkadot Price Analysis)
Polkadot’s price has been consolidating over the past couple of months, following a steep decline in early April. Yet, things might be changing for the better.
Technical Analysis
By TradingRage
The Daily Chart
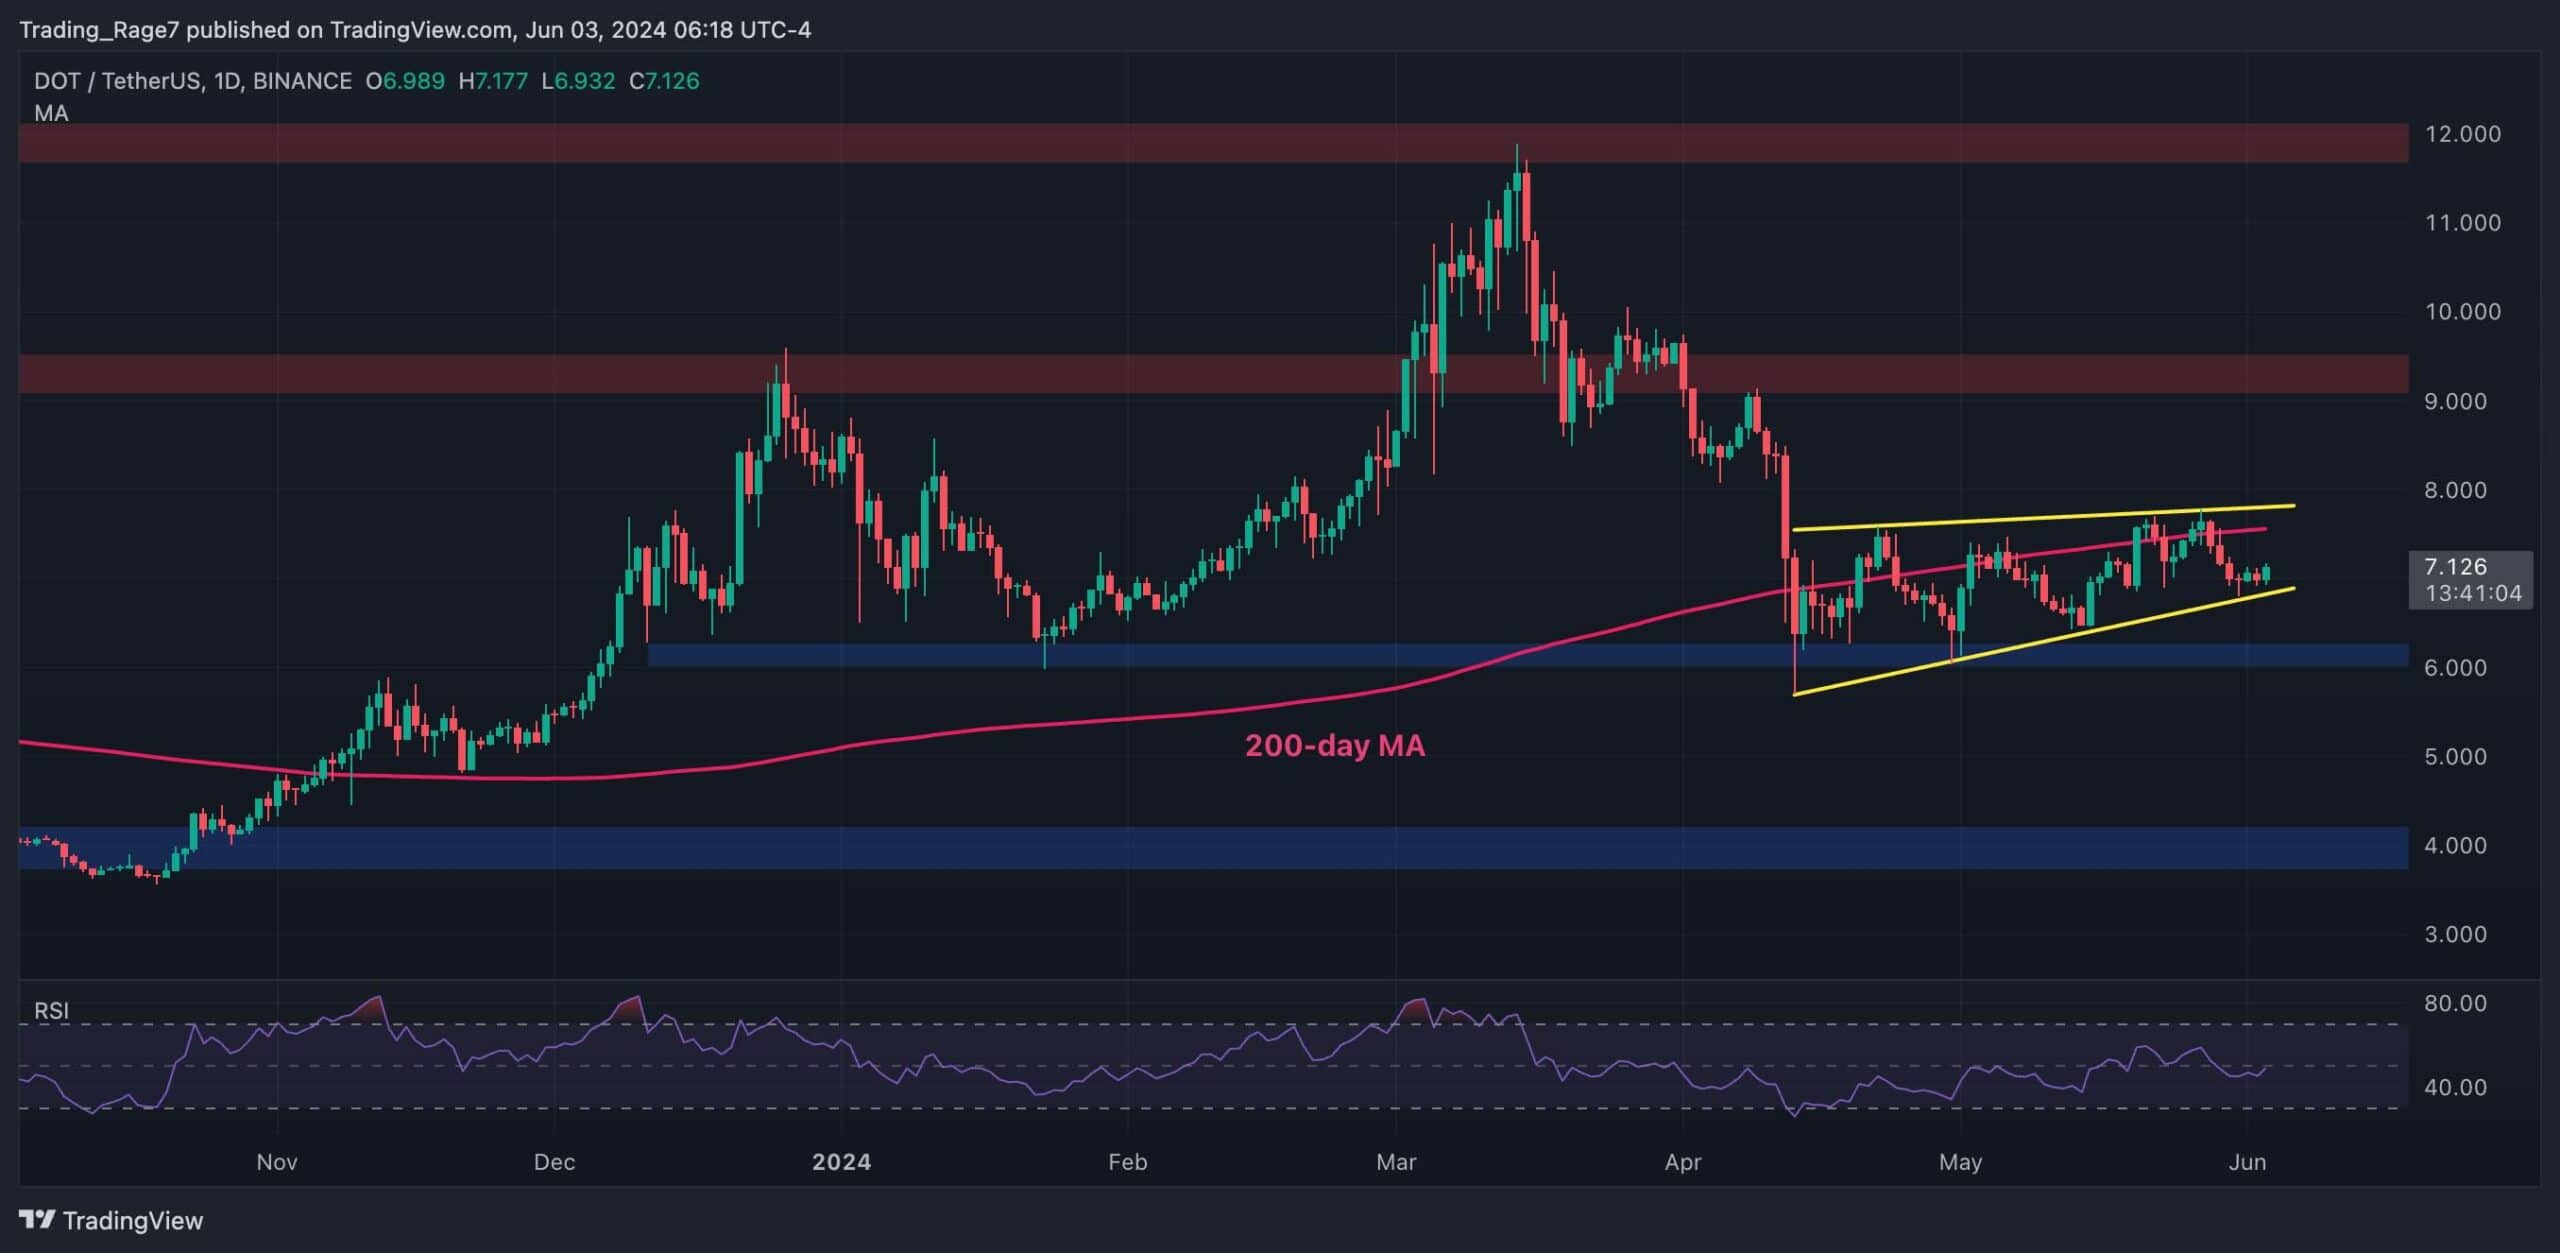
On the daily chart, the cryptocurrency has been range-bound inside a rising wedge pattern. This is a classical bearish reversal or continuation pattern that would be validated if the price breaks it to the downside. Meanwhile, the market has also been hovering around the 200-day moving average, making gradual higher highs and lows.
Therefore there is also a considerable possibility for DOT to break the pattern to the upside and rally toward the $9 resistance level. Yet, everything depends on the direction of the breakout from the pattern.
The 4-Hour Chart
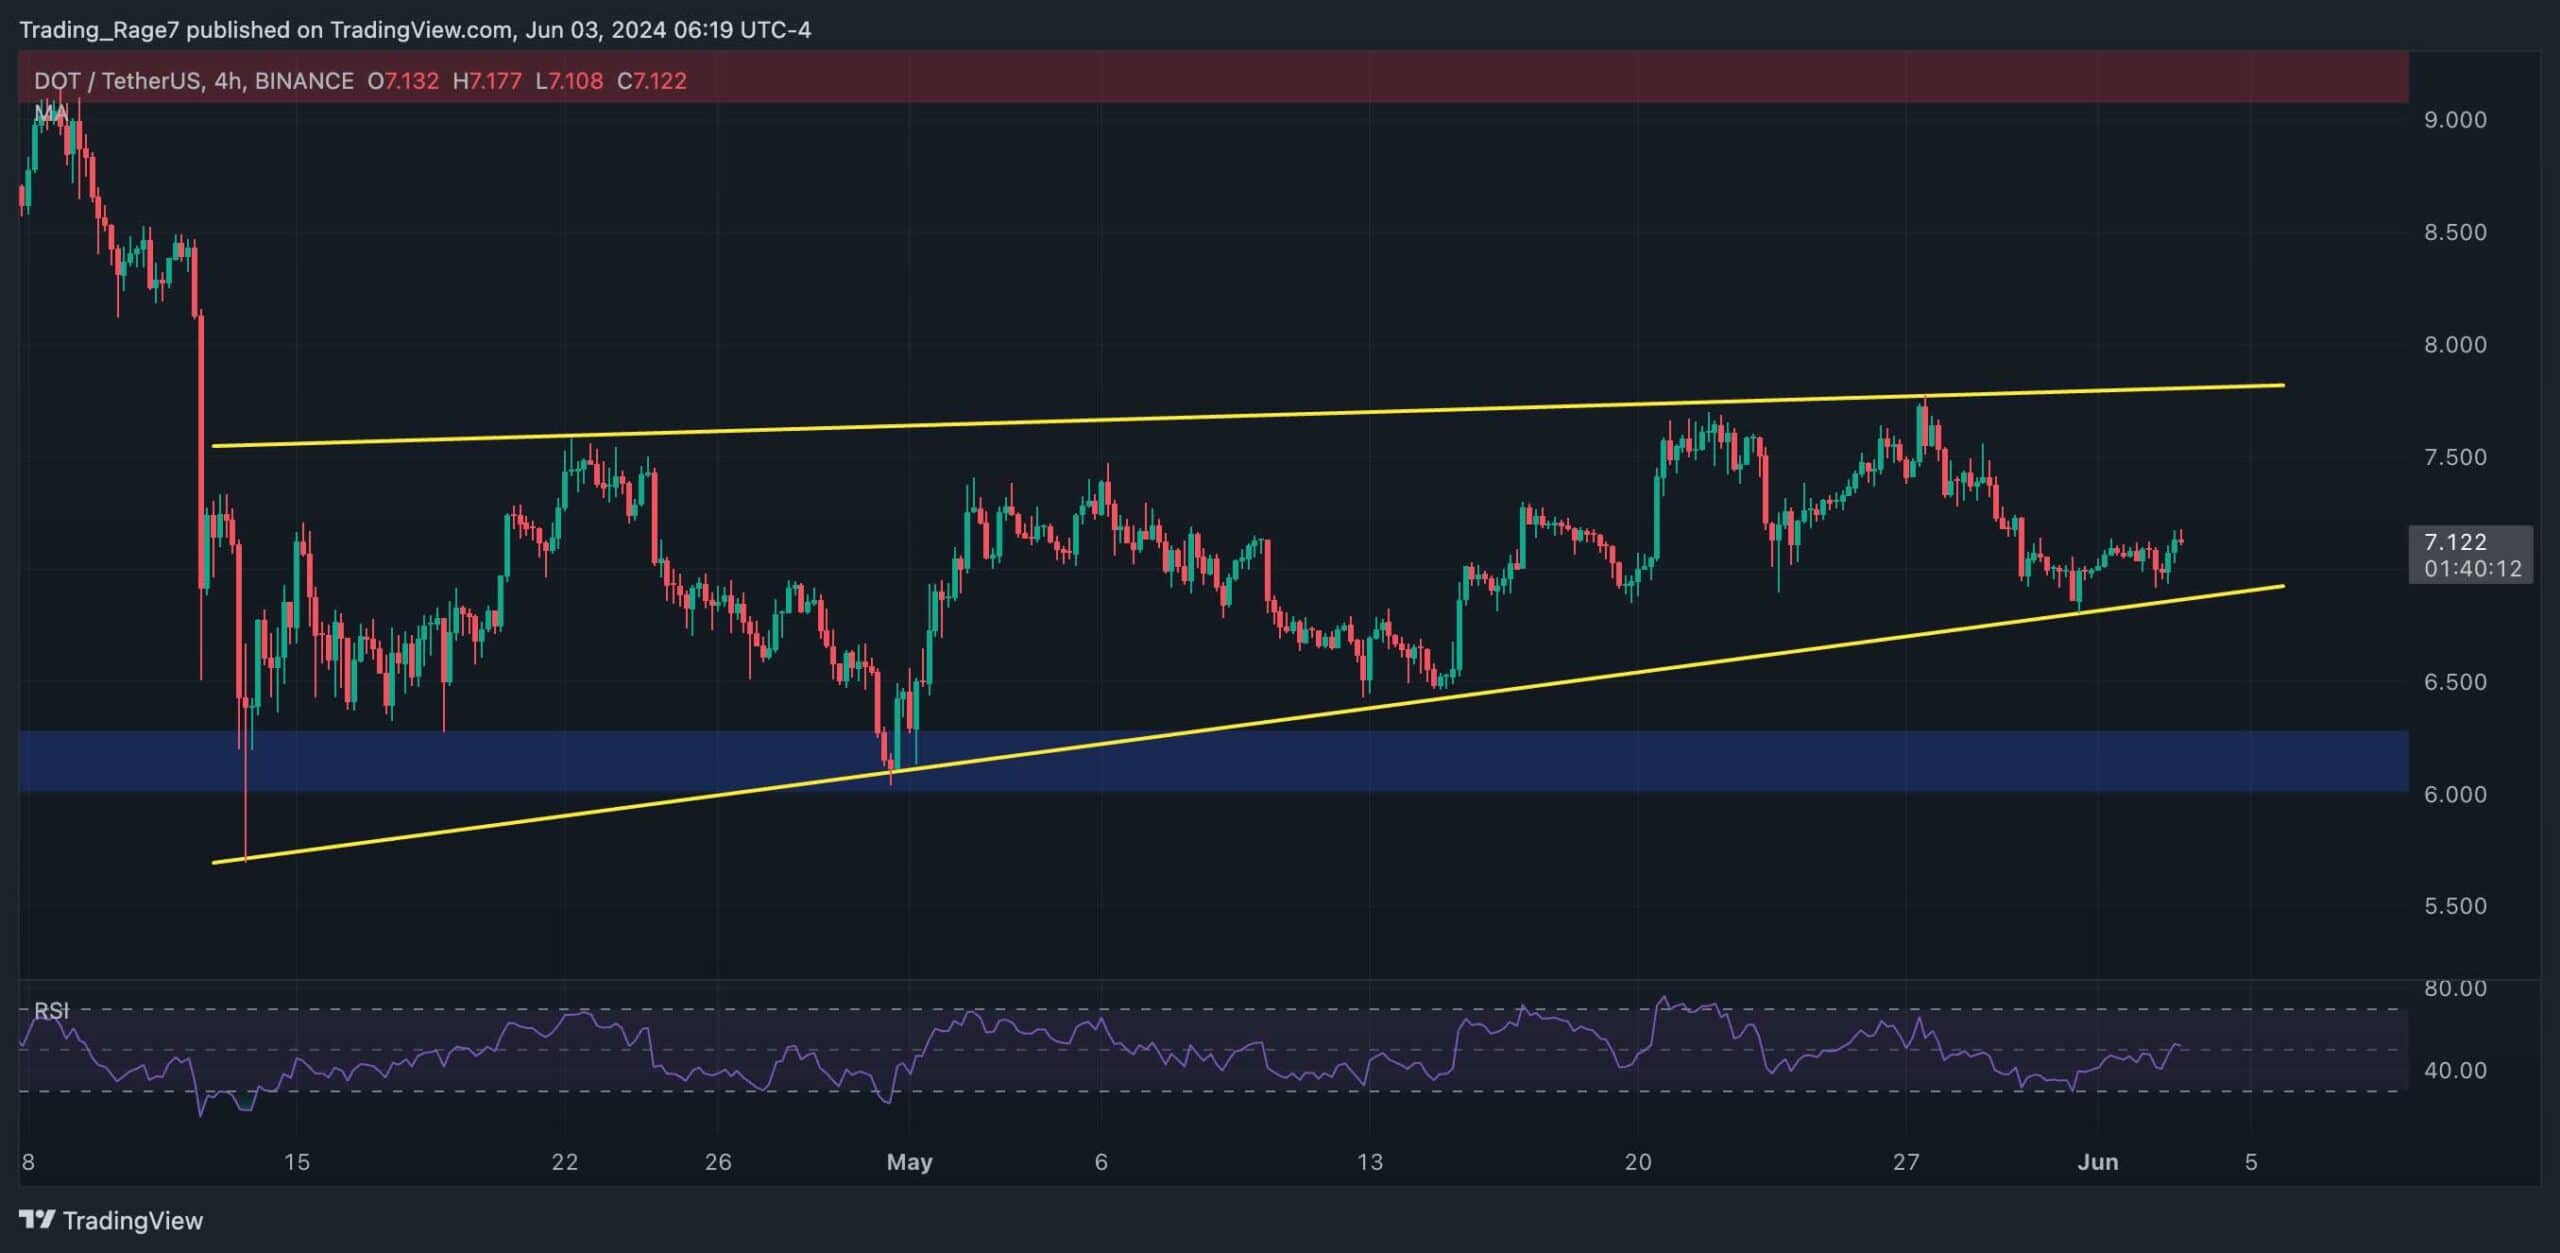
Looking at the 4-hour chart, the price action inside the rising wedge pattern becomes much more clear. DOT has tested both the higher and the lower boundary of the channel multiple times now. It is currently rebounding from the lower trendline and gaining momentum to move toward the higher one.
If successful, the pattern is likely to get broken this time, and a new bullish wave might begin. However, if somehow the price crashes to the downside, a decline toward the $6 level and lower would be highly probable.
Futures Market Analysis
By TradingRage
Polkadot Binance Liquidation Heatmap
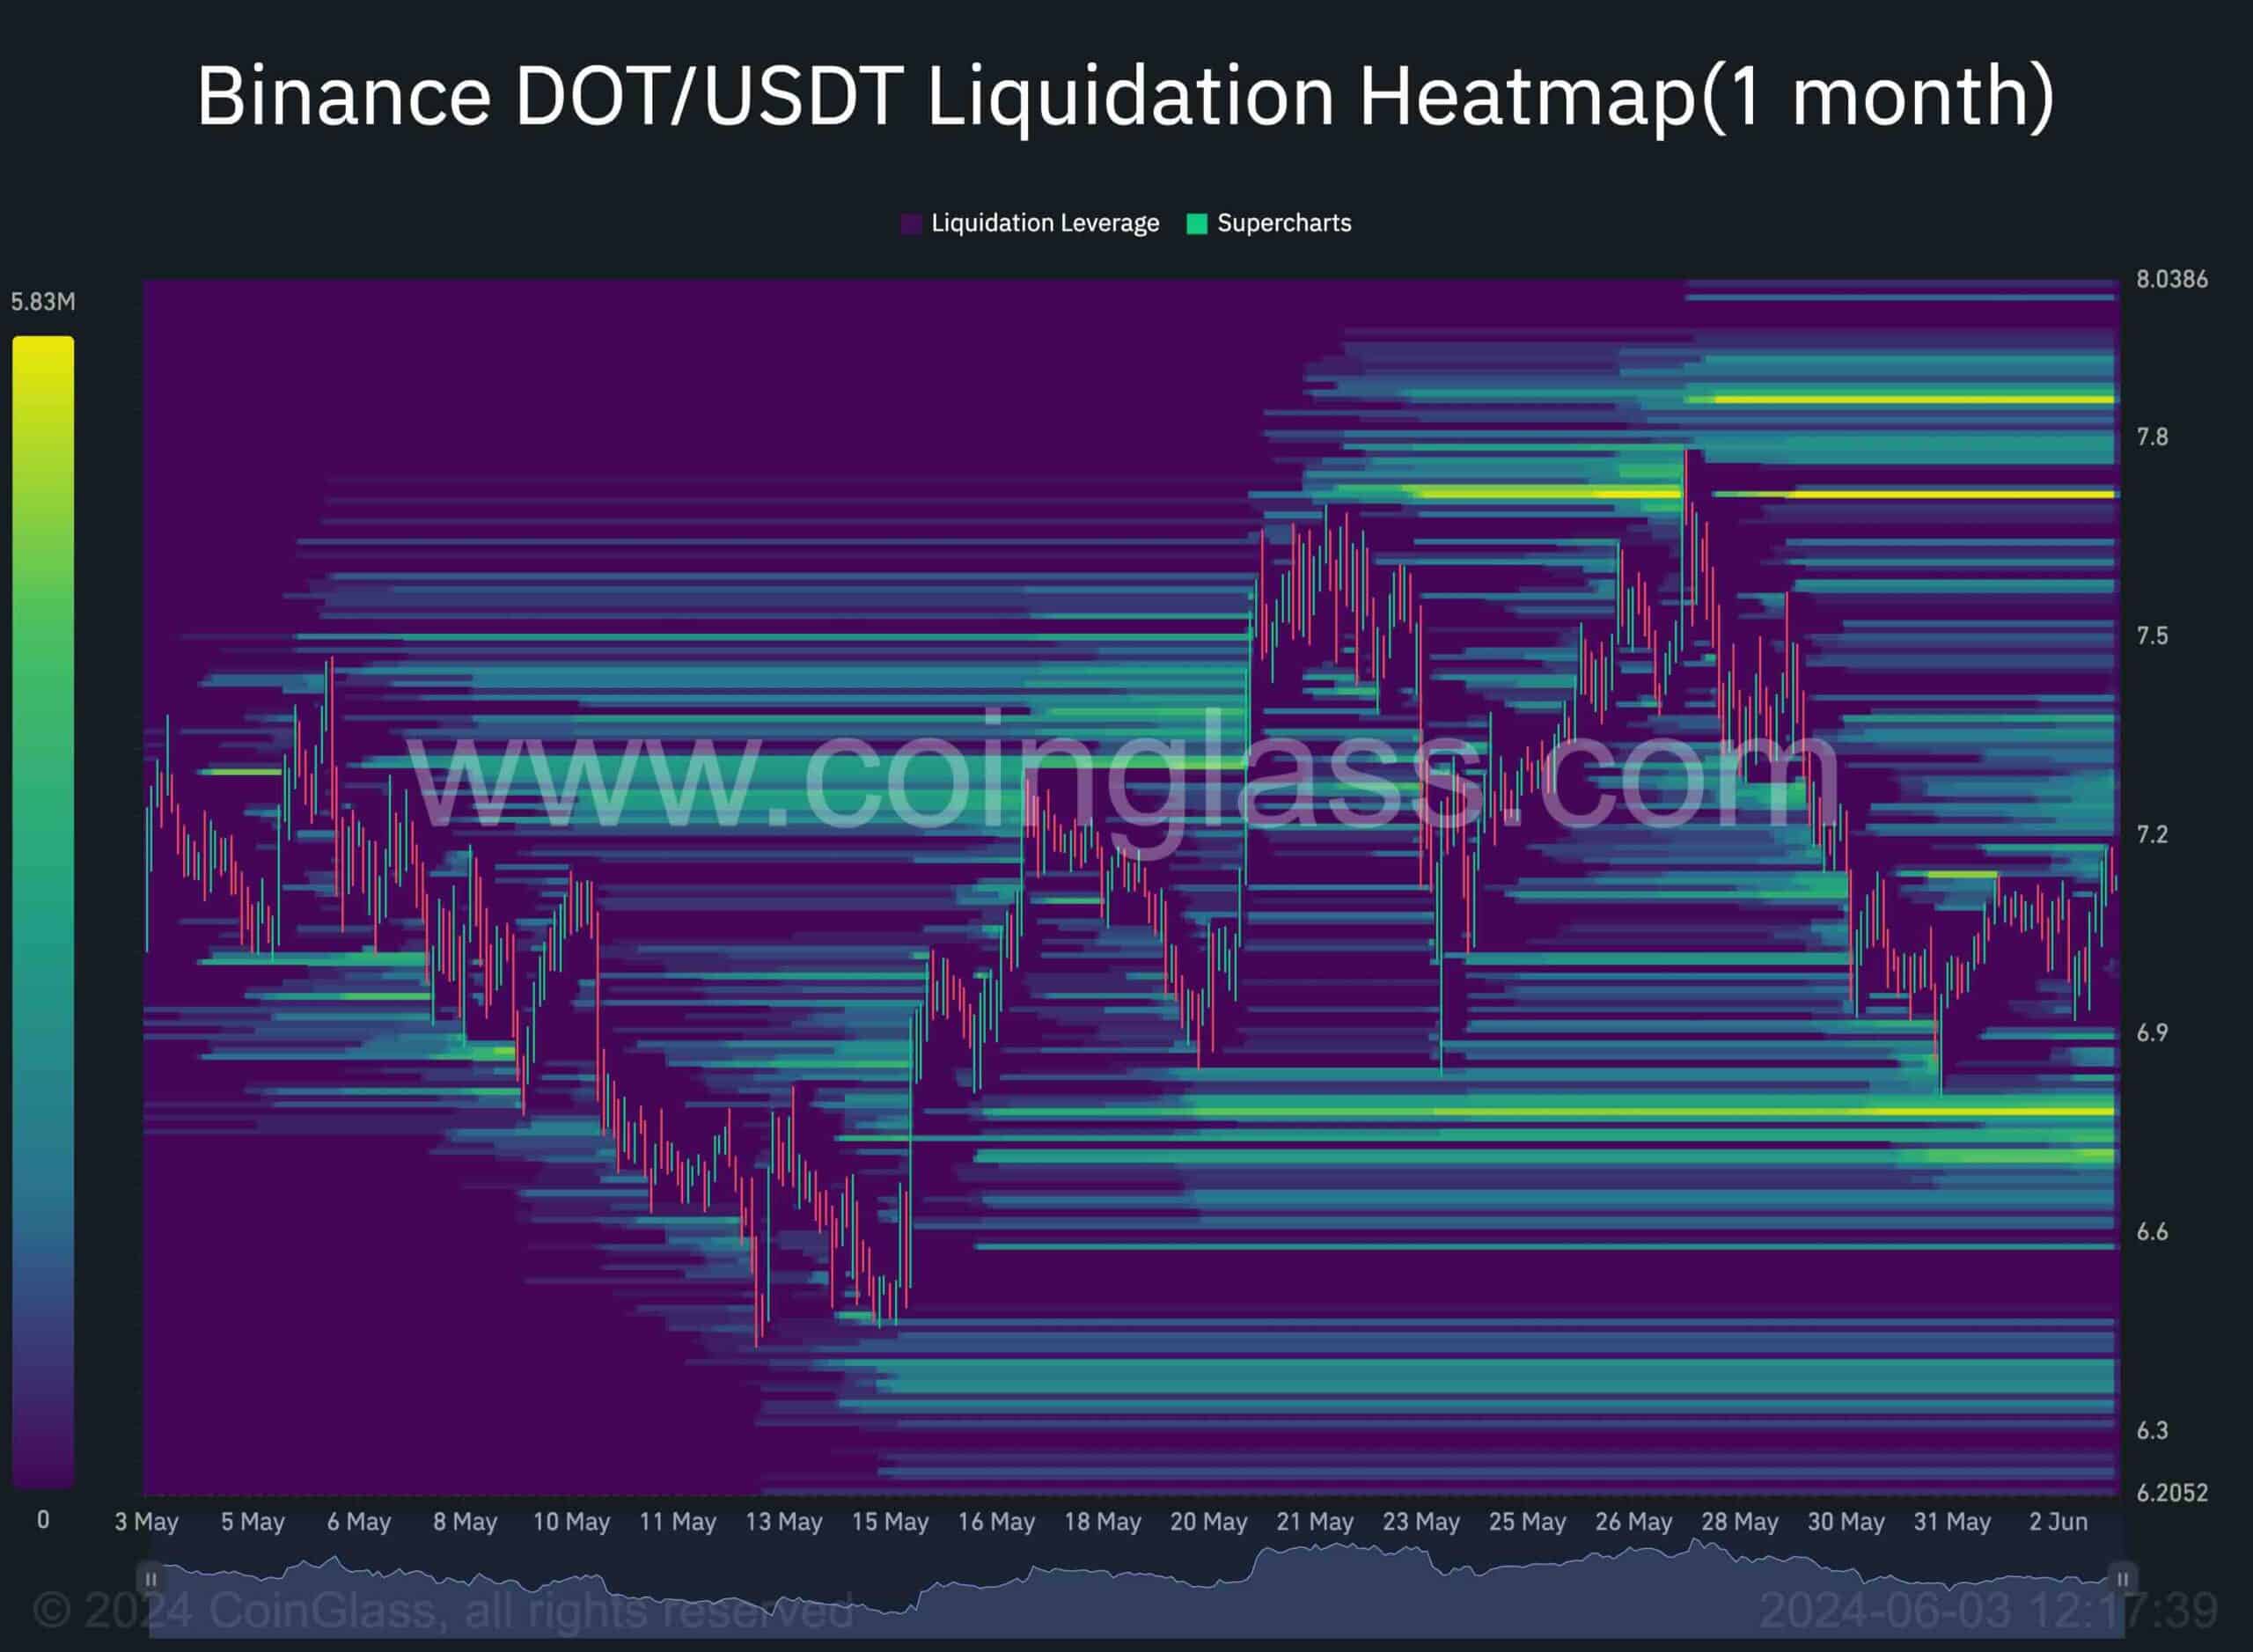
While Polkadot’s price is slowly making higher highs and lows around the $7 level, taking a look at the Binance liquidation heatmap gives us a clue as to why this is the case.
As the chart shows, the price has failed to drop below the $6.8 level. There might be a concrete reason for this behavior. There is a lot of liquidity below the $6.8 level, which could be the stop-loss orders and liquidation prices of many whales. Therefore, they have been defending their positions by pushing the price higher.
The same thing goes for the $8 zone, as there is also a lot of liquidity residing there. Therefore, these are the two primary levels the price is currently trapped between, and a breakout from each one could aggravate the prevailing direction of the market by triggering liquidation cascades.
The post Calm Before the Storm: DOT Ready to Rally to $9? (Polkadot Price Analysis) appeared first on CryptoPotato.