Bulls Return With 5% Daily Gains For Litecoin, How High Can It Go? LTC Price Analysis
- Litecoin is poised for more gains after moving out from a four-weeks downward range.
- A break above 0.0050 BTC level would signal strength.
- The price is currently looking bullish across trading pairs.
LTC/USD: Litecoin Aiming To Jump Above $48
Key Resistance Levels: $47.68, $50.7, $56
Key Support Levels: $44, $42, $39
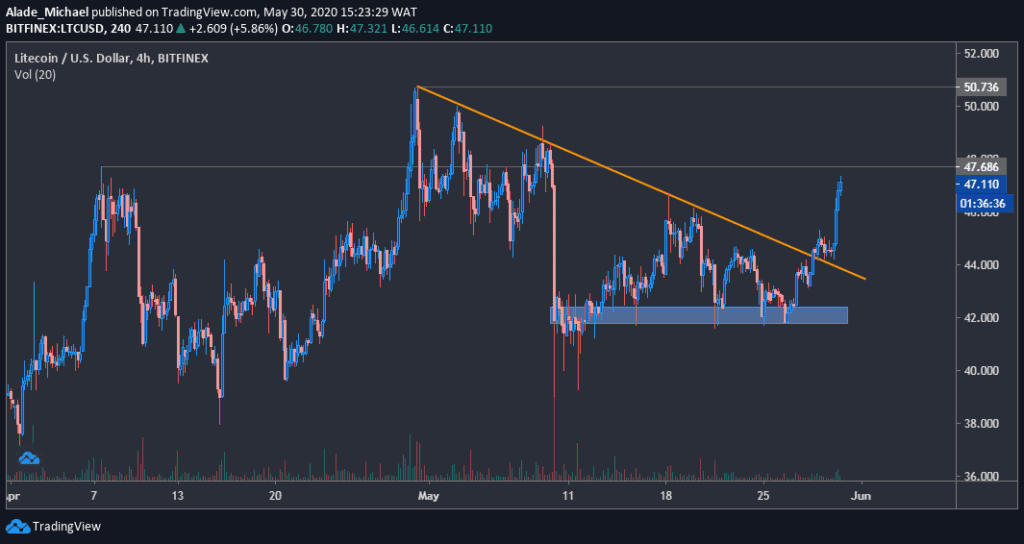
For the past few days now, the crypto market is rising. The price of Litecoin has shot up 5% over the past hours after breaking out from a downward range – marked orange in the above chart. However, the current bullish action was plotted from the blue demand area of $42 after a long wick at $39 on May 11.
The price is currently approaching a hidden resistance at $47.68.
Litecoin Price Analysis
As of now, Litecoin is trading at around $47. Once it manages to surpass the current resistance of $47.68, the next target is at $50.7 – April’s high. A breach from here should send the price straight to around $56.
The last 48-hours surge is currently supported at $44. If this level fails to hold strong, the price could slip back into the blue demand area of $42. The last defense line for the short-term bulls is $39, where price bounced back in the mid-month.
However, if we look at the current market sentiment, the bulls are now gaining control back.
LTC/BTC: Litecoin Refueling For More Gains
Key Resistance Levels: 0.004915 BTC, 0.00503 BTC
Key Support Levels: 0.00476 BTC, 0.00465 BTC
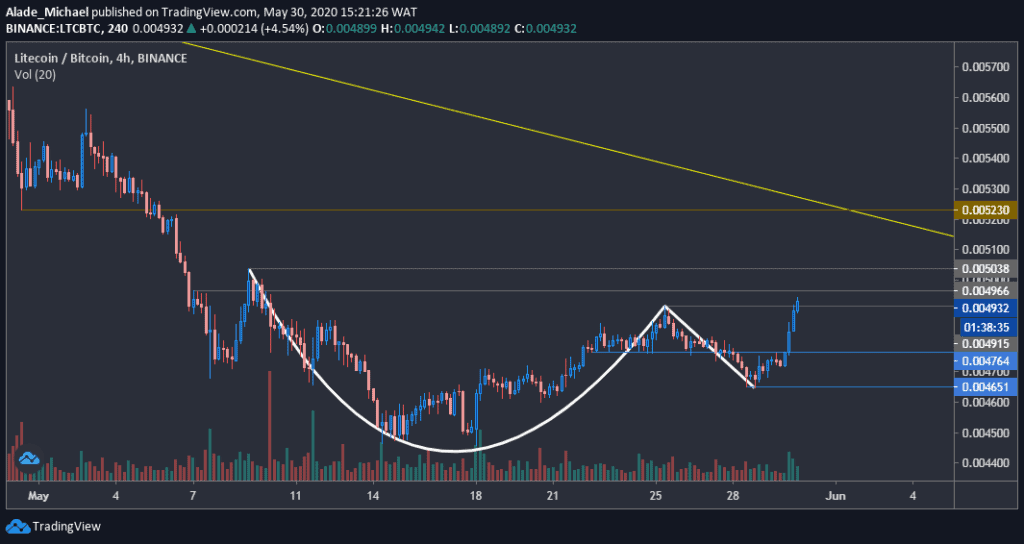
After establishing weekly support at 0.00465 BTC, Litecoin saw a 2-day bounce to where it is currently facing a minor resistance level at 0.004915 BTC.
As spotted on the 4-hours chart, the latest price increase was activated by a bullish cup-and-handle pattern. However, Litecoin would still need to clear a major resistance level at 0.00503 BTC before it comes out of the wood.
Despite the potential struggles it may encounter, the 7th largest cryptocurrency is still looking bullish on the 4-hours chart, with the current trading price at 0.004905 BTC. But one thing that may suspend buying pressure for a while is the yellow regression line – forming since early March.
Litecoin Price Analysis
As soon as Litecoin conquers the key mentioned resistance levels, the next major move is expected to reach 0.00523 BTC. Before the potential breakout, there’s a small hidden resistance at 0.004966 BTC, all marked grey on the price chart.
Apart from the holding weekly support at 0.00465 BTC, Litecoin has further built daily support at 0.00476 BTC – indicated blue on the chart. If the price drops below these levels, it may revisit the monthly low one more time.
As it appears now, there’s no sign of sellers in the market. The whole price setups look positive at the moment.
The post Bulls Return With 5% Daily Gains For Litecoin, How High Can It Go? LTC Price Analysis appeared first on CryptoPotato.

