Bullish Bitcoin Chart Pattern Still Intact Despite 7% Price Drop
- Bitcoin has erased more than 45 percent of last week’s rally, but the outlook remains bullish with prices holding above three-day chart support at $6,847.
- A re-test of trendline resistance at $7,665 looks likely. A violation there would expose Friday’s high of $7,870.
- Acceptance below $6,847 would invalidate a bullish reversal pattern on the three-day chart and expose the recent low of $6,515. That looks unlikely, though, with the MACD histogram turning bullish above zero.
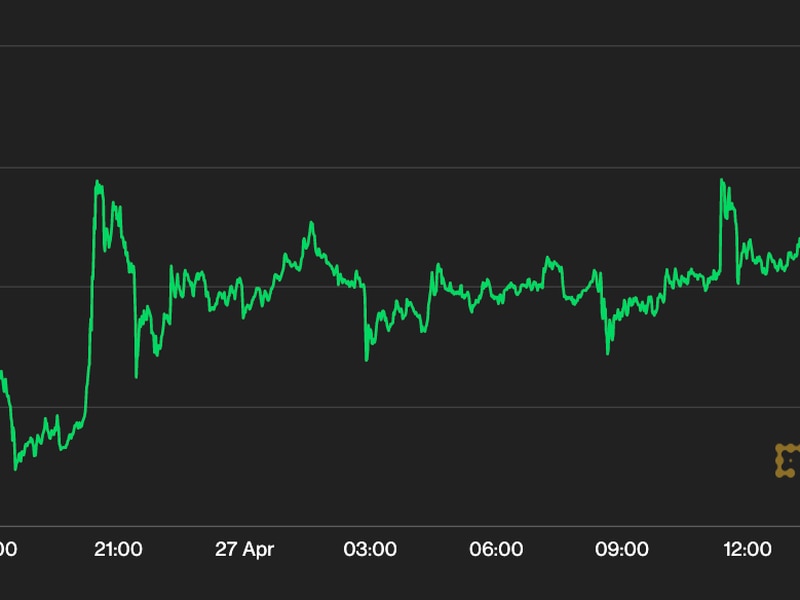
Bitcoin has pulled back sharply over the last 48 hours, but is holding well above support near $6,850 keeping the short-term bullish bias intact.
The top cryptocurrency is currently trading near $7,330, representing a 7.3 percent drop from the high of $7,870 registered on Friday.
With the pullback, bitcoin has erased more than 45 percent of the corrective rally from the six-month low of $6,515 hit on Nov. 25.
As a result, many in the investor community, including the likes of popular trader and analyst Josh Rager, believe the relief rally has ended and the overall bearish trend, as represented by the drop from $10,000 to $6,500, has likely resumed.
That argument appears logical with the daily chart reporting a fresh lower-high pattern.
Daily chart and 8-hour charts

Bitcoin jumped to $7,800 on Friday, as expected, but faced rejection at the resistance of a trendline sloping downwards through Oct. 26 and Nov. 15 highs.
The cryptocurrency also failed to close (UTC) above $7,775 – the 38.2 percent Fibonacci retracement of the drop from $10,350 to $6,511.
In effect, the bulls could not preserve the upside momentum after Friday’s rejection at key levels and the cryptocurrency has faced selling pressure ever since.
Bitcoin has now established a “bearish lower high” at the falling trendline resistance.
Further, the 8-hour chart is now reporting a flag breakdown, which implies a resumption of the sell-off from recent highs near $10,350.
All that said, a bullish reversal pattern confirmed last week on the three-day chart is still valid.

BTC created a hammer candle in the three days to Nov. 26, signaling seller exhaustion following a notable sell-off.
More importantly, the cryptocurrency rallied 8 percent in the three days to Nov. 29 and found acceptance above the hammer candle’s high of $7,380, marking a strong follow-through to the hammer candle and confirming a short-term bearish-to-bullish trend change.
The bullish pattern would be invalidated if and when bitcoin find acceptance under $6,847 – the low of the green candle.

The pullback from $7,870 lacks substance, with trading volumes dropping over the last 48 hours. A low-volume pullback is often short-lived.
Meanwhile, the daily chart MACD histogram, an indicator used to identify trend changes and gauge the strength, is offering a bullish signal with an above-zero reading.
As a result, bitcoin looks unlikely to violate support at $6,847 and may rise back to the falling trendline resistance, currently at $7,665.
The short-term bullish case would strengthen if prices manage to clear the lower high at $7,870 established over the weekend.
It’s worth noting that, as per technical analysis theory, setups on longer time frames take precedence over intraday charts. So, while bitcoin is looking heavy on the 8-hour and daily charts, the pattern on the three-day chart warrants caution on the part of the sellers.
Disclaimer Read More
The leader in blockchain news, CoinDesk is a media outlet that strives for the highest journalistic standards and abides by a strict set of editorial policies. CoinDesk is an independent operating subsidiary of Digital Currency Group, which invests in cryptocurrencies and blockchain startups.
This article is intended as a news item to inform our readers of various events and developments that affect, or that might in the future affect, the value of the cryptocurrency described above. The information contained herein is not intended to provide, and it does not provide, sufficient information to form the basis for an investment decision, and you should not rely on this information for that purpose. The information presented herein is accurate only as of its date, and it was not prepared by a research analyst or other investment professional. You should seek additional information regarding the merits and risks of investing in any cryptocurrency before deciding to purchase or sell any such instruments.