BTC Violently Broke Down $8000. Where Is The Bottom? Bitcoin Price Analysis
In our recent BTC analysis from two days ago we reminded (again) the ‘problem’ we see in the latest parabolic move of Bitcoin:
“we had pointed out the negative divergence in the BTC daily chart’s RSI. The last found support at the 60 levels, and as of now, hovering around 67-68. However, to invalidate the mentioned divergence, we would like to see the RSI above the 73 area (the last week’s high). “
That negative divergence was seen clearly on the past week’s trading volume, whereas the volume of the last run above $8000 had ‘no fuel,’ thus, followed by a relatively low amount of buyers.
It was only a matter of time till we see two consecutive daily candles were Bitcoin was losing over $1000.
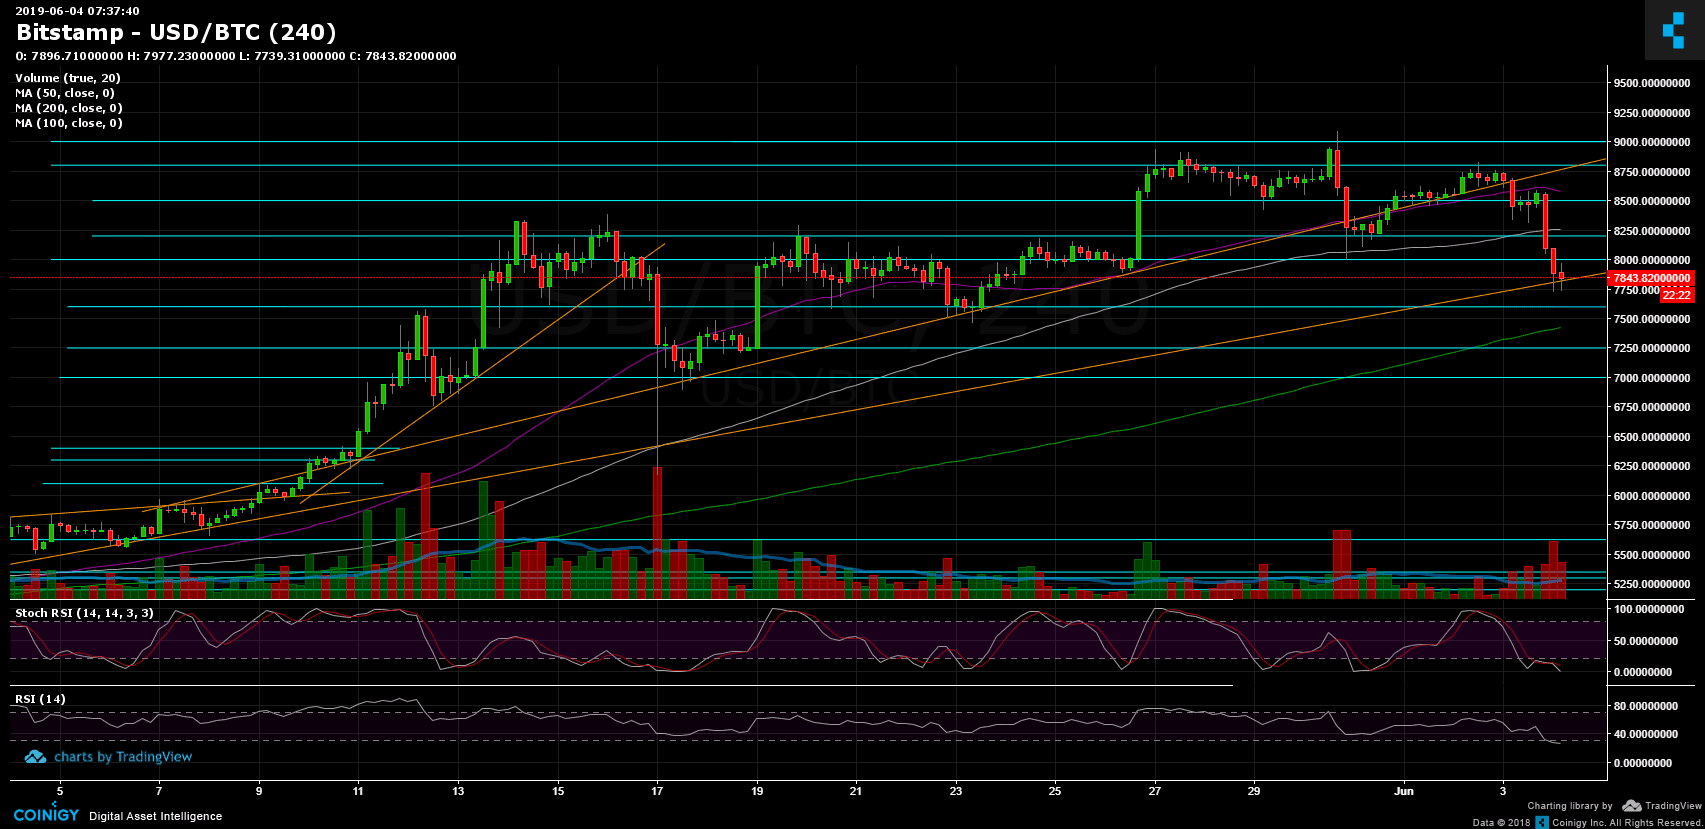
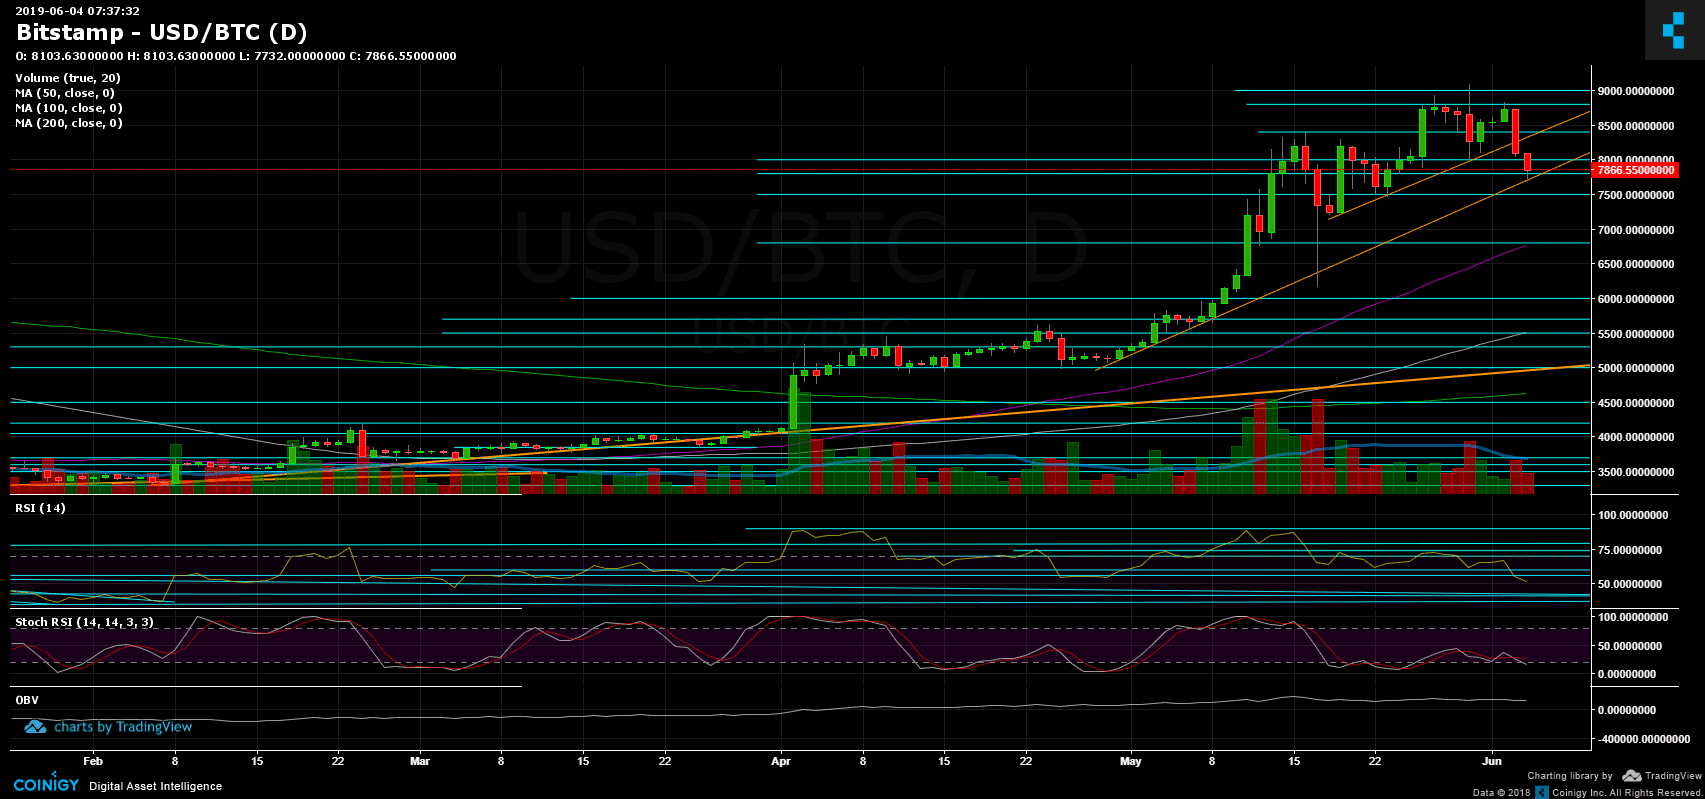
The $8000 significant support is now gone. As of writing this, Bitcoin holds the support of the mid-term ascending trend-line (marked by the orange line, one the following charts). The daily low, along with support of $7700.
Total Market Cap: $250 Billion
Bitcoin Market Cap: $139.5 Billion
BTC Dominance: 55.9%
Looking at the 1-day & 4-hour charts
– Support/Resistance:
After breaking down the $8000 area, Bitcoin is now facing the $7700 – $7800 supporting trend-line as mentioned above. Further below lies $7600 and $7500 levels. The last is the past week’s low. Also below is $7250 and $7000, before reaching the significant MA-50 line of the daily chart (marked in purple) around $6800.
From above, the nearest level of resistance is the $8000 area. Above lies $8200, $8400, $8500, $8800 and the 2019 high around $9000.
– Trading Volume: As discussed above, the recent drop was followed by a medium amount of volume; however, the sellers’ volume candle was higher than the buyers’.
– Daily chart’s RSI: It has been exactly three months since the RSI was so close to the significant 50 level. The last time the RSI was below the 50 area was four months ago, with Bitcoin trading around $3400.
– BitFinex open short positions: As expected, the open short positions number surged over 10% to around 22.5 K BTC positions.
BTC/USD BitStamp 4-Hour Chart

BTC/USD BitStamp 1-Day Chart

The post BTC Violently Broke Down $8000. Where Is The Bottom? Bitcoin Price Analysis appeared first on CryptoPotato.


