BTC Struggles Around $21K as Market Sentiment Remains Indecisive (Bitcoin Price Analysis)
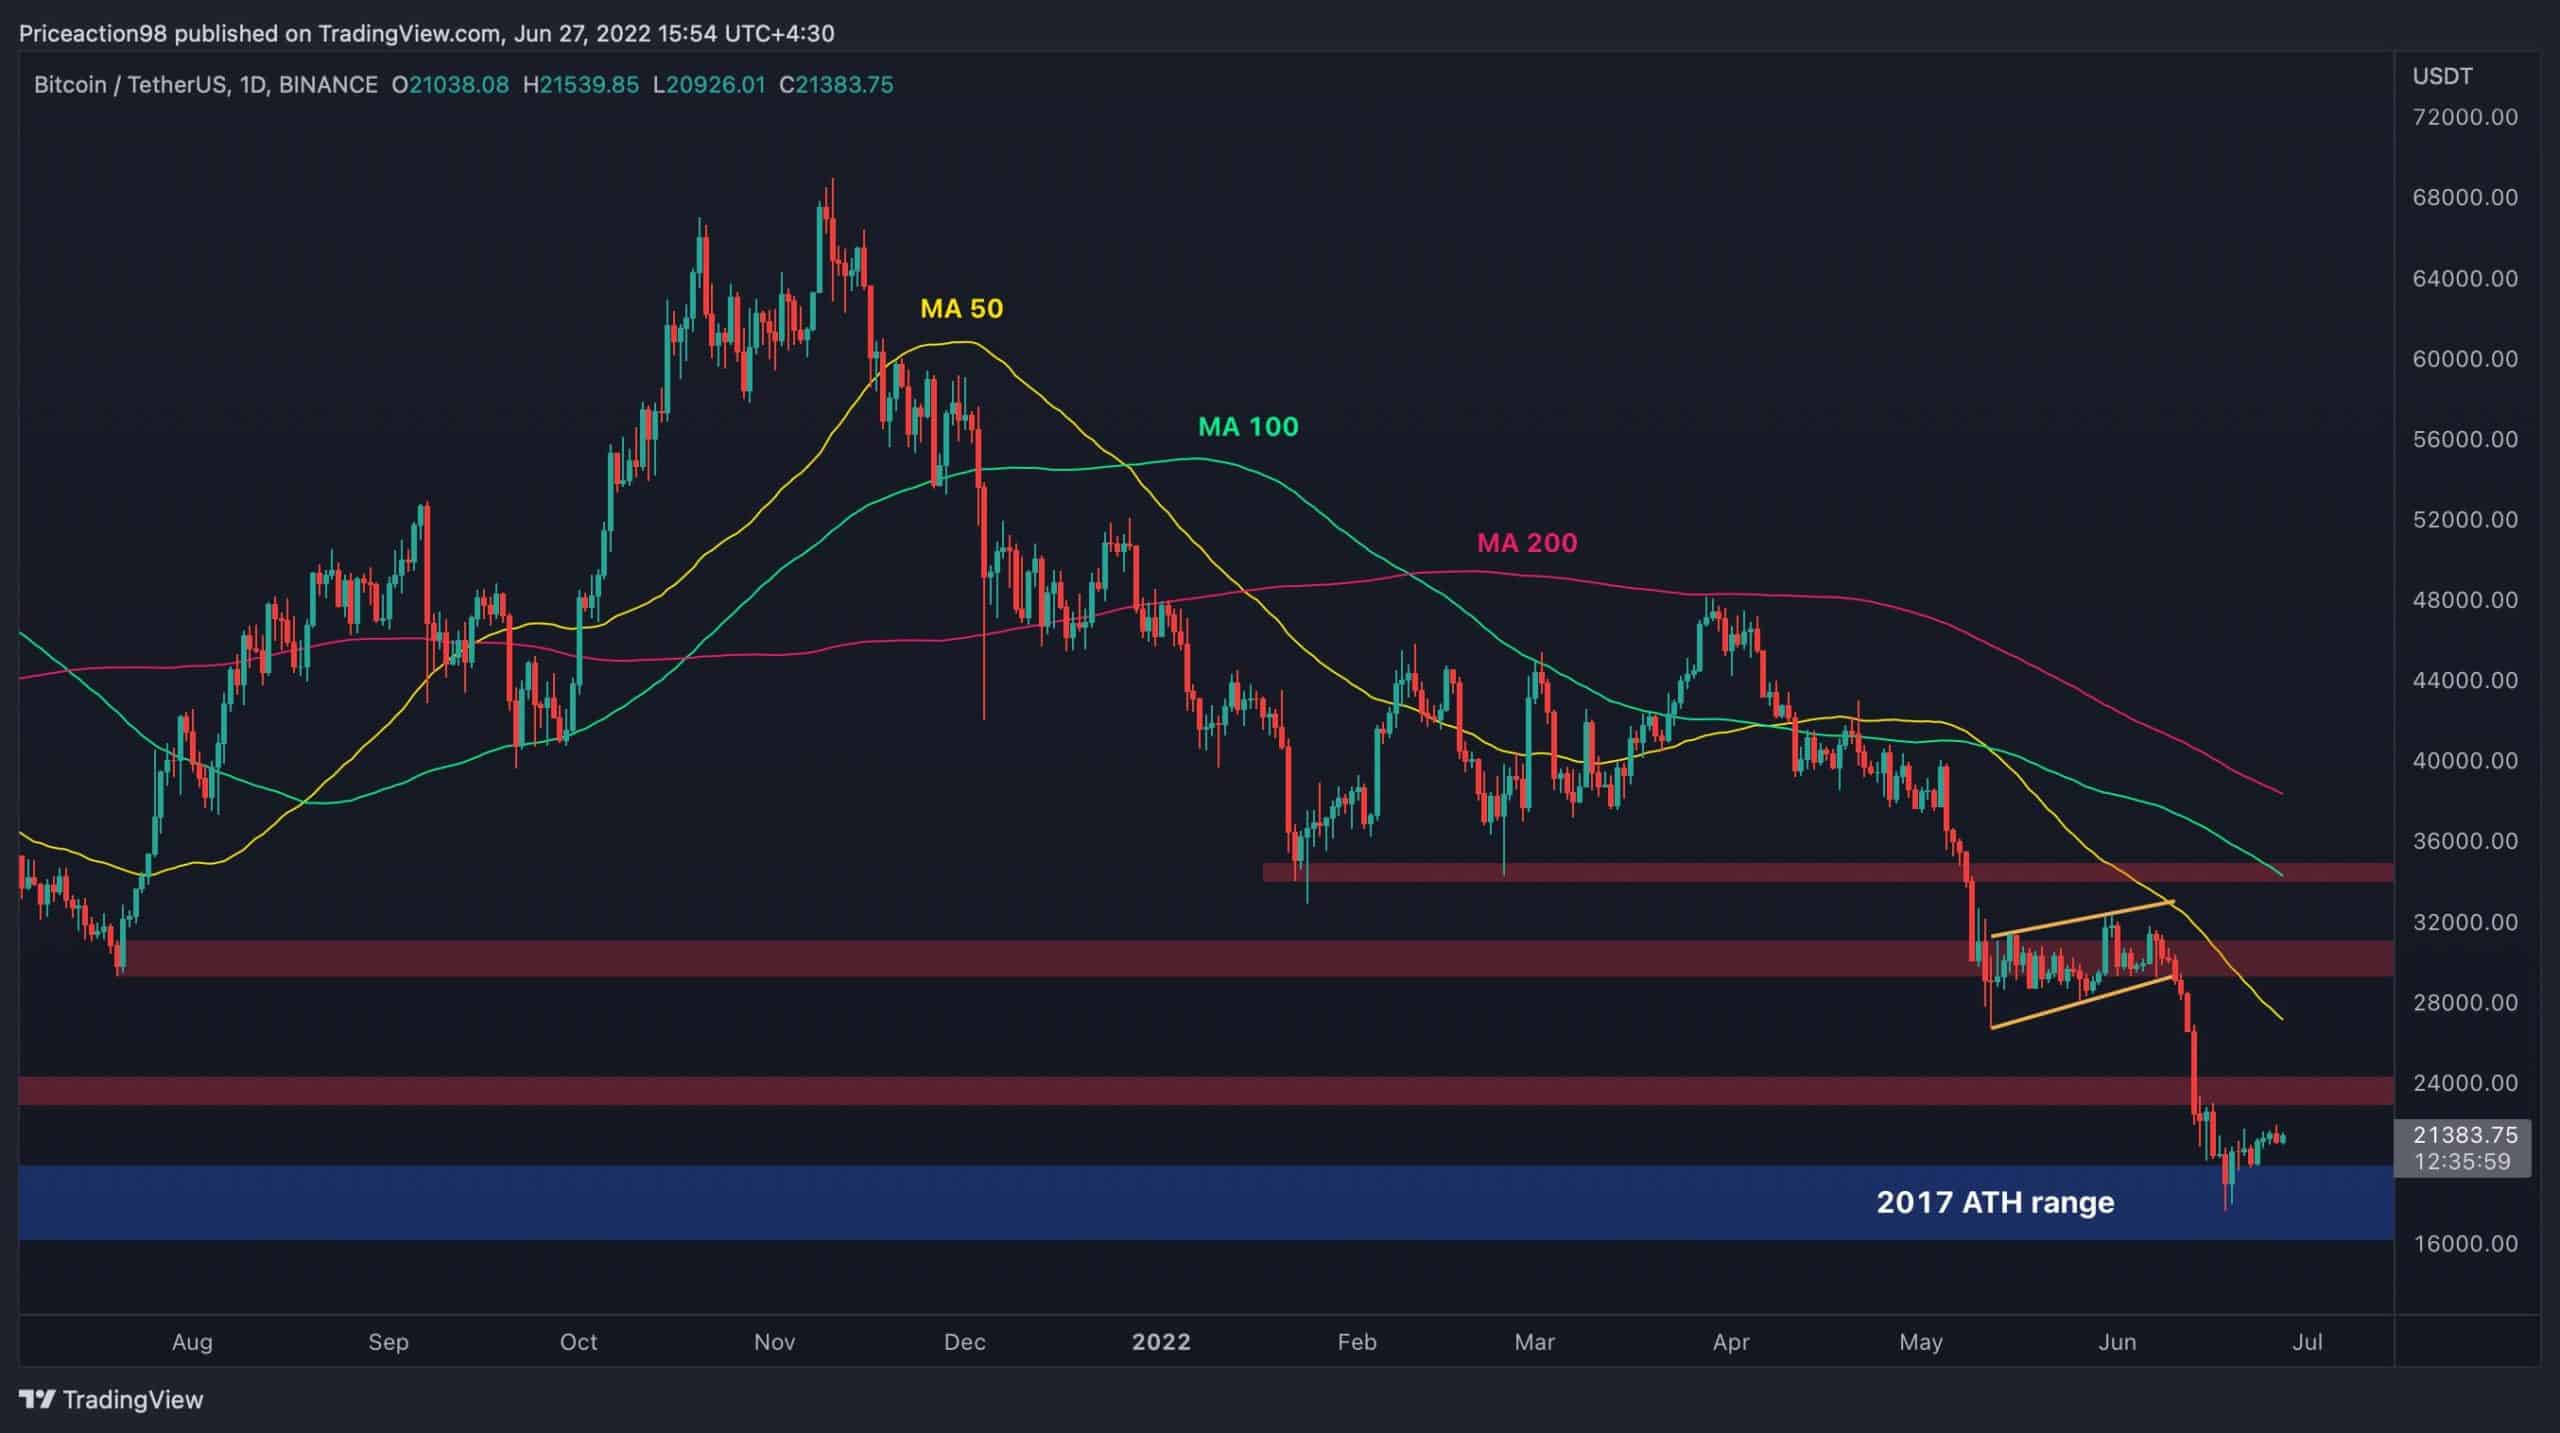
Bitcoin’s price is currently consolidating above the $20K level. The $17K-$20K range is likely to provide significant support, as it is the 2017 all-time high range, and it could initiate a rally in the short-term towards the $30K area.
Technical Analysis
By: Edris
The Daily Chart
The price would have to break the $24K resistance level and the 50-day moving average before a potential retest of the $30K supply zone. On the other hand, if BTC fails to gain sufficient bullish momentum and the $20K area gets broken to the downside, another rapid drop towards the $15K mark and even beyond could be expected.

The 4-Hour Chart
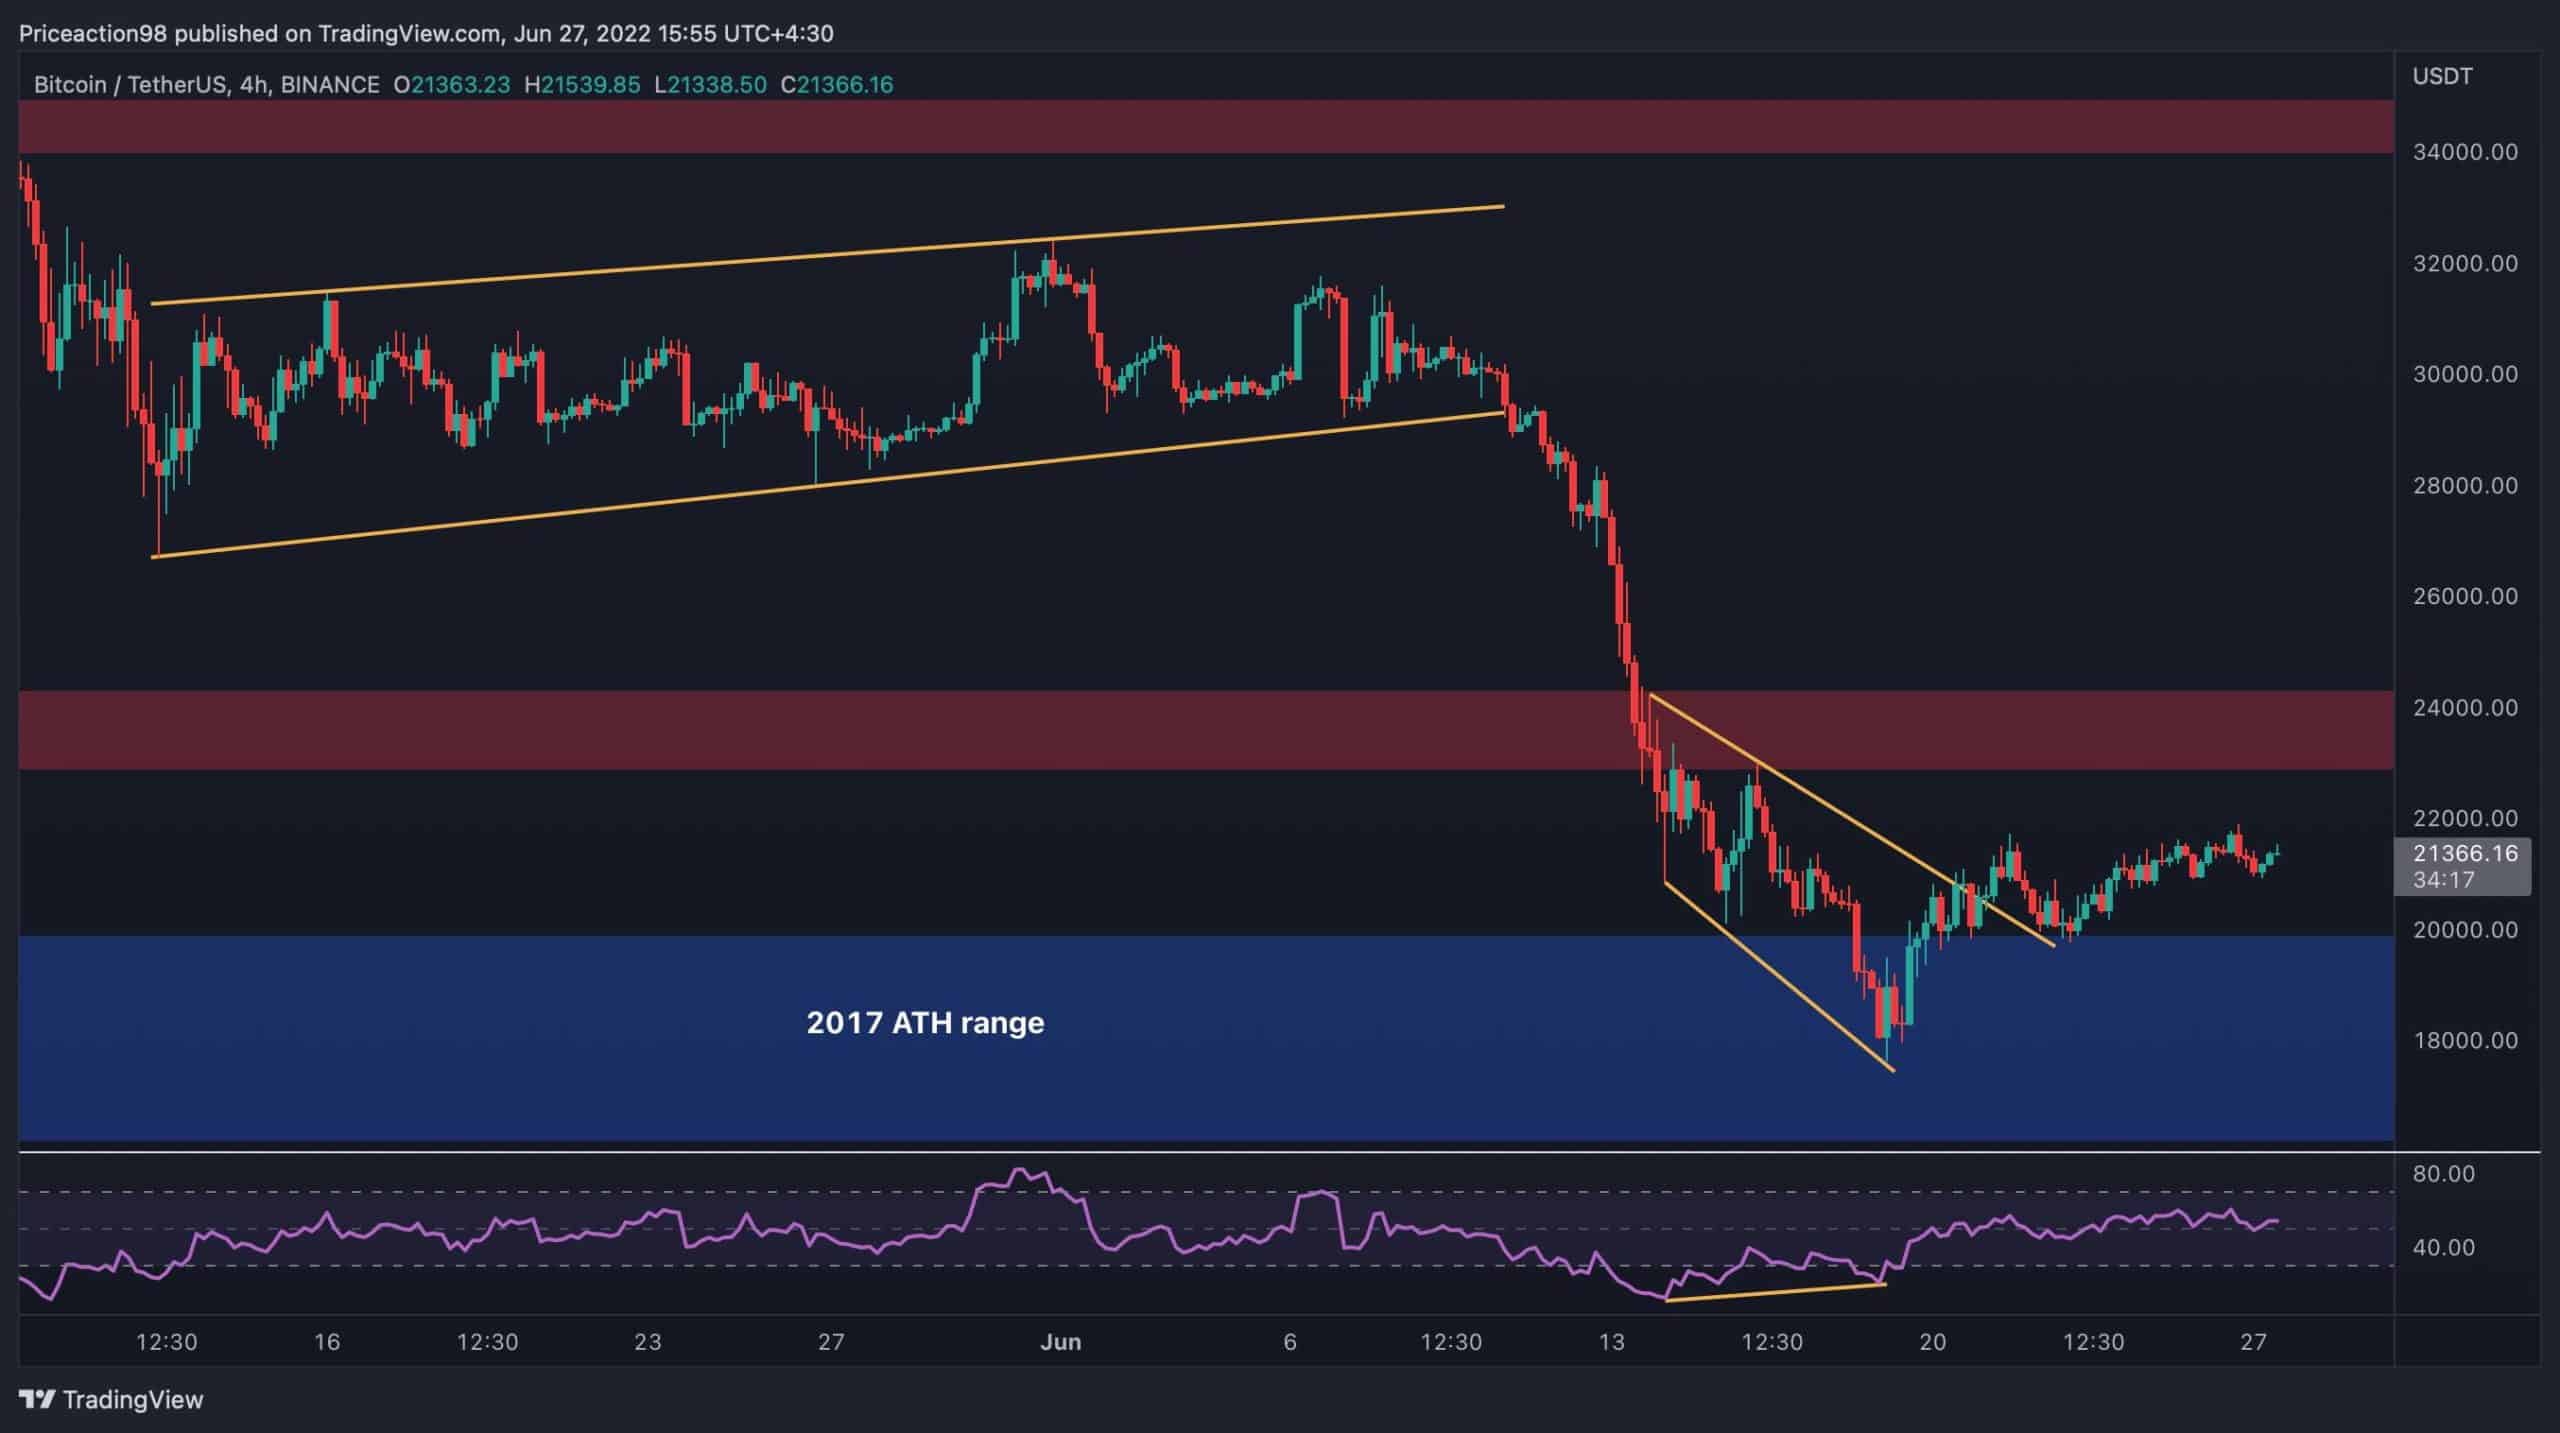
On the 4-hour timeframe, the price has successfully broken the descending channel pattern to the upside. This is considered a bullish reversal pattern and would be highly probable when paired with a strong support level.
However, after a valid pullback to the broken trendline, the price seems to have lost bullish momentum and is currently trending slowly towards the $24K resistance zone. This lack of bullish momentum would be a concern, as it demonstrates that the sellers are still in control, and a further drop could be expected, even before a retest of the $24K level.

Although, the more probable scenario would be an elongated consolidation between the $20K and $24K levels before the buyers or the sellers could gain dominance over their counterparties and create the next trend. All in all, the 4-hour price action is looking very slow at the moment, indicating the indecisiveness of market participants after a massive crash over the last couple of months.
Onchain Analysis
By Shayan
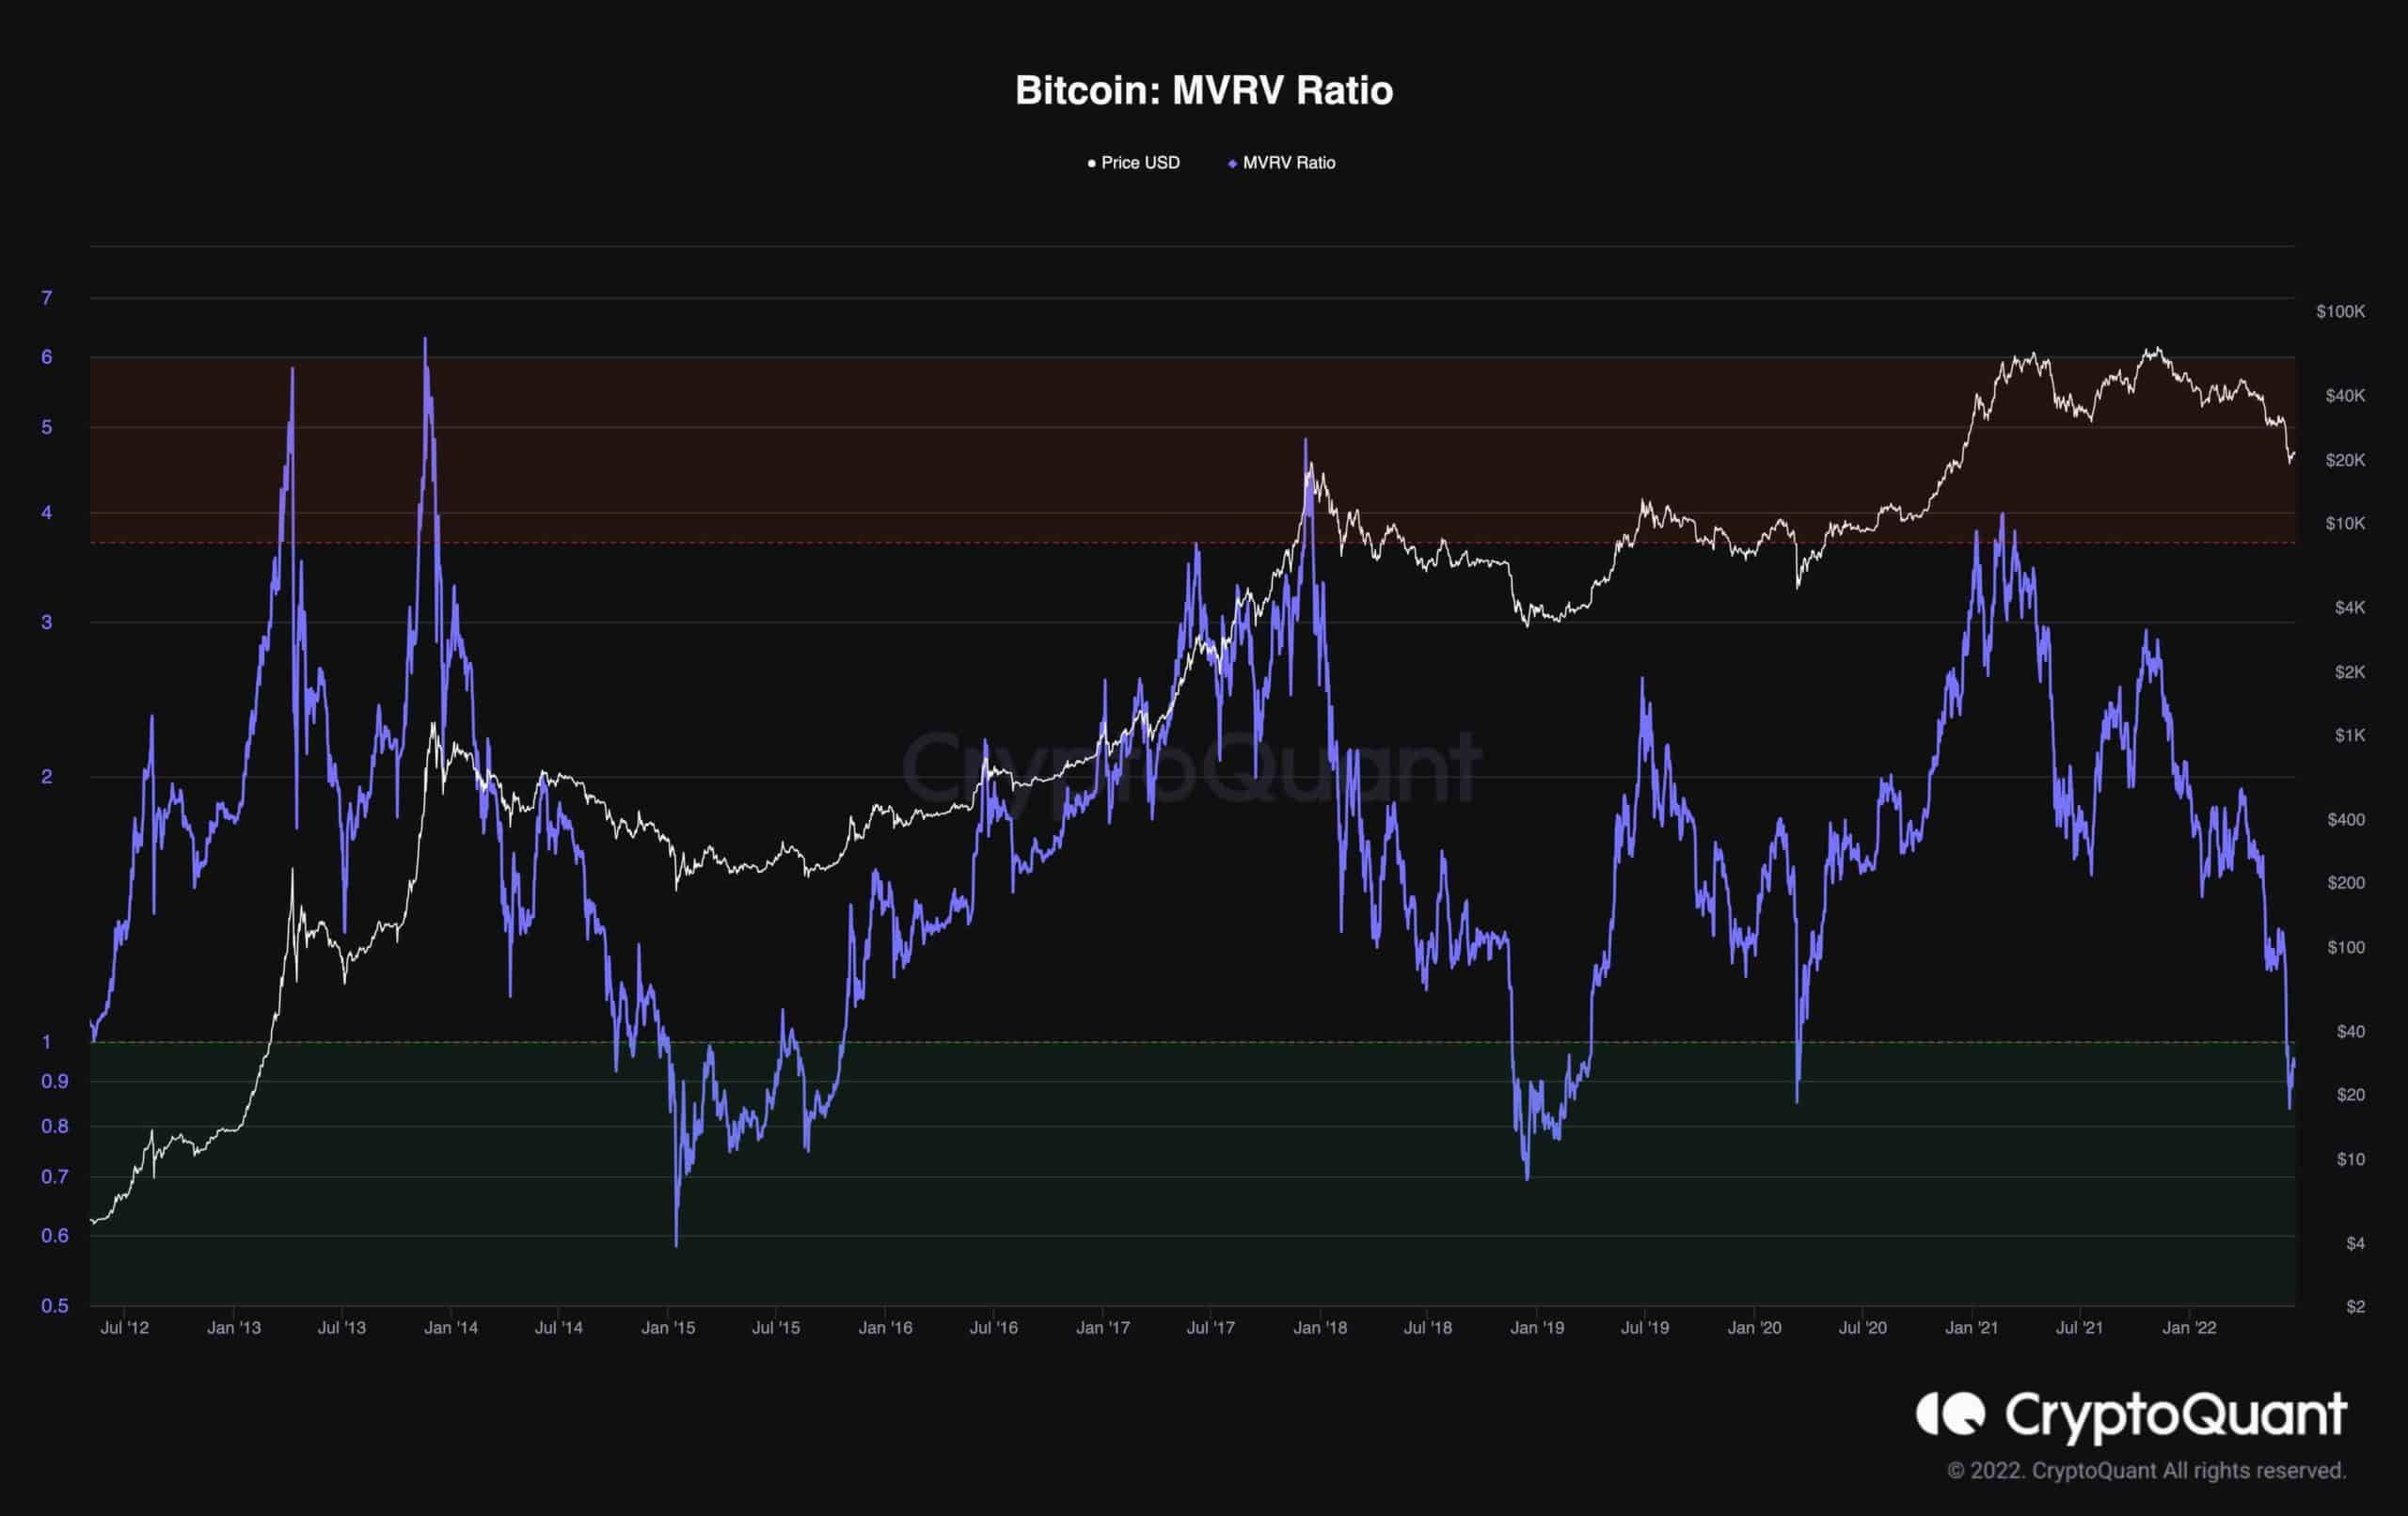
The MVRV is the ratio of a coin’s Market Cap to its Realized Cap, which determines whether the price is overvalued or not. This on-chain indicator may help map the current market situation.
Values over 3.7 historically suggest market tops, while values below one proxied market bottoms. The market has recently experienced a steep crash and retested its prior all-time high. As a result, the MVRV metric has plummeted to below 1 level for the first time after the Covid crash and the massive capitulation, while the market’s momentum is not encouraging. Considering the MVRV metric, Bitcoin is undervalued at these price levels.

The market is currently at its late bear market stage, and a new bullish cycle will be expected when this capitulation phase among retailers and long-term holders ends.


