BTC Skyrockets to $25K as Bulls Take Control, Here’s the Next Target (Bitcoin Price Analysis)
Bitcoin’s price exploded following a consolidation and pullback phase. It is currently testing a key resistance level, and its reaction will likely determine the short-term future of the market.
Technical Analysis
By: Edris
The Daily Chart
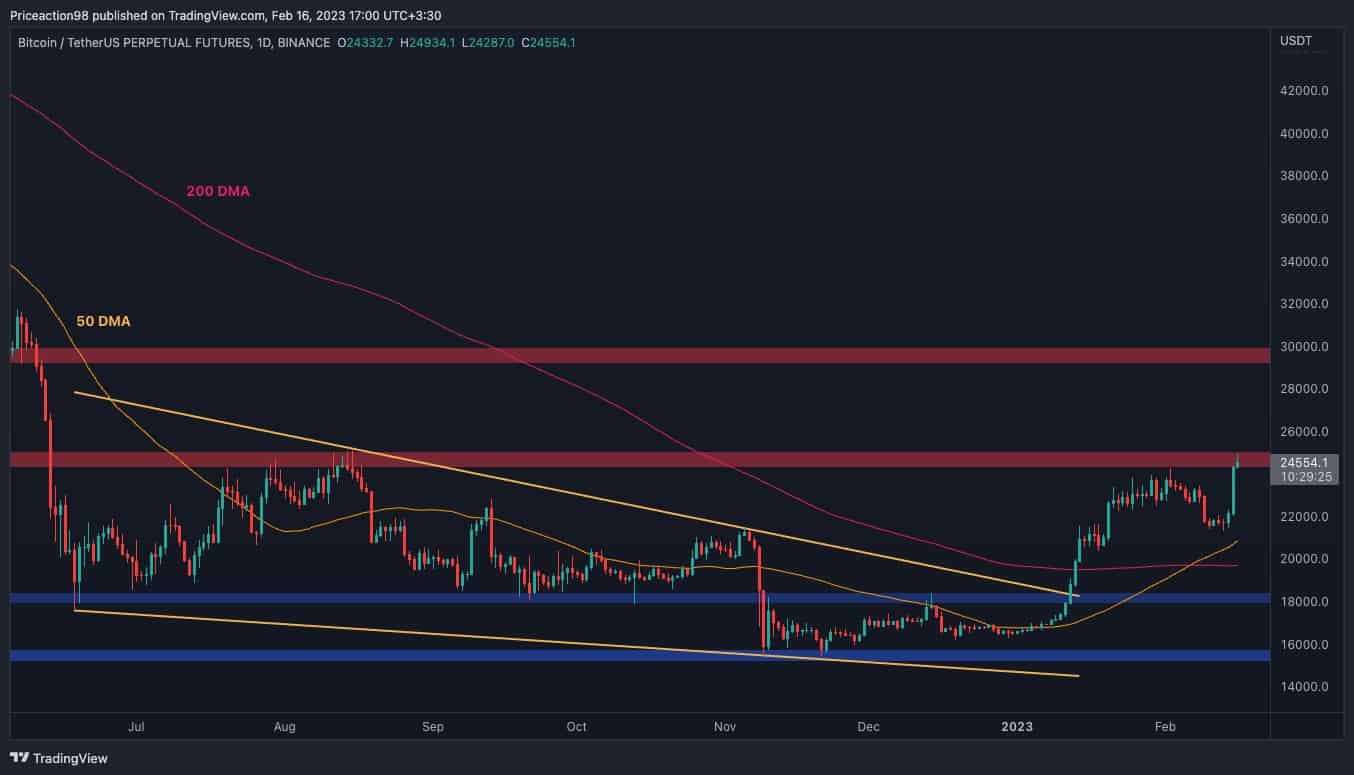
On the daily timeframe, the price is retesting the $25K resistance level once again after a rejection and bearish pullback several weeks ago. Considering the last day’s candle, bullish momentum seems very high at the moment, and a breakout above the $25K level is the more probable scenario at this time.
Meanwhile, the 50-day moving average has also crossed the 200-day moving average to the upside recently, which is a very bullish signal and further boosts the probability for a positive continuation above the $25K level and towards the $30K area.
On the other hand, an unlikely rejection from the current area could lead to a pullback towards the 50-day moving average located around the $21K mark.

The 4-Hour Chart
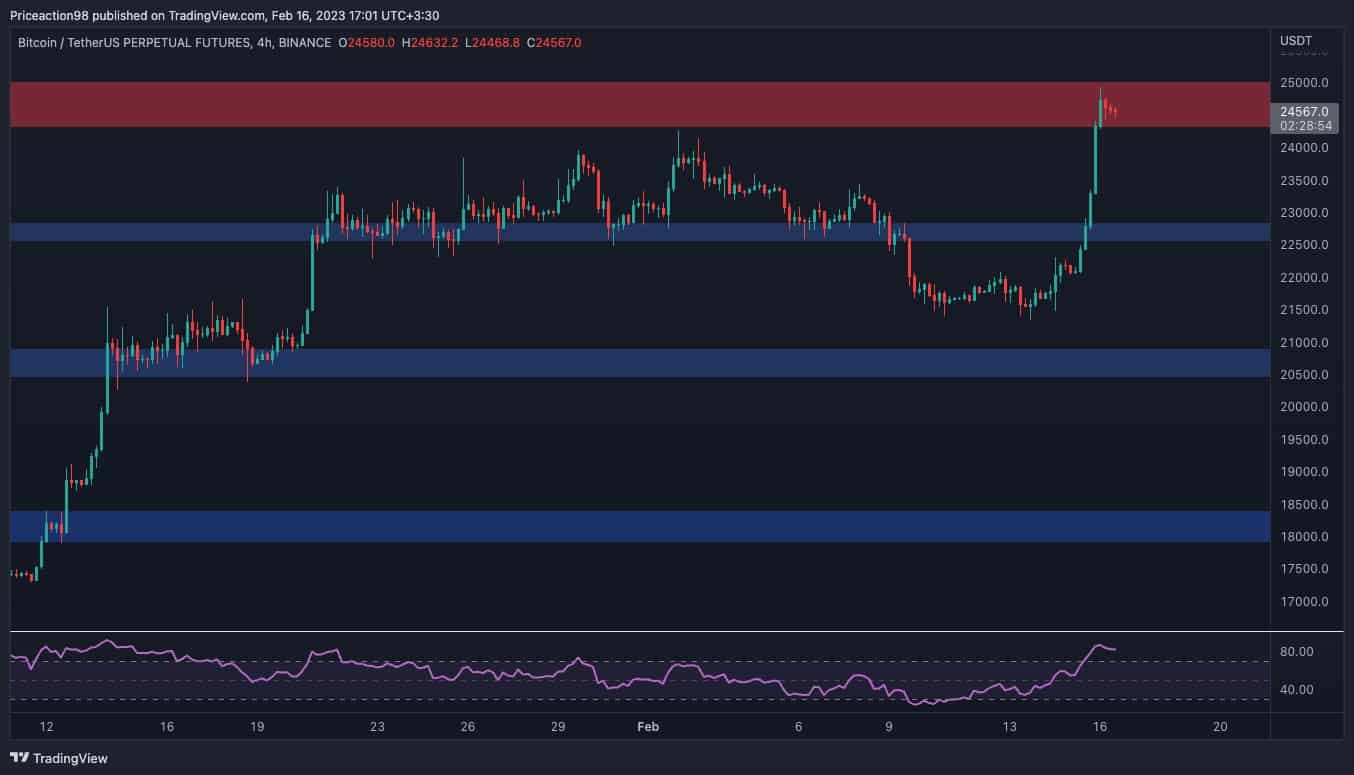
On the 4-hour chart, the price has been rapidly increasing after breaking back above the $22,500 mark and is brushing against the $25K resistance level.
While momentum is also highly bullish on this timeframe, the RSI is showing an indication of caution, as it has run deep into the overbought area, showing values above 80%.
As a result, a retracement could be probable before breaking the $25K level to the upside. In the event of a deep pullback, the $22,500 level could once more come into play and hold the market.

On-Chain Analysis
Bitcoin Open Interest
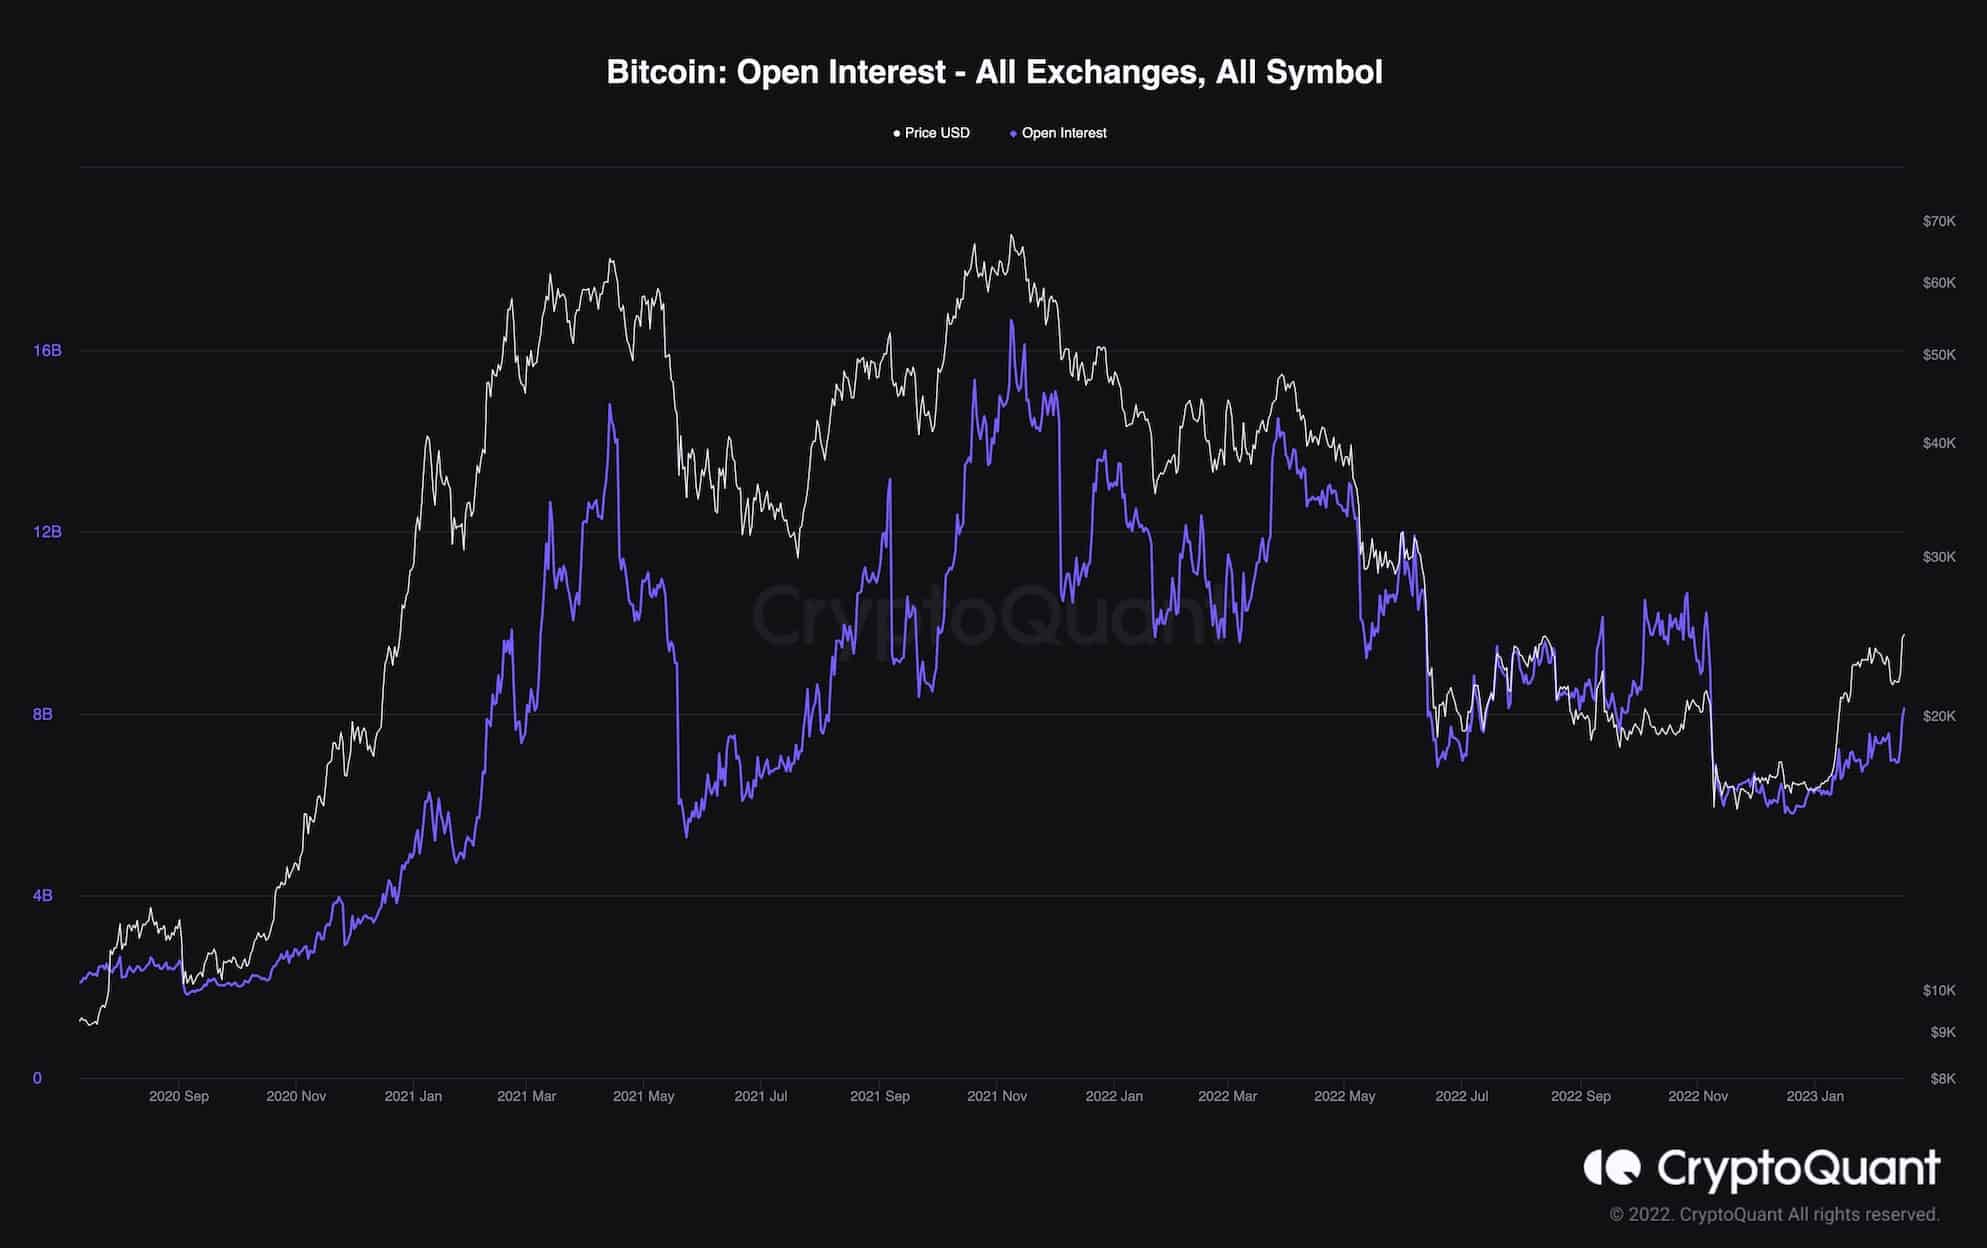
Bitcoin’s price has started rallying once more after weeks of consolidation. The futures market is also witnessing a spike in activity, though it could be a worrying signal.
This chart demonstrates the Open Interest metric, which shows the number of open positions in the perpetual futures market. Higher values of open interest would lead to higher price volatility.
Therefore, while it is logical for futures traders to become more active as the price is seemingly rebounding, investors should be wary of the recent steep rise in open interest, which might lead to a long liquidation cascade and another price plunge in the short term.

The post BTC Skyrockets to $25K as Bulls Take Control, Here’s the Next Target (Bitcoin Price Analysis) appeared first on CryptoPotato.


