BTC Skyrockets to $23K, Here’s the Next Target if Bulls Maintain Momentum (Bitcoin Price Analysis)
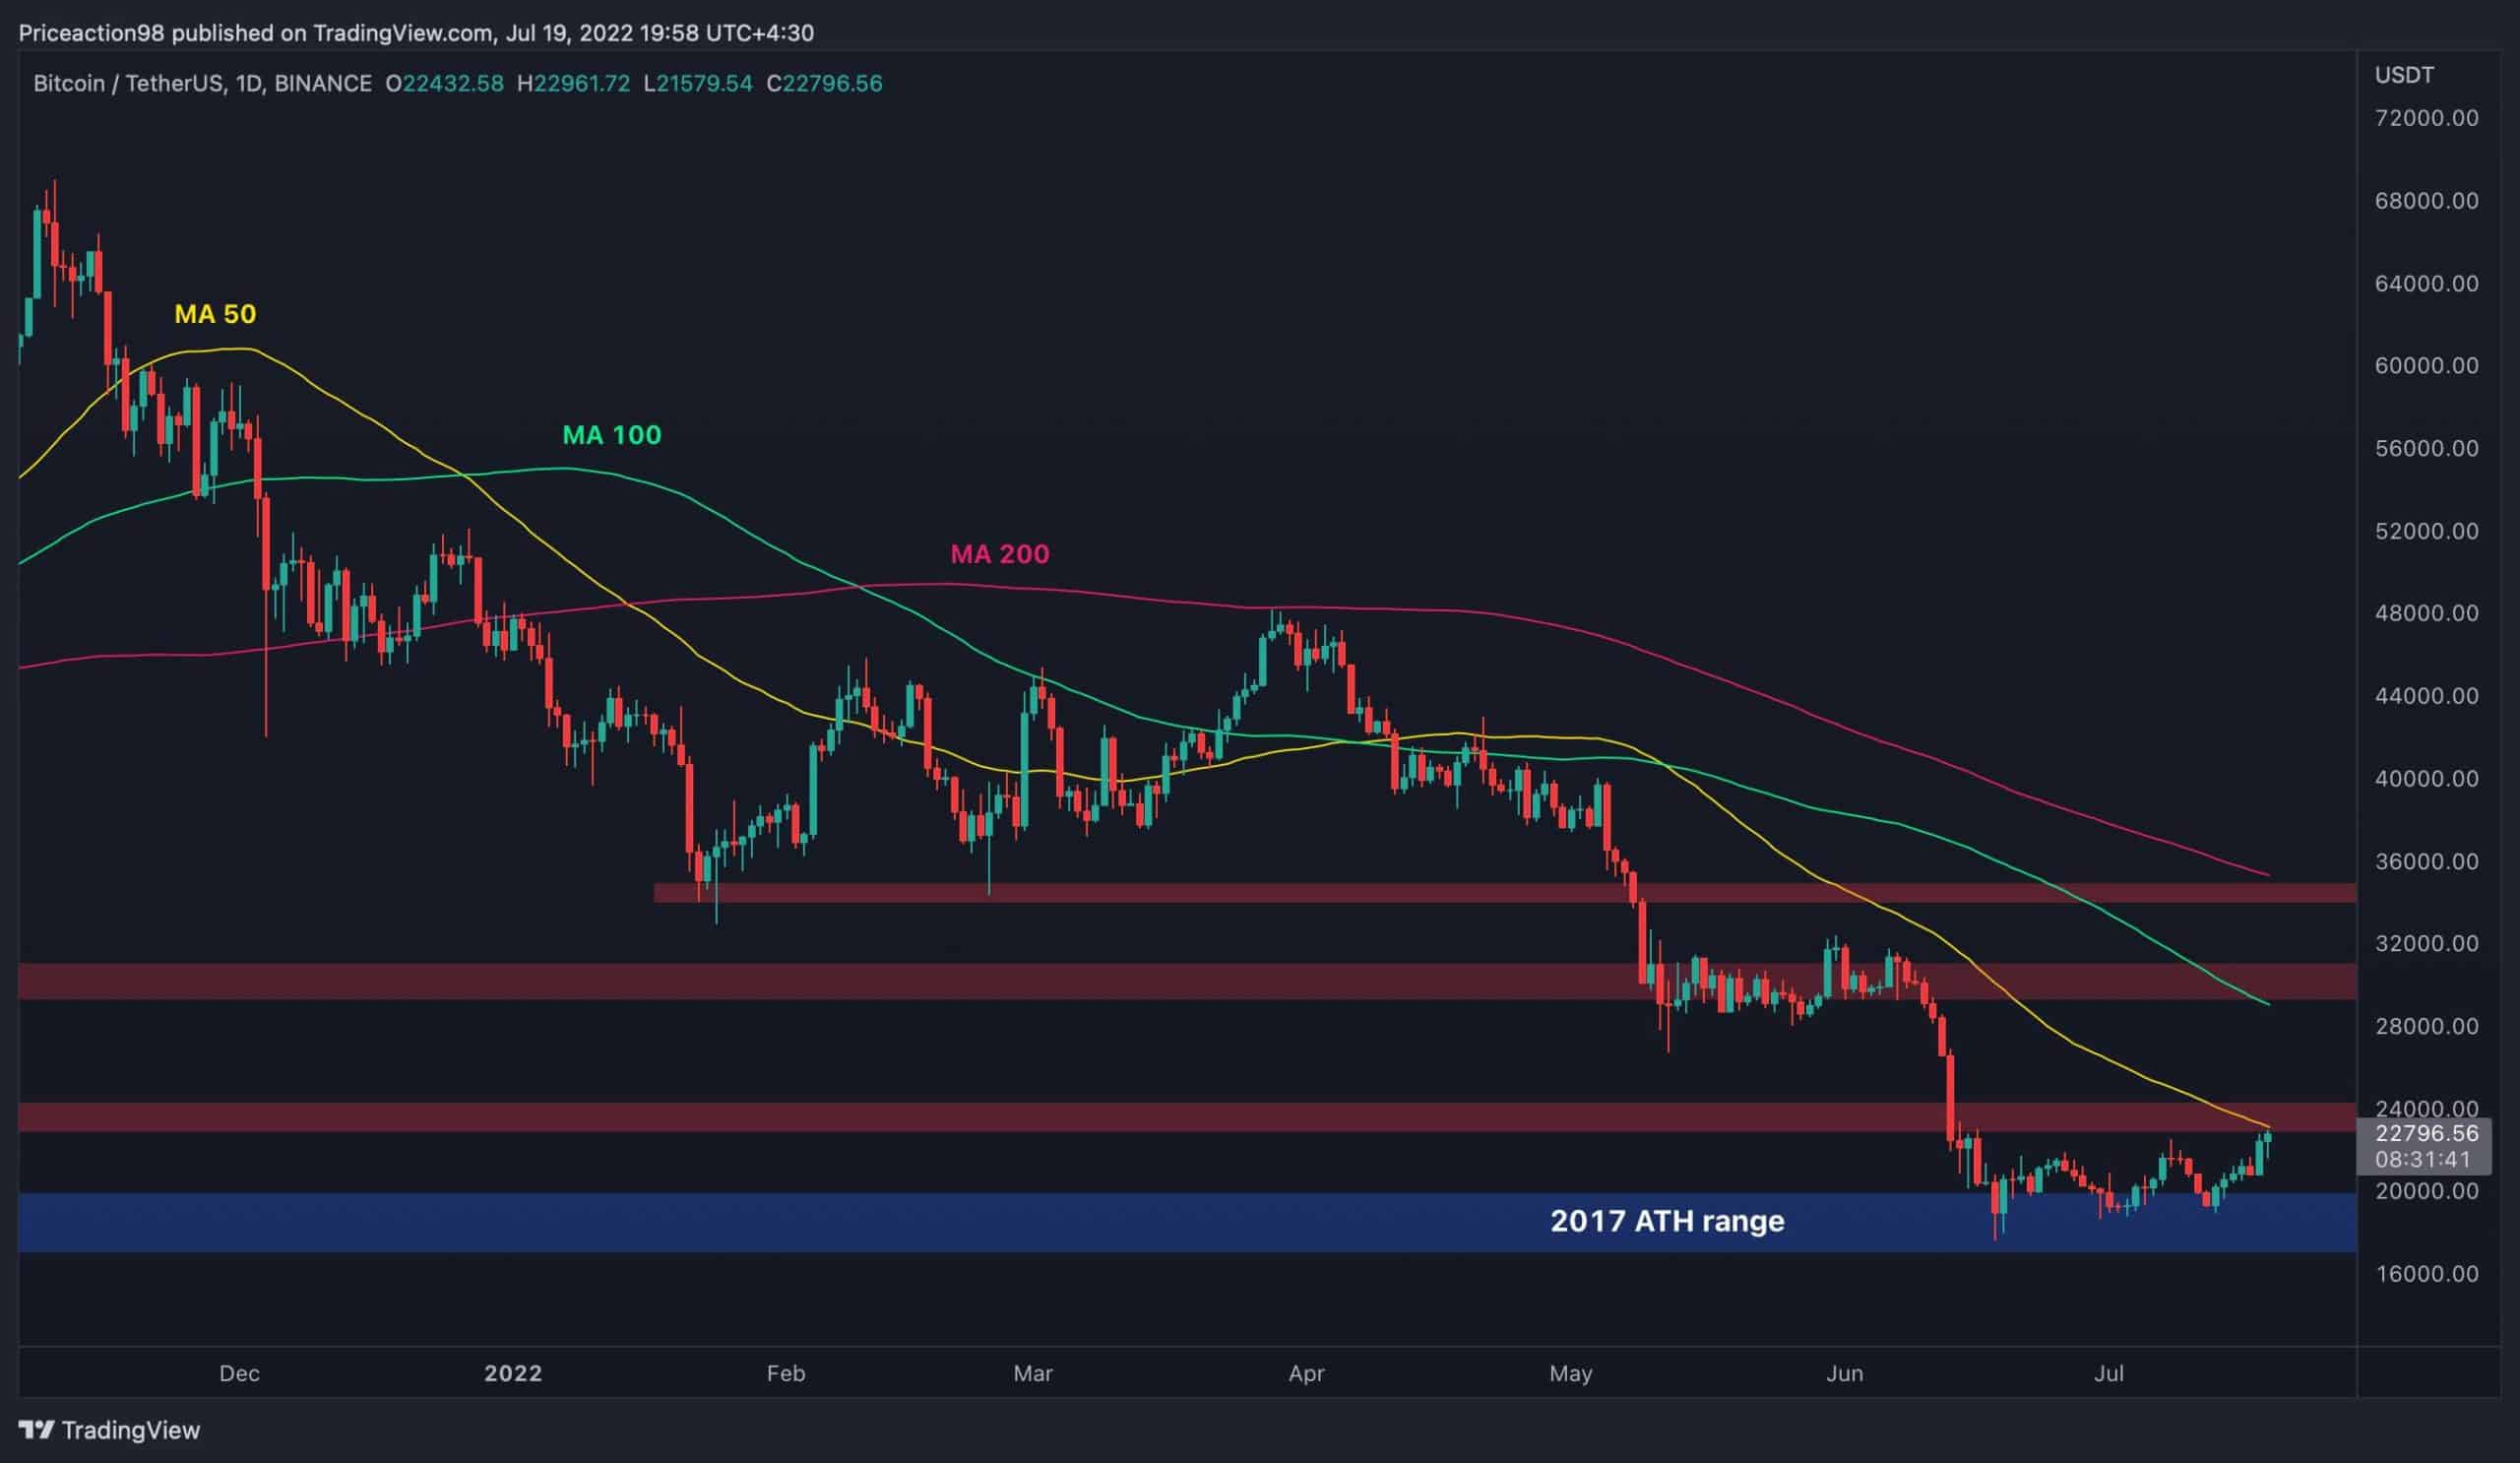
Bitcoin’s rapid downtrend has halted, as the price has been hovering above the $17K-$20K area over the past few weeks. After getting rejected three times from the $20K support zone, the price is currently retesting the $23K resistance level.
Technical Analysis
By Edris
The Daily Chart
Presently, the 50-day moving average is acting as an additional resistance at the $23K level. It seems like these two points are currently rejecting the price to the downside, and in this case, another retest of the $20K support level and even a deeper bearish continuation is anticipated. Although, the bulls appear eager to claim the level.
Therefore, the price action on the lower timeframes should be carefully observed in the next couple of days to determine the probability of a bearish reversal against a bullish breakout. Particularly if a bullish breakout above the $23K-$24K occurs, a rally towards the $30K supply zone wouldn’t be out of reach.

The 4-Hour Chart:
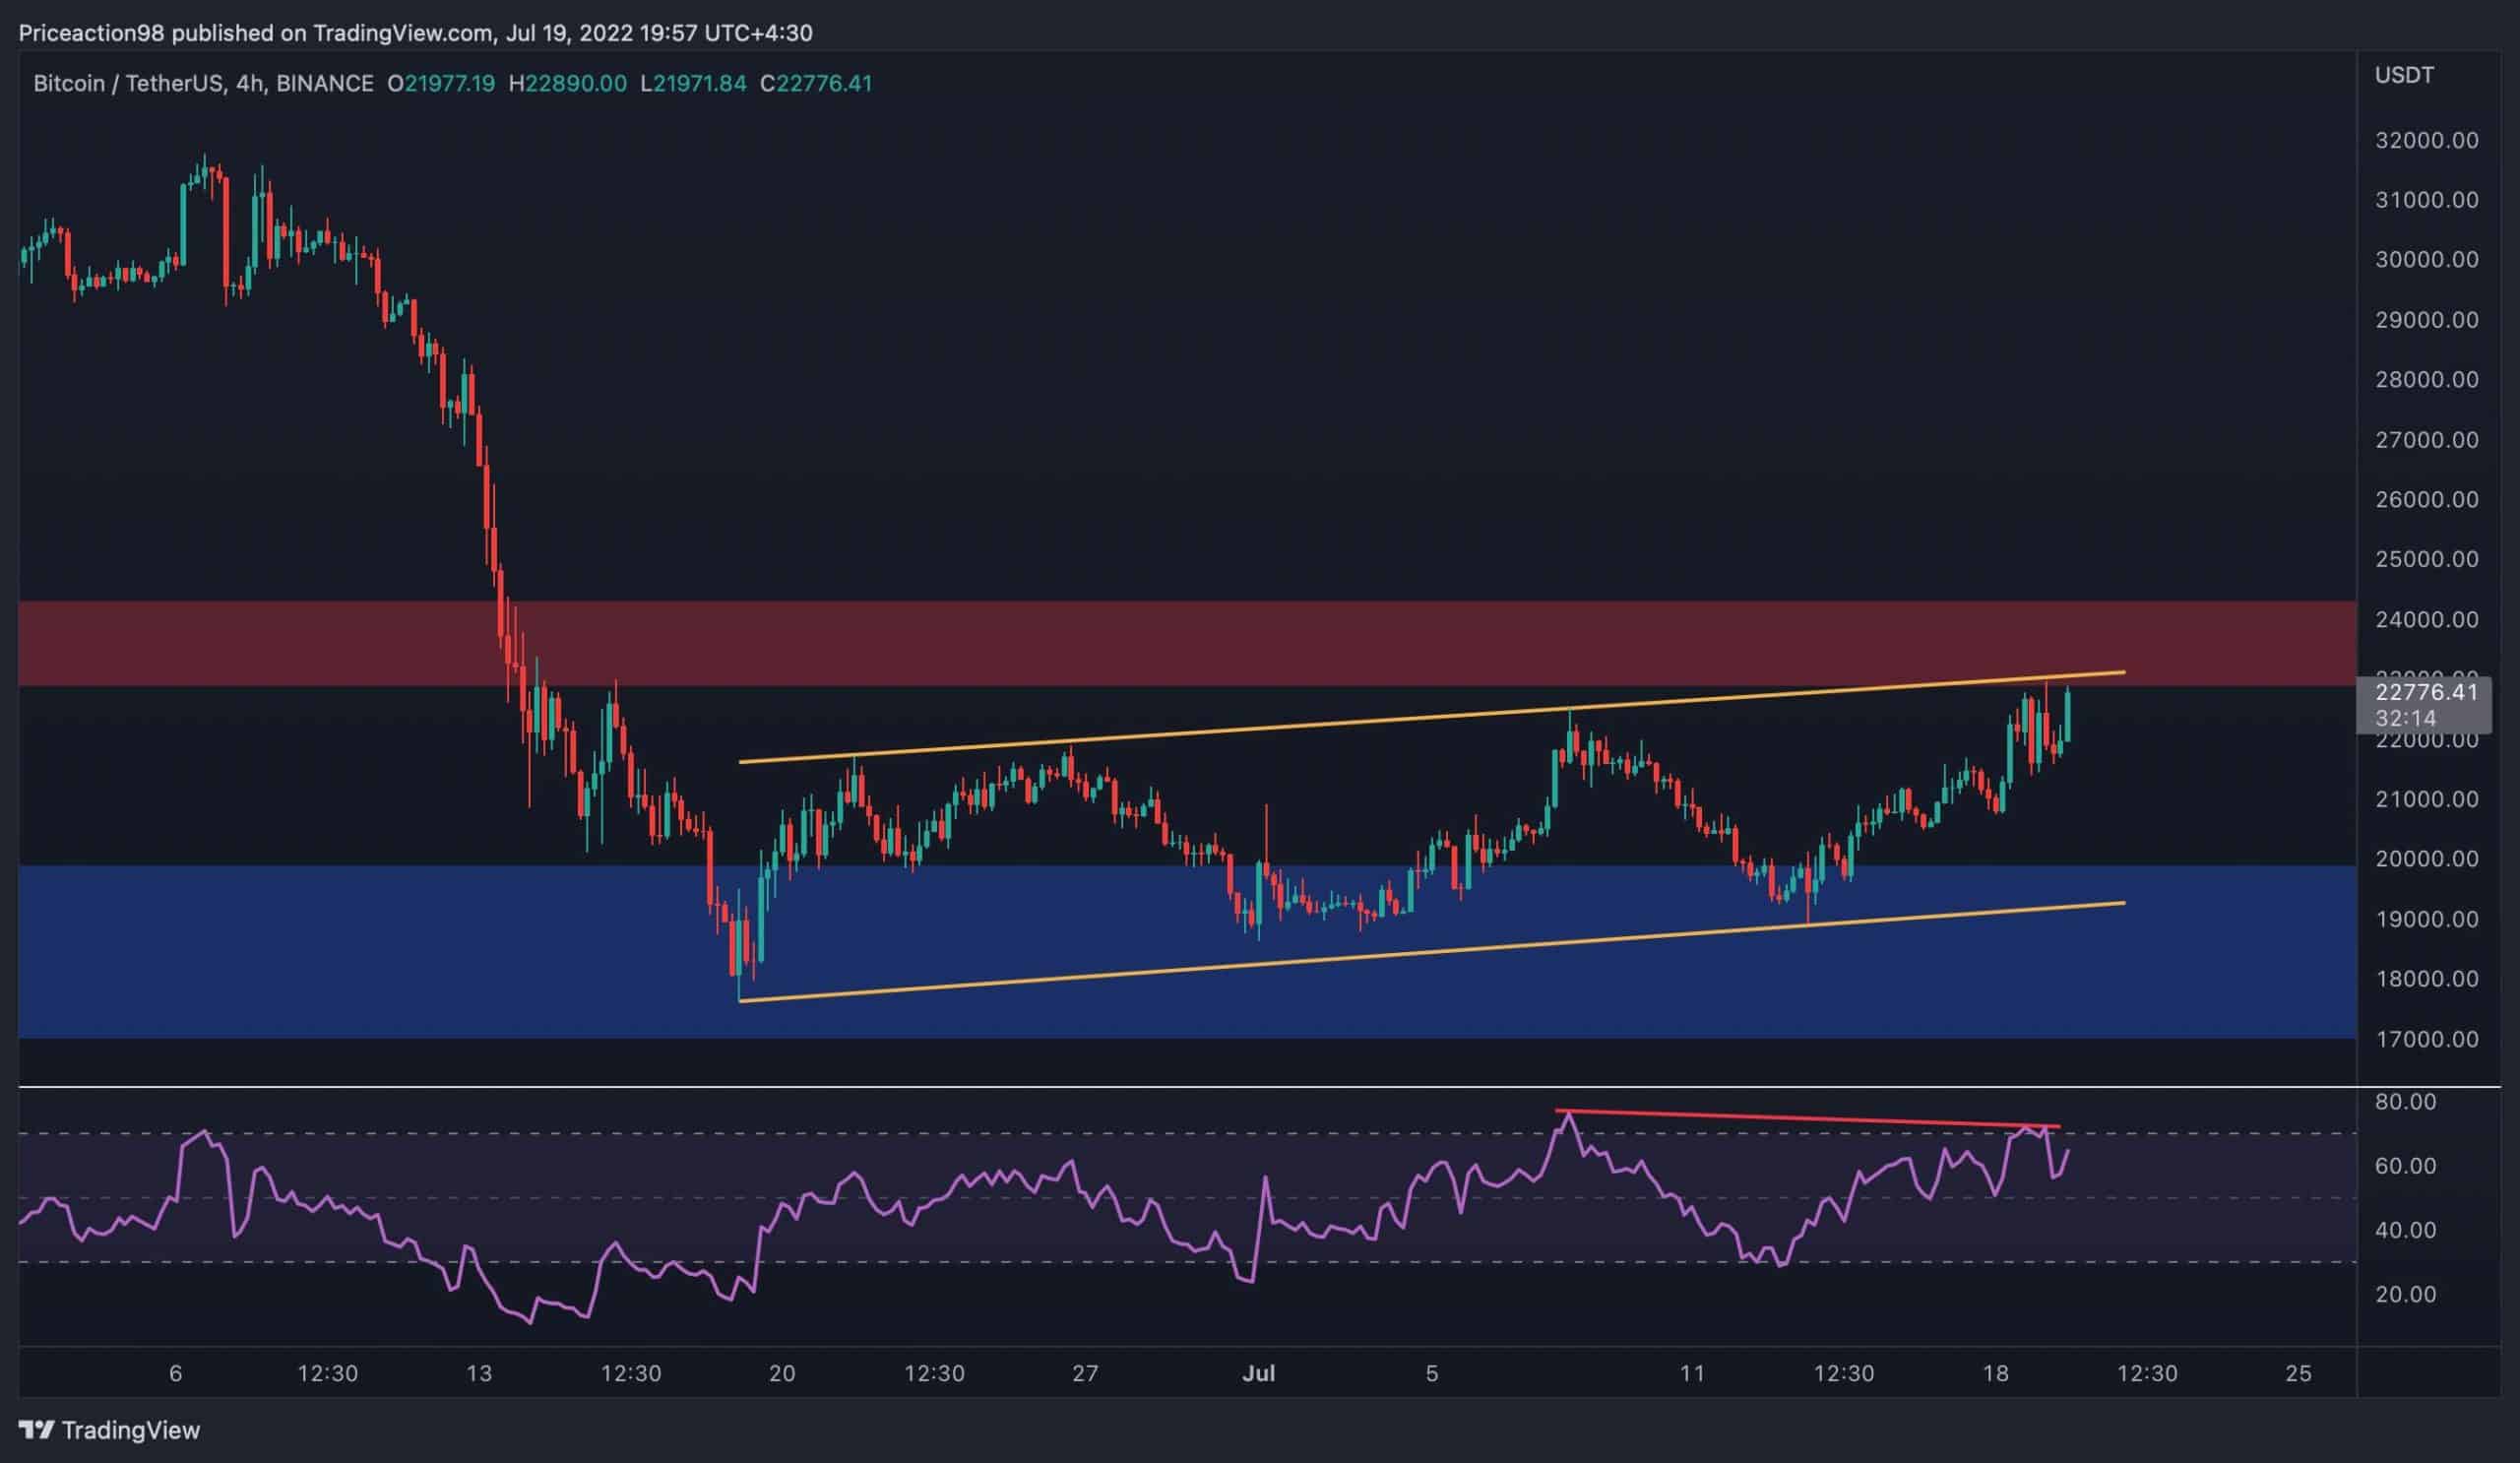
On the 4-hour timeframe, it is evident that the price is still trapped inside the bearish flag pattern and is currently retesting the top trendline of the pattern for the fourth time. The price action in this area has been showcasing some weakness. Moreover, the RSI indicator’s bearish divergence, formed between the two last highs, backs up this observed weakness.

Therefore, the more likely outcome is a rejection from the current resistance level leading to a bearish continuation towards $17K and beyond. However, this scenario would be invalid if the price breaks the upside pattern and holds above the $24K level. In this case, a bullish leg towards the $30K supply zone would be highly probable.
On-chain Analysis
By Shayan
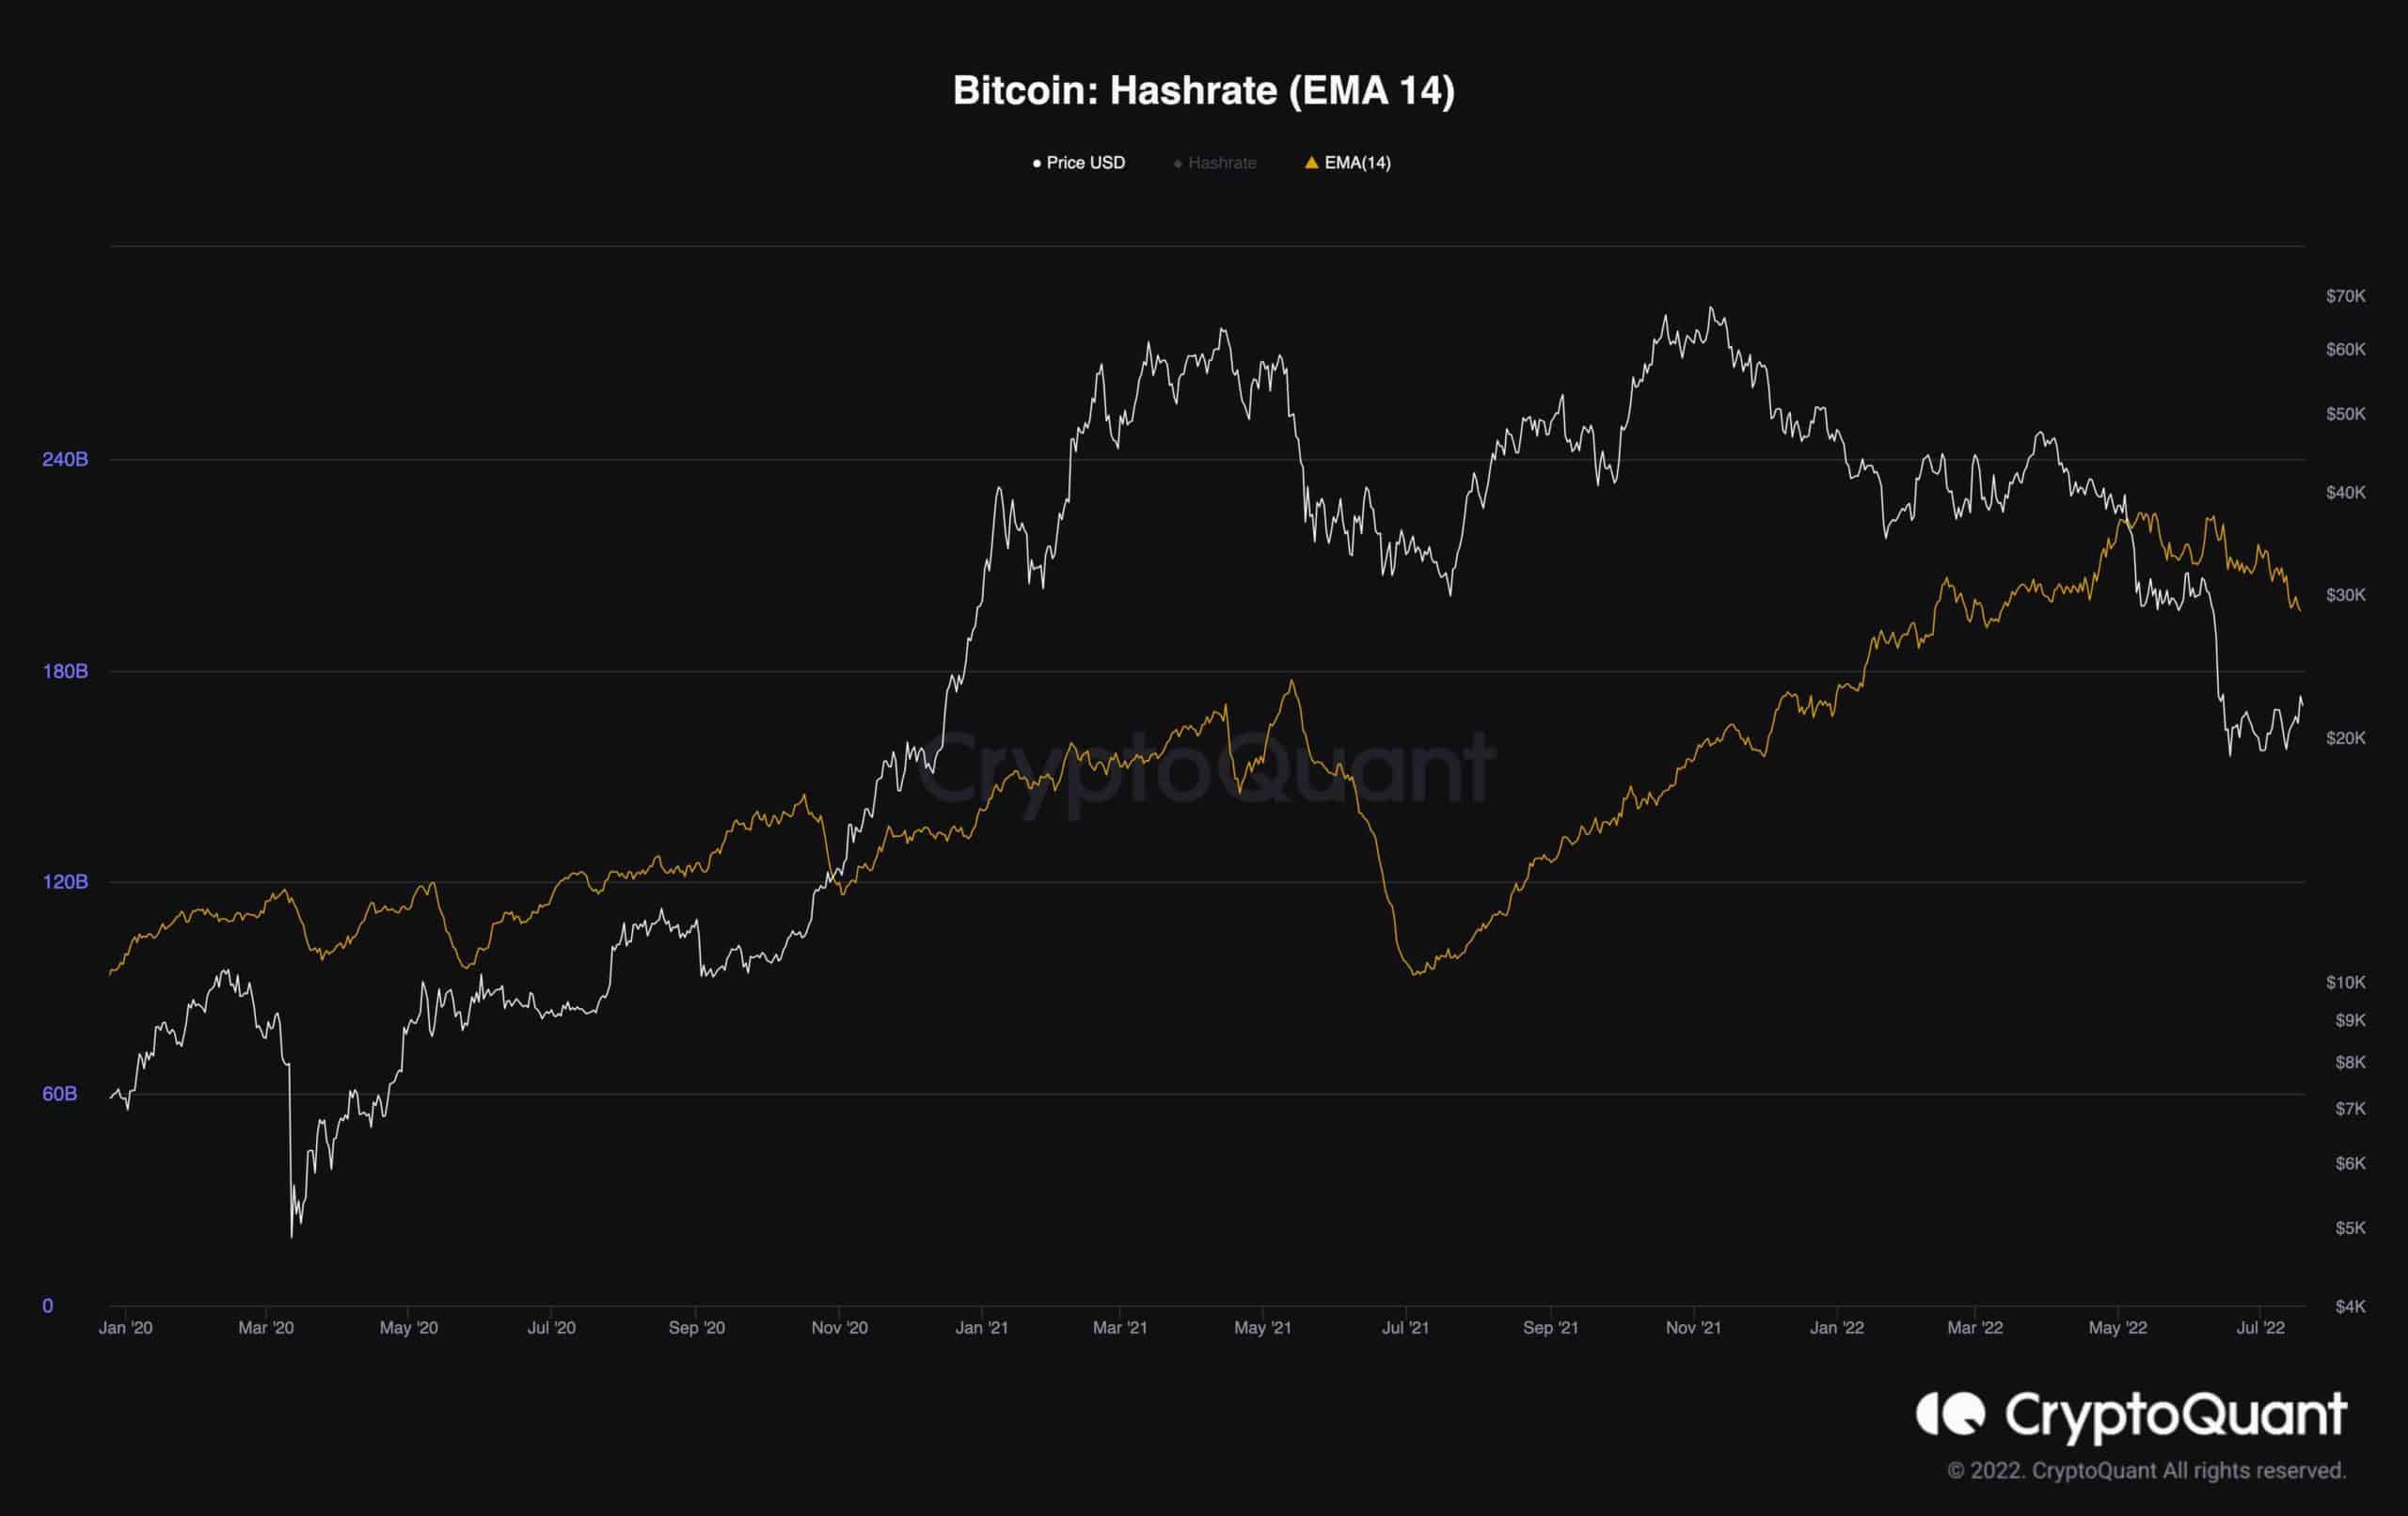
As stated in our previous analysis, Miners have recently joined the capitulation phase and have been slightly distributing their assets. The same behavior is seen in Bitcoin’s hashrate, as it has been in a slight downtrend after registering a new all-time high during the recent massive shakeout.

Considering that Bitcoin’s price is down roughly 74% from its all-time high and mining might not be lucrative for many miners and pools, this slight decline in the hashrate is not unexpected. However, given the magnitude of the recent price correction, the hashrate is still holding up pretty well. Bottom line, Miners’ capitulation has historically marked the final stage of the bear market. Thus, there is a high probability that Bitcoin is about to find its long-term bottom and begin a new rally to higher price levels.


