BTC Sharply Rejected at $24K Again, is a Correction Imminent? (Bitcoin Price Analysis)
Over the last week, Bitcoin has seen many bullish on-chain and technical signals. However, reaching a significant resistance level at $24K, there has been a battle between the bulls and the bears. The main question is whether it is the beginning of a bull market or just a bull trap.
Technical Analysis
By Shayan
The Daily Chart
Bitcoin’s impulsive uptrend has been halted by the psychologically significant resistance level of $24K. Meanwhile, the price has entered a consolidation stage, printing multiple big shadows on the candle chart.
This structure implies that there has been a battle going on at this crucial level. The winner will determine the mid-term direction. In case of a breakout from the mentioned level, the market may suddenly surge.
On the other hand, the 50-day moving average has claimed the 100-day moving average at roughly $18.7K, a definite bullish sign for the price in terms of price action.
Furthermore, the price has recently exceeded the long-term descending trendline. Yet, the momentum of the breakout was not strong enough to rule out the fake breakout scenario.

The 4-Hour Chart
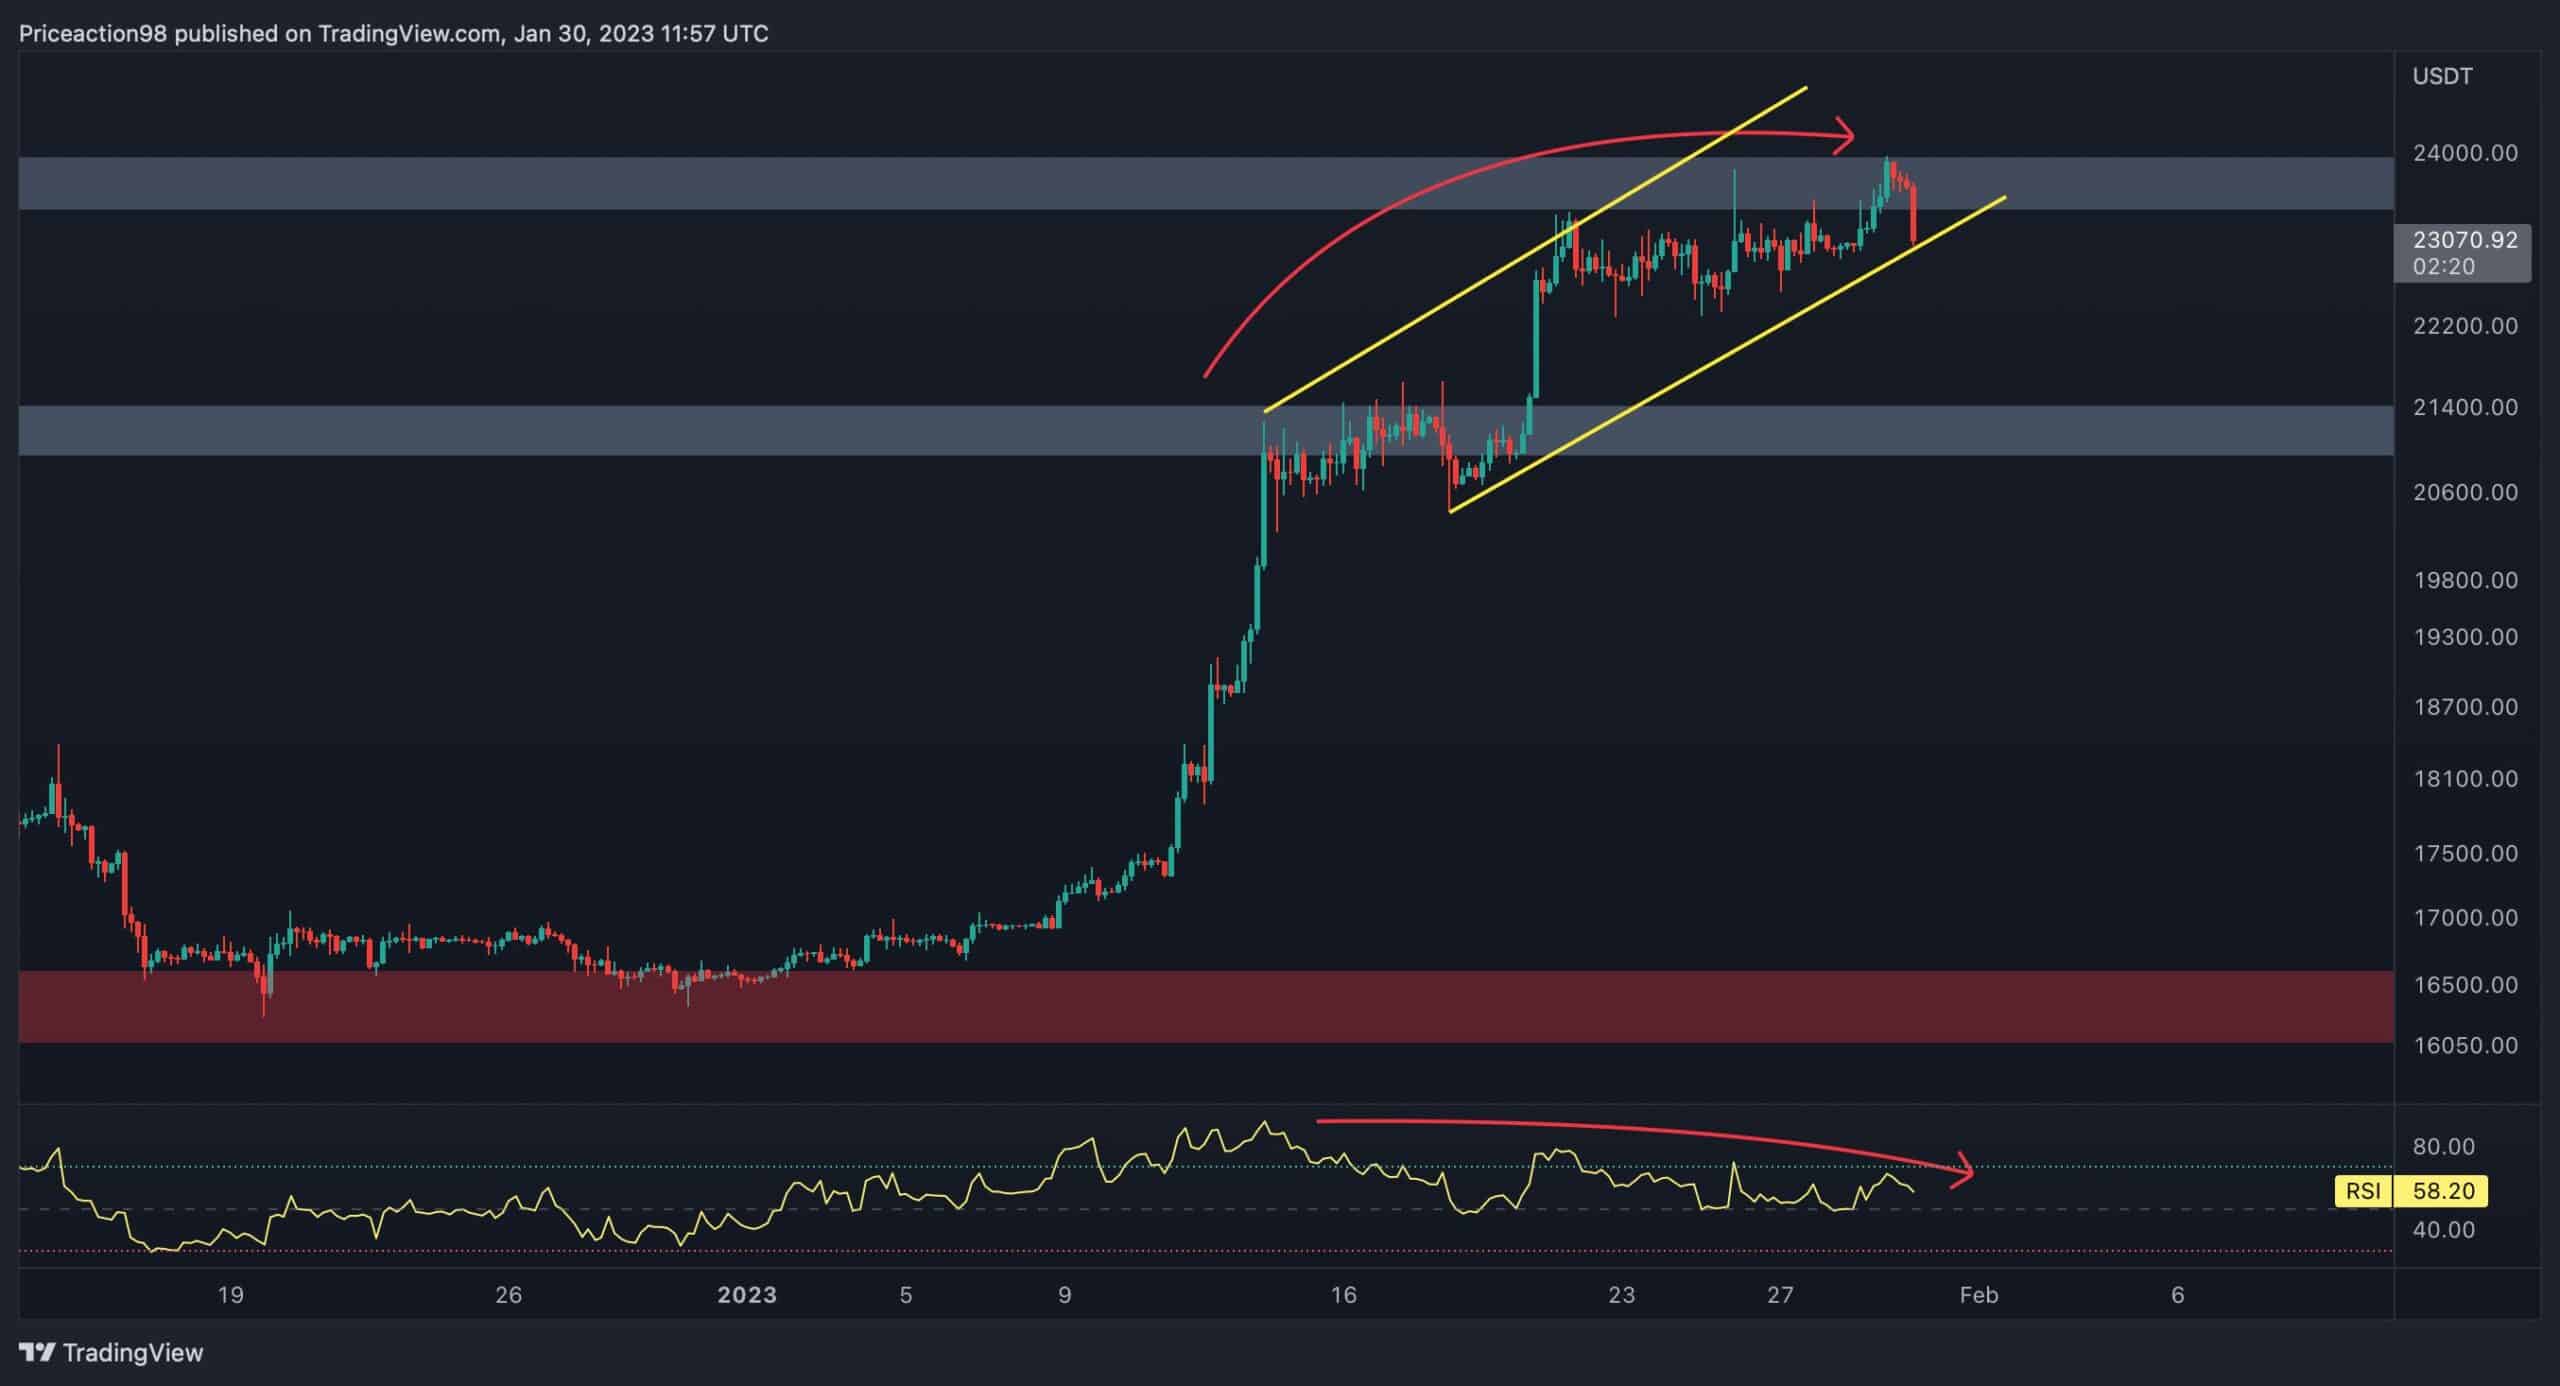
Despite the bullish signals on the daily chart, the price action doesn’t look so good in the 4-hour timeframe. Bitcoin faces two crucial resistance levels; $24K and $25K. Presently, the price is fluctuating at the $23K region and has formed a three drives reversal pattern inside a bearish ascending flag. A short-term correction stage might take place if Bitcoin falls below the lower trendline.
On the other hand, if the trendline supports the price, the next stop will be the primary resistance level of $25K. Furthermore, the divergence between the RSI indicator and the price has been emphasized, signaling a short-term consolidation correction phase might happen soon.

On-chain Analysis
By Shayan
Despite Bitcoin reaching what many describe as the early stage of a bull market, the amount of BTC entering the exchanges has remained moderate. Furthermore, BTC whales, a vital cohort among market participants with more than 1,000 bitcoin holdings, haven’t yet transferred a considerable amount of coins to the exchanges.
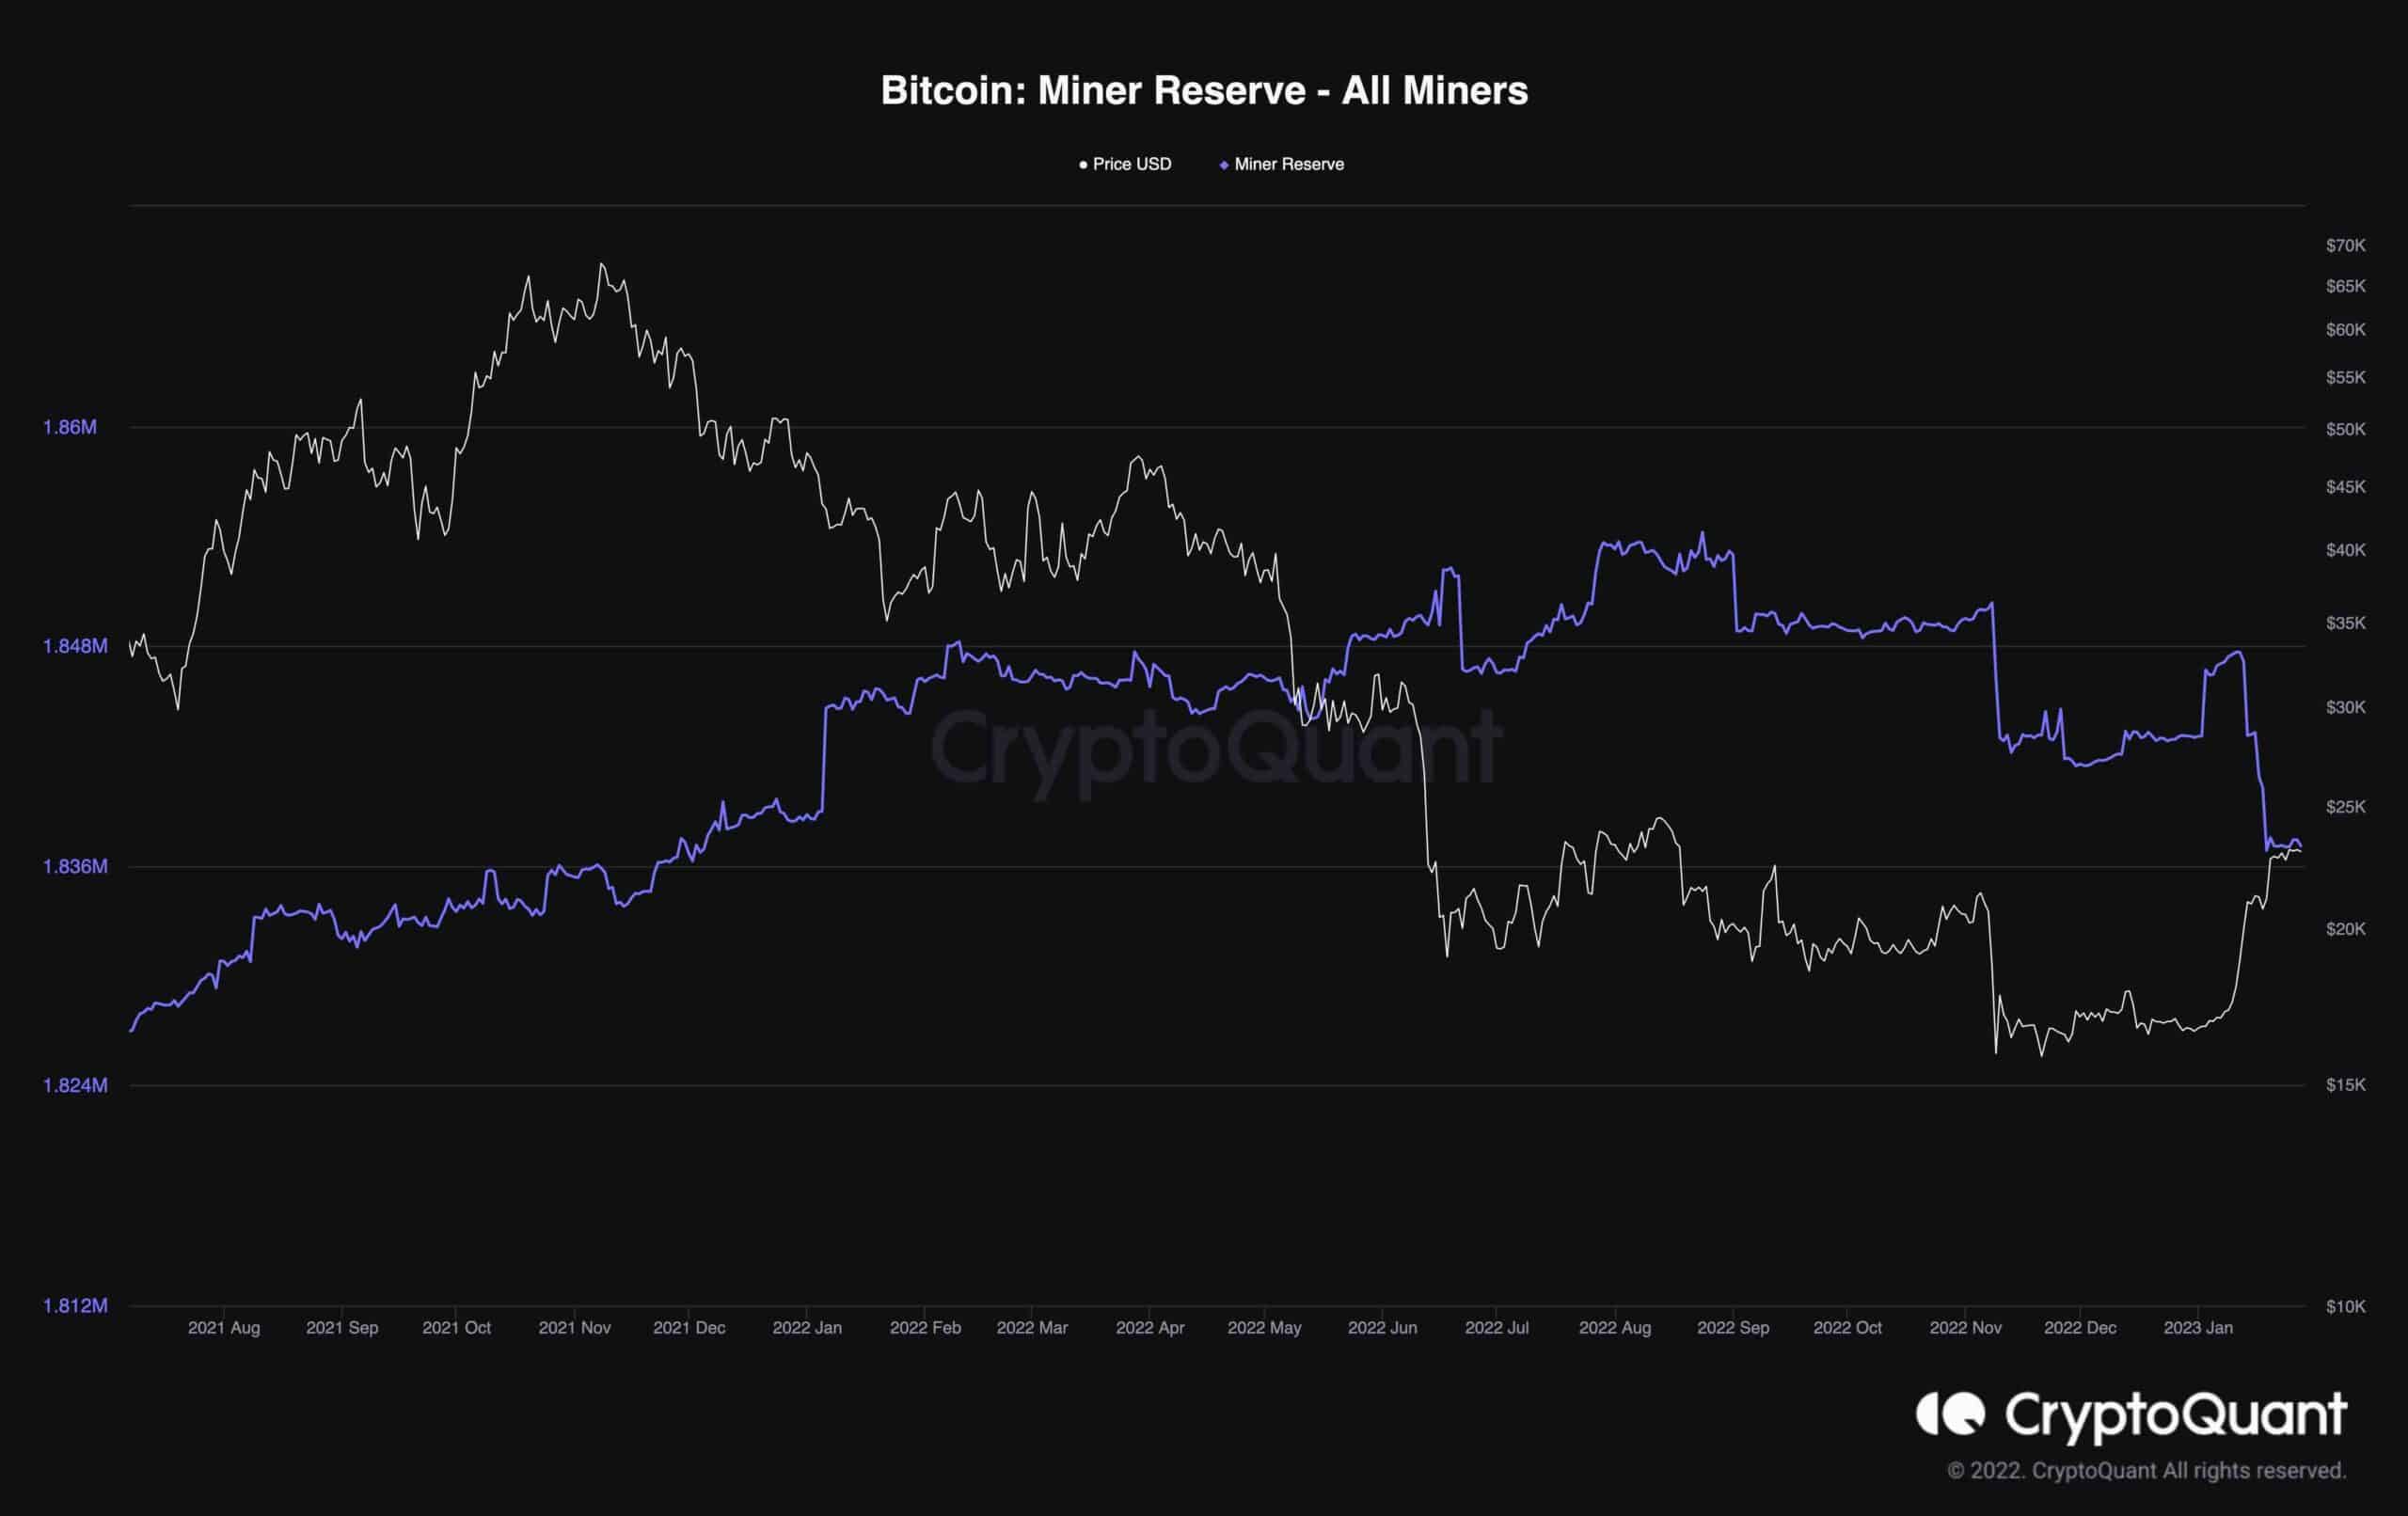
On the other hand, Bitcoin miners are another crucial cohort that affects the market with their spending behavior. The following chart demonstrates the Miner Reserve metric alongside the price. In the case of miners, a considerable spike can be observed in bitcoin flows into exchanges (5,592 BTC on January 19) once prices claimed the $20K price level.
As a result, the Miner Reserve metric has experienced a sudden decline, implying that the recent uptrend provides an excellent chance for this essential cohort to control their exposure to the market, manage their mining expenses, and distribute their holdings to realize profits. If the spending behavior continues, the market could go into a short-term consolidation in the coming days.

The post BTC Sharply Rejected at $24K Again, is a Correction Imminent? (Bitcoin Price Analysis) appeared first on CryptoPotato.


