BTC Price Analysis: Where Is Bitcoin Headed After $100K Rejection?
Bitcoin is struggling with low trading activity and weak momentum, leading to subdued price action near the 100-day moving average.
However, a strong bullish rebound remains possible, contingent on a return of sufficient liquidity to the market.
Technical Analysis
By Shayan
The Daily Chart
Bitcoin remains in a phase of indecision, with price action hovering near the 100-day moving average at $98K. This prolonged consolidation, characterized by low volatility and weak momentum, suggests a balance between buyers and sellers.
The RSI indicator reinforces this notion, highlighting an ongoing struggle between bullish and bearish forces, with the $98K support and the $108K resistance emerging as key battlegrounds. However, a decisive move in either direction is unlikely until liquidity returns to the market. Despite this uncertainty, an ultimate bullish breakout appears more probable, given the presence of multiple support zones below the current price, indicating strong buyer interest.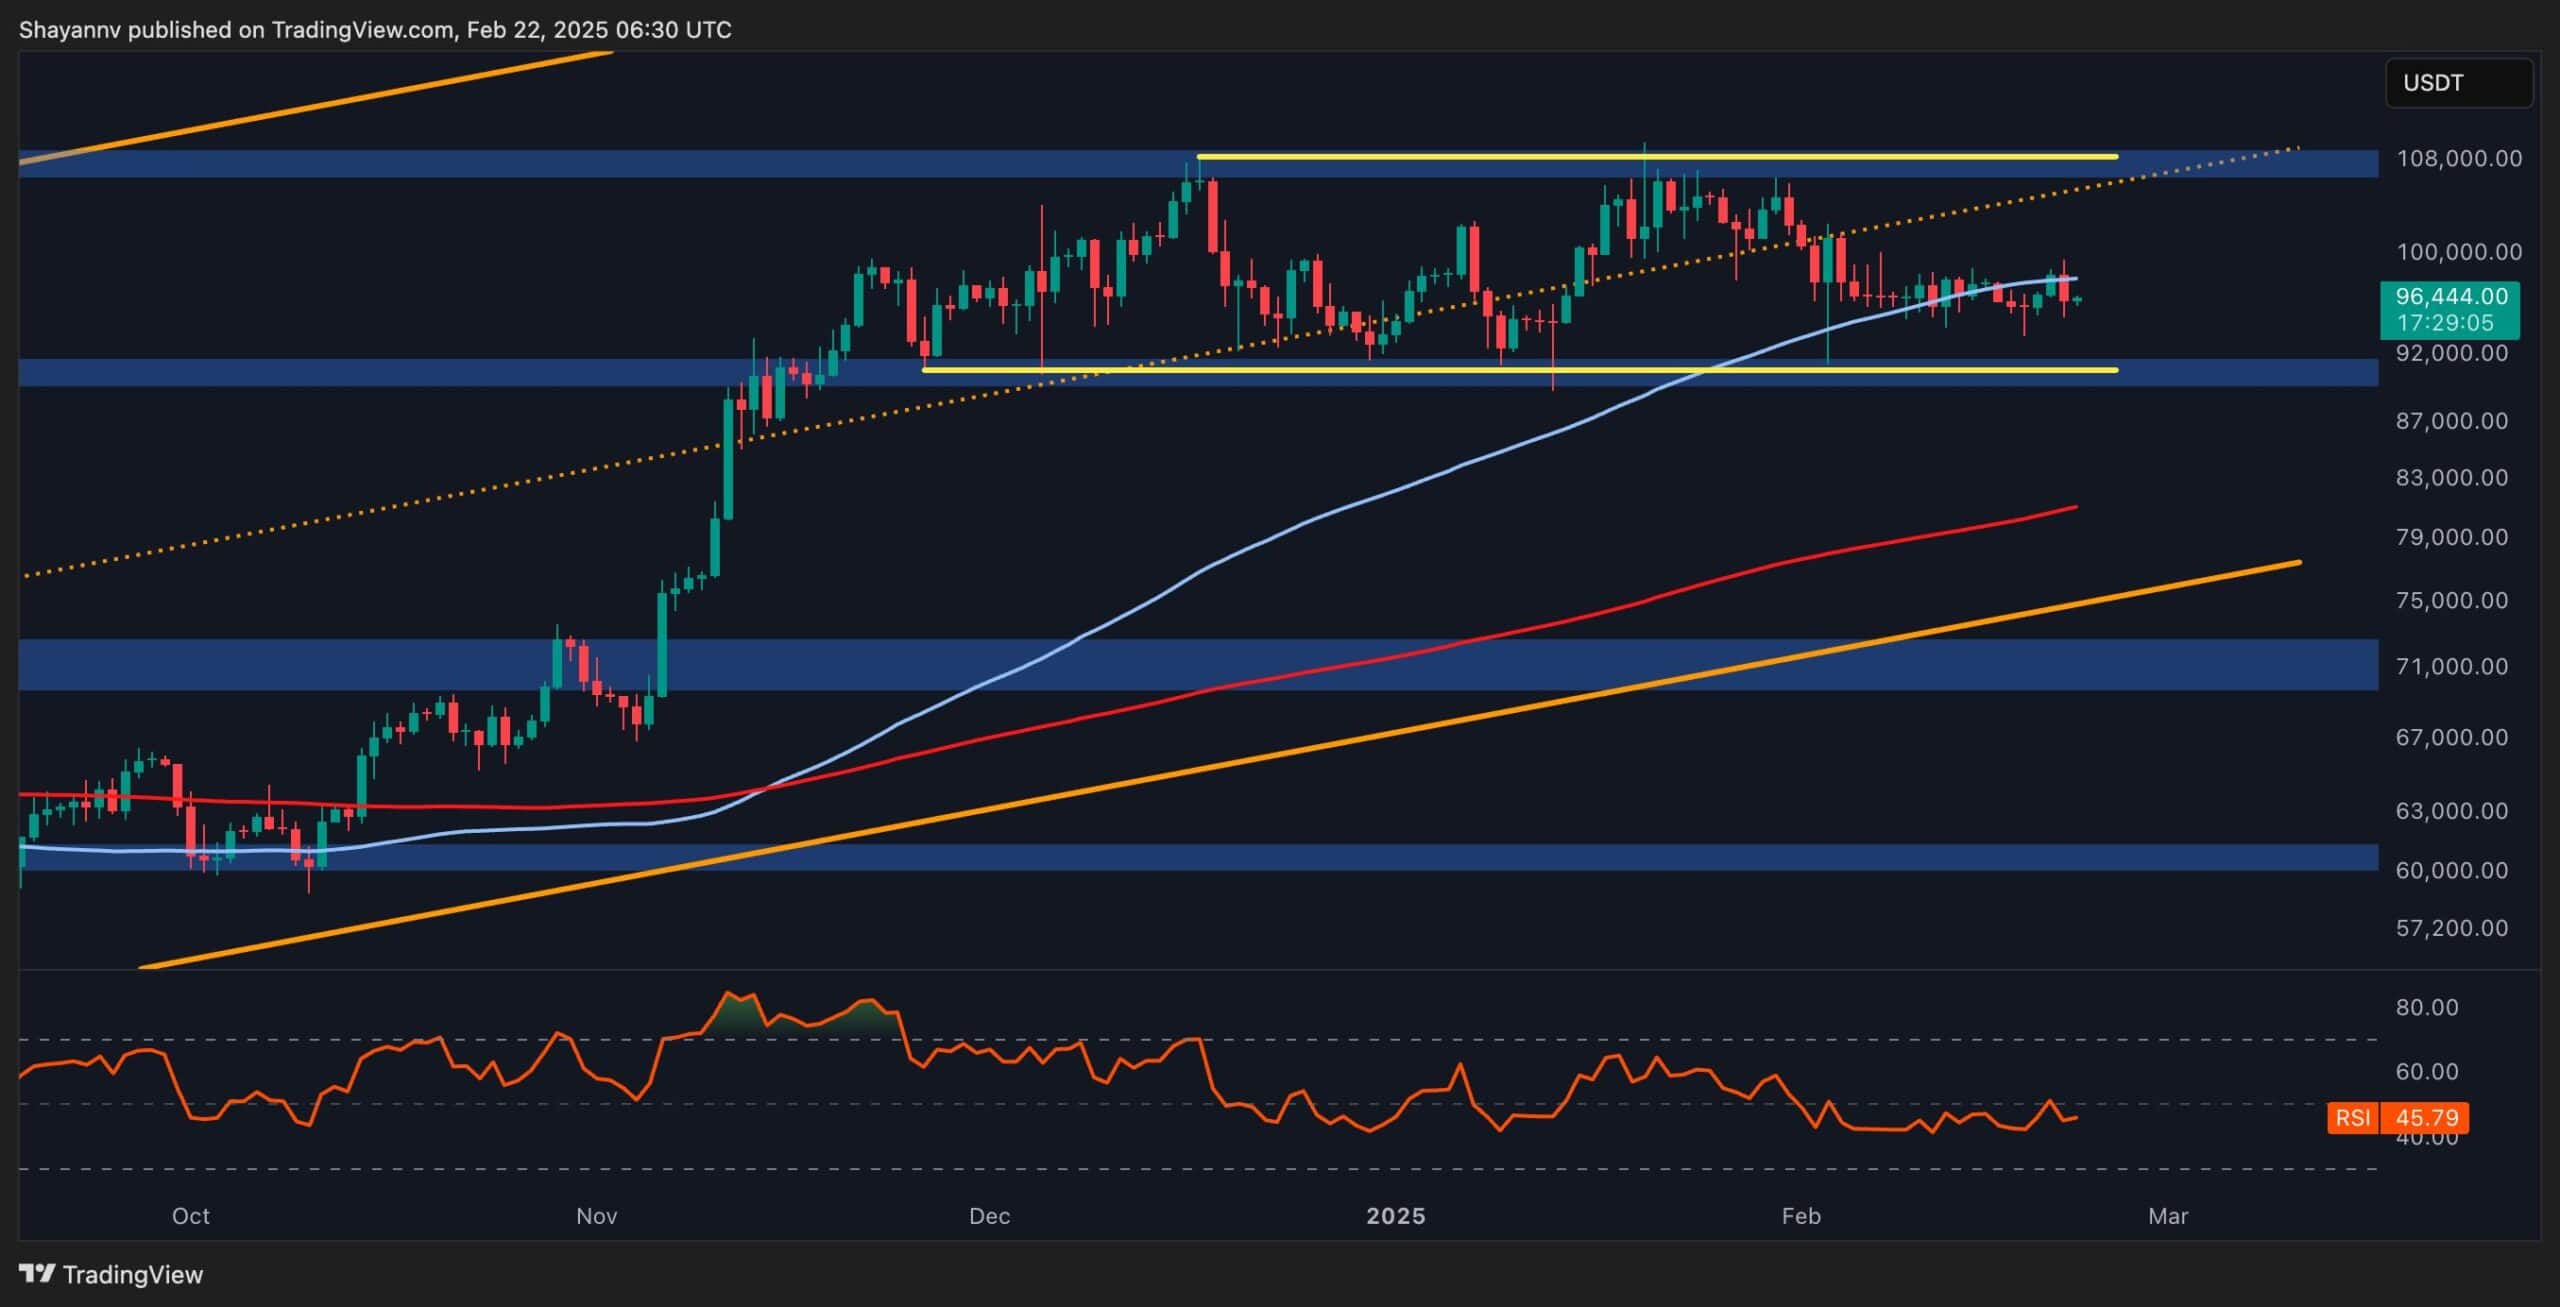
The 4-Hour Chart
On the lower timeframe, Bitcoin initially attempted a bullish push but failed to break above the upper boundary of the bullish flag, facing rejection due to insufficient buying momentum. Consequently, the asset has retraced toward the Fair Value Gap, a historically significant demand zone that has provided support in recent months.
Currently, Bitcoin is confined between the critical $90K support and the dynamic upper trendline of the bullish flag. A breakout above this pattern could ignite a fresh rally, potentially driving the price toward a new all-time high beyond $108K. BTC will likely remain range-bound within this consolidation phase until a clear directional move occurs.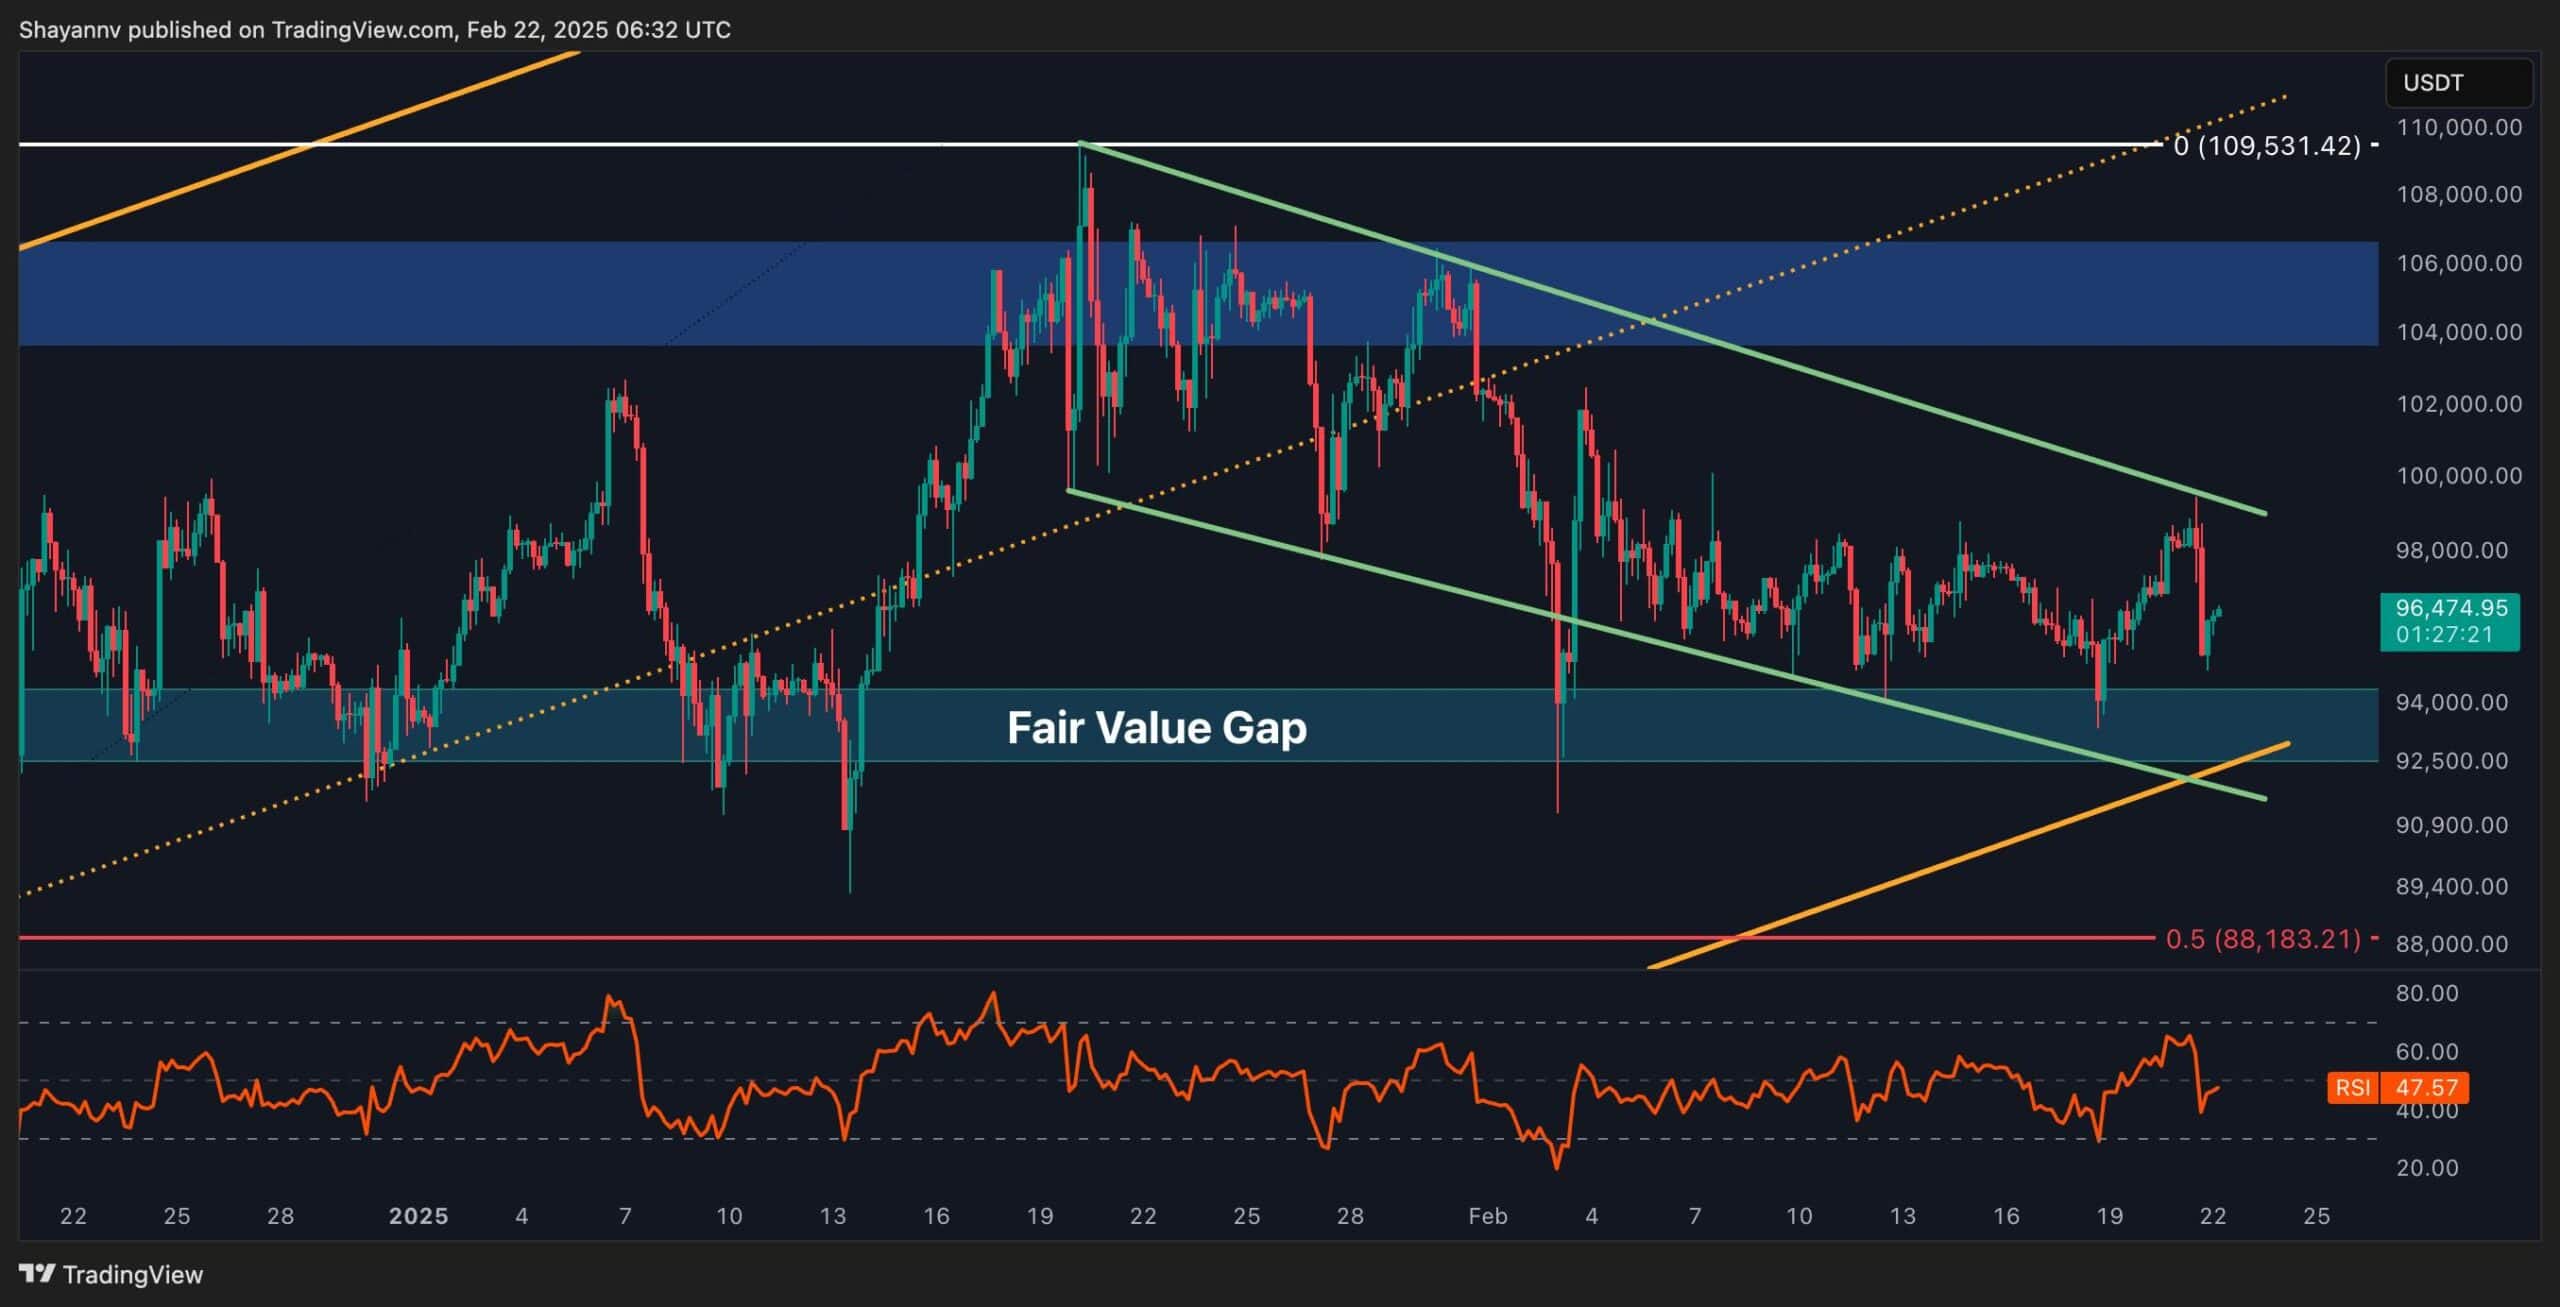
On-chain Analysis
By Shayan
Given Bitcoin’s indecisive price action and lack of a clear directional move, analyzing market participants’ accumulation and distribution behavior can provide valuable insights.
The chart below illustrates the BTC exchange reserve metric, which tracks the amount of Bitcoin held in trading platforms’ wallets. This metric serves as an indicator of potential selling pressure, as holdings stored on exchanges can be quickly sold.
Notably, the exchange reserve has been declining sharply in recent days, signaling a possible accumulation phase and a reduction in available supply. A similar trend was observed in December 2022, preceding a significant price surge following a substantial drop in exchange reserves. If this pattern persists, it could strengthen the case for an impending bullish breakout.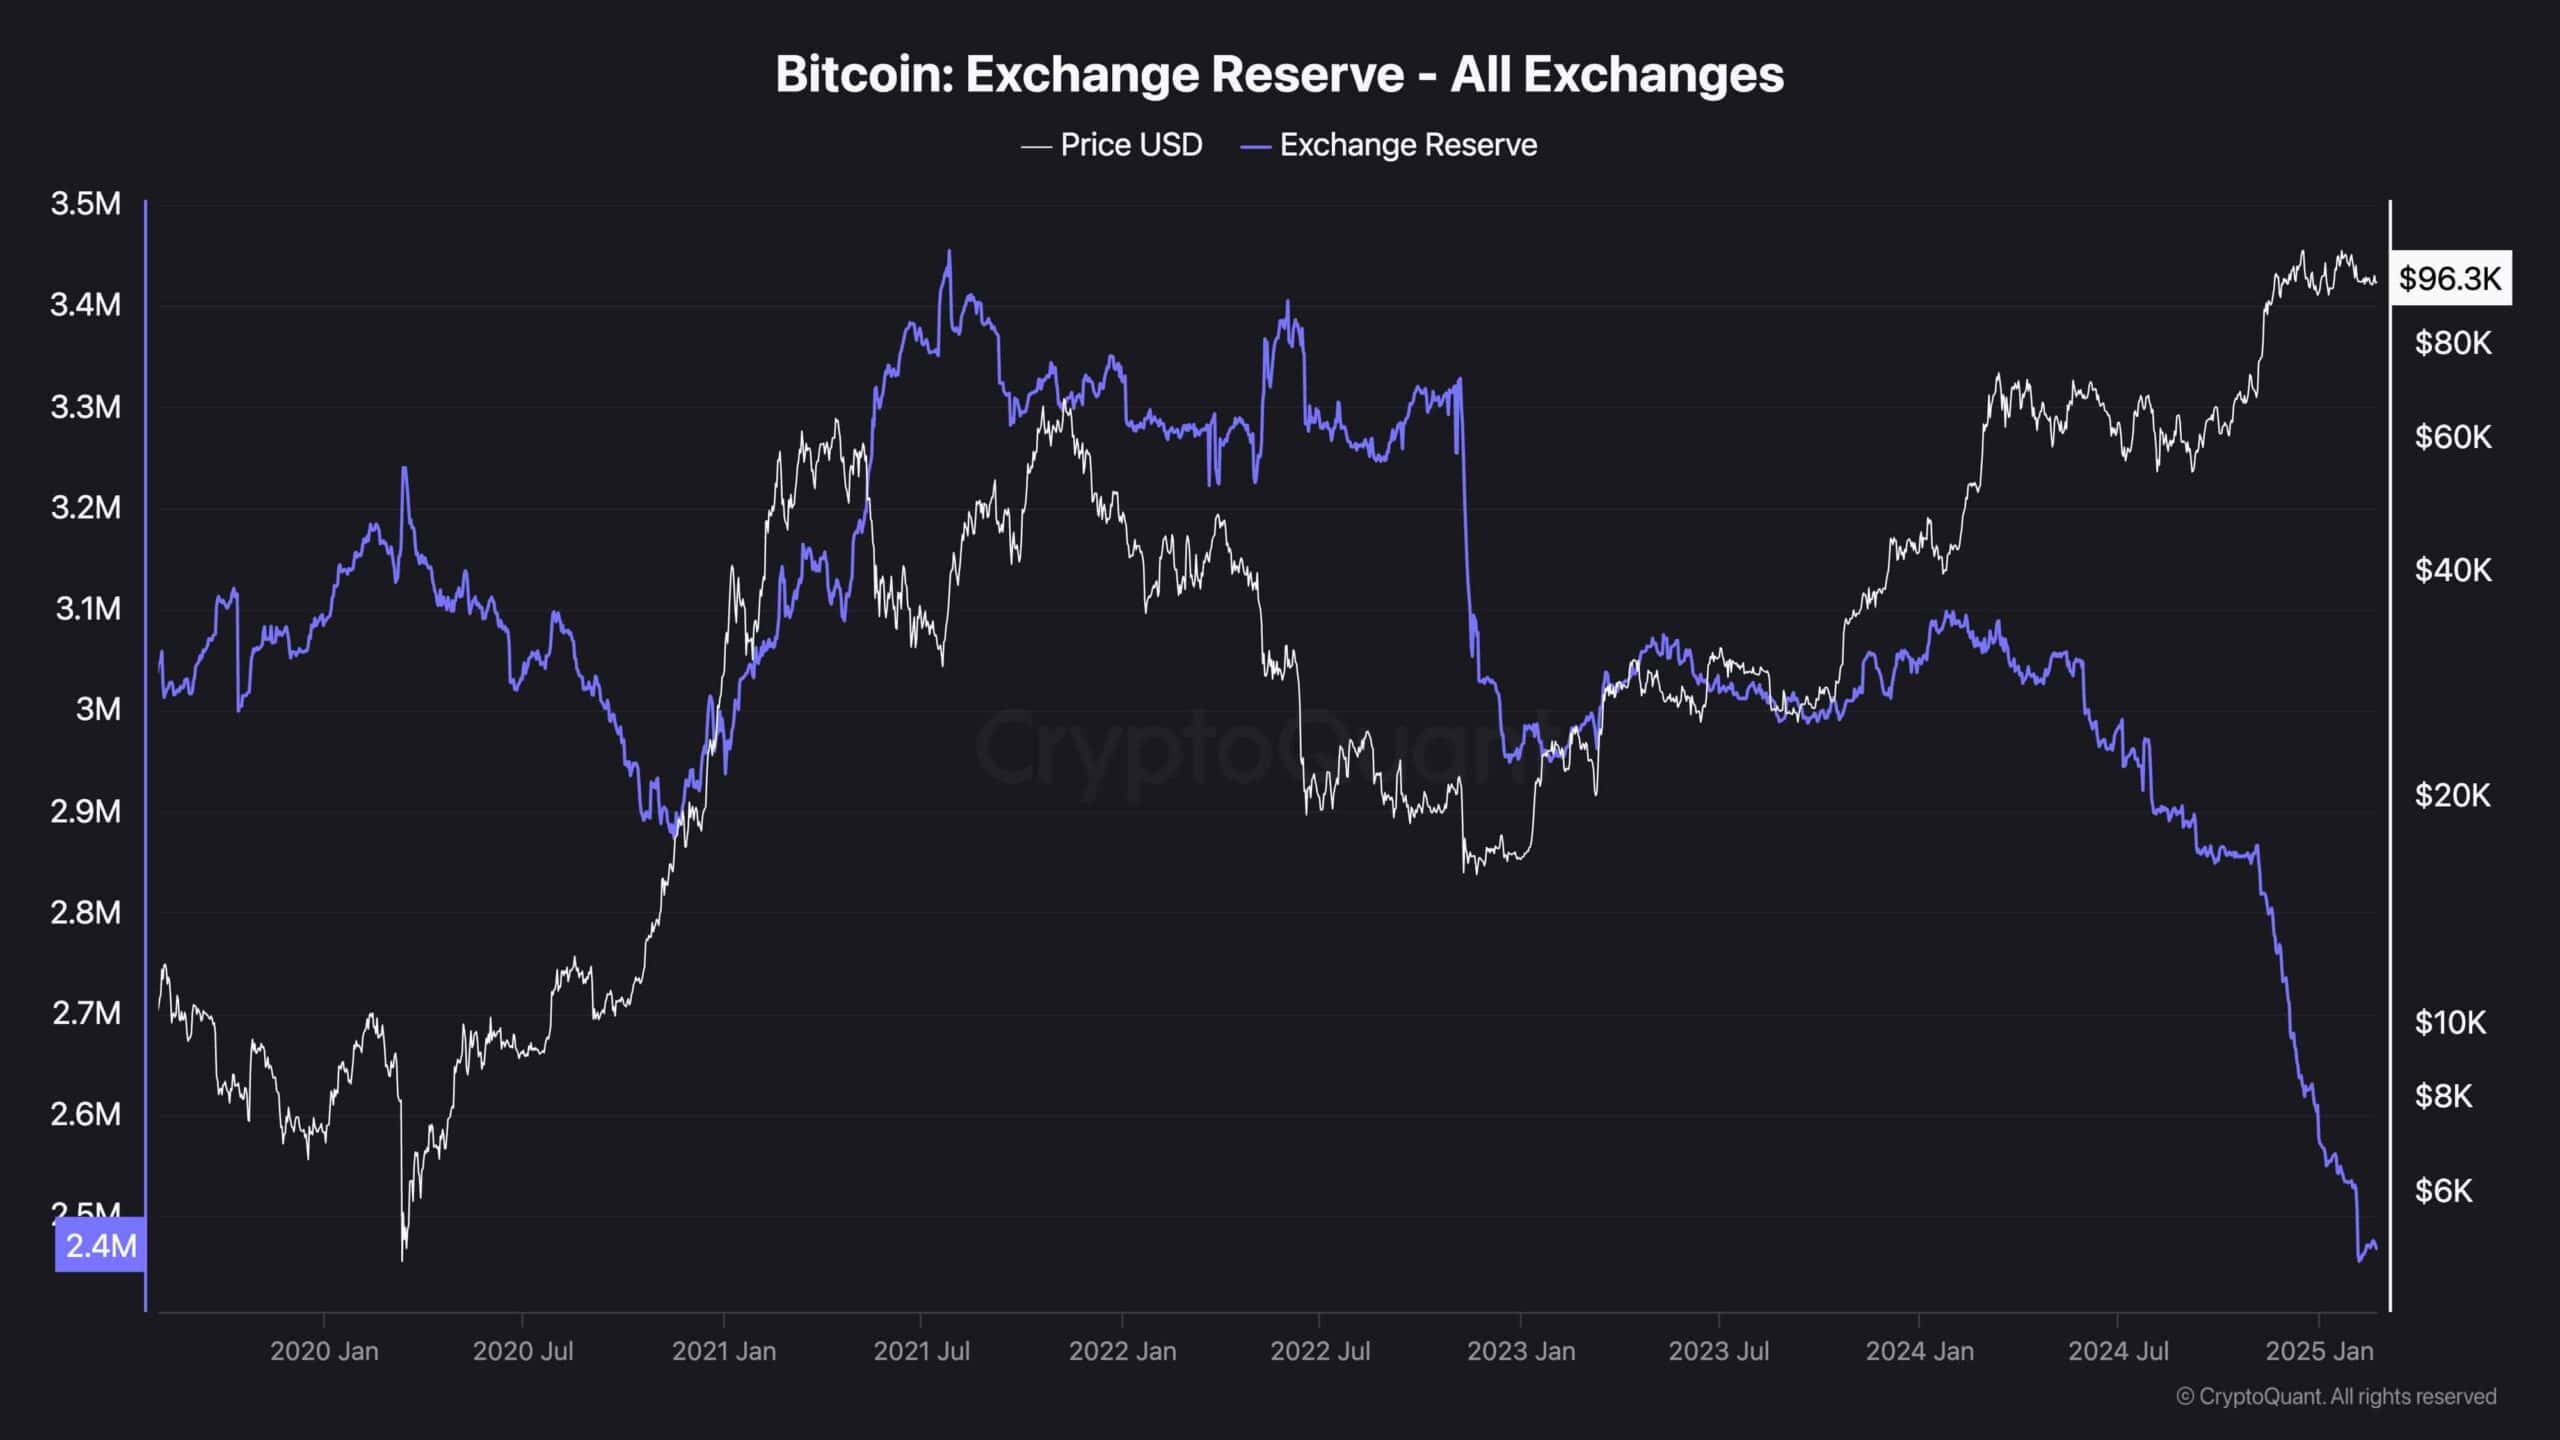
The post BTC Price Analysis: Where Is Bitcoin Headed After $100K Rejection? appeared first on CryptoPotato.