BTC Price Analysis: What’s The Cycle’s Bitcoin Bottom According to Capitalization Models?
Bitcoin has been trading sideways in the past few weeks. It is still consolidating between the $36K and $45K levels, liquidating both bulls and bears on multiple occasions.
With the current economic and geopolitical uncertainty, it would be wise to consider the worst possible case and plan it.
Technical Analysis
By: Edris
The Daily Chart:
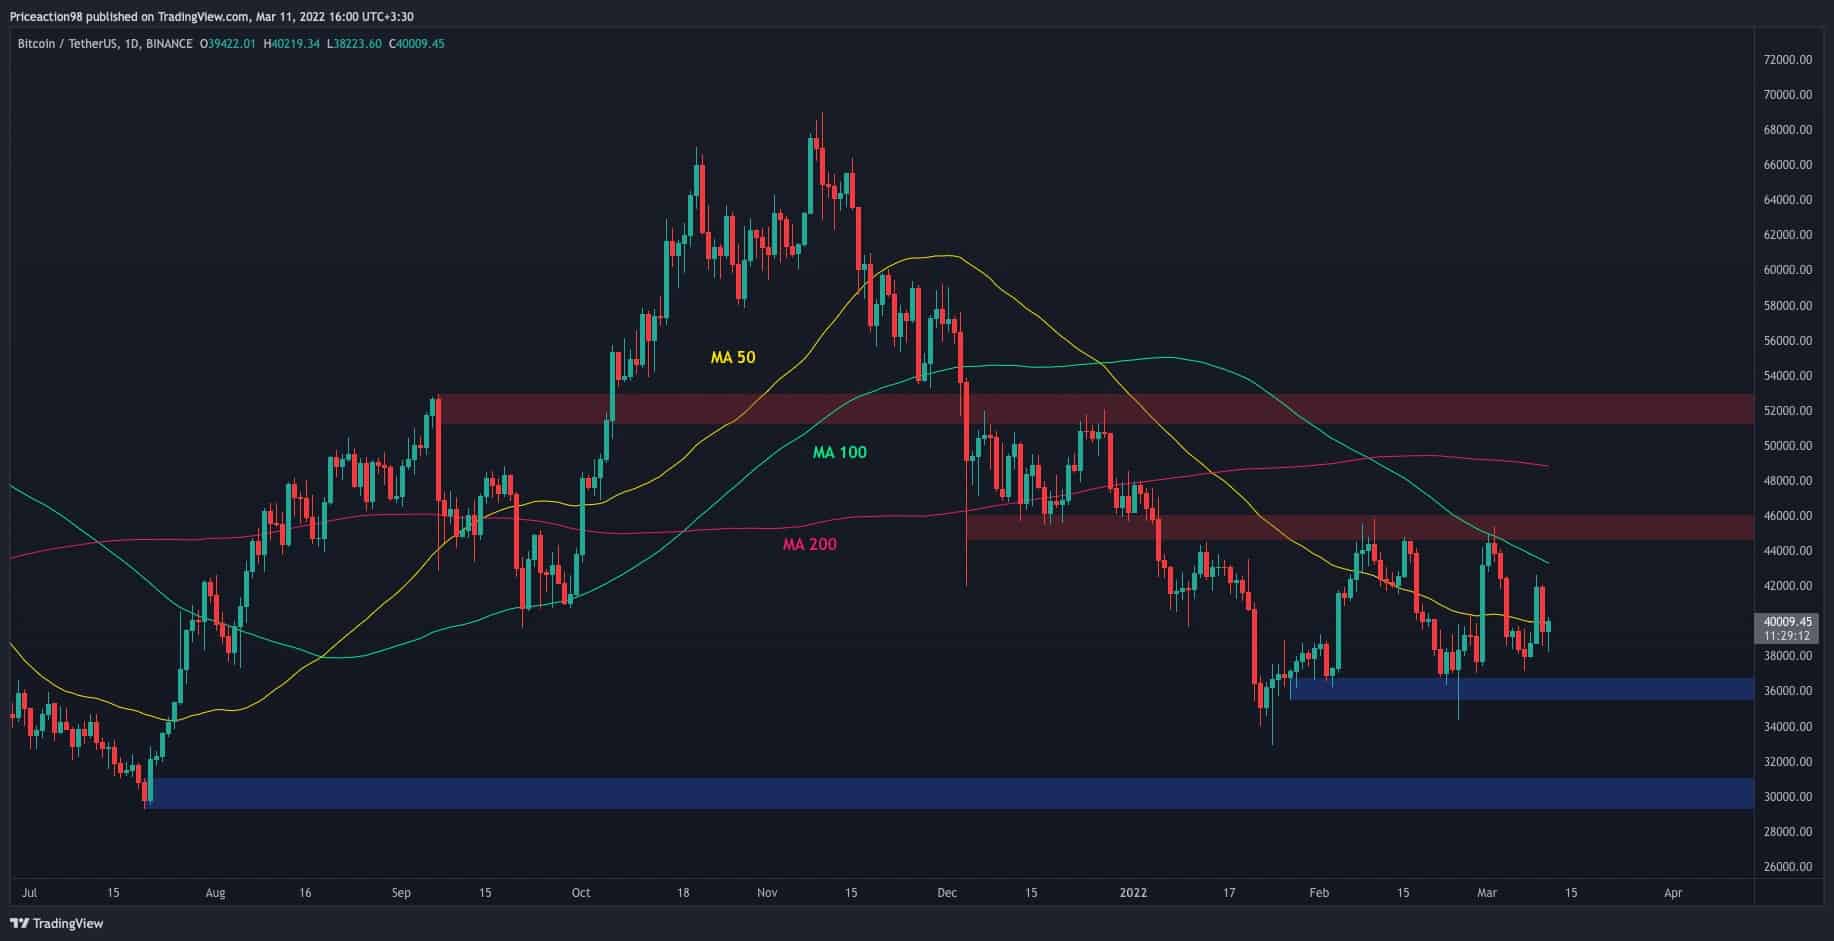
On March 7th, BTC rebounded from the lower boundary of the range and broke above the 50-day moving average. The next day, it regained the momentum for retesting and closing below the 50 DMA average.
Today, Bitcoin tested this dynamic resistance again but has so far failed in breaking it to the upside so far. Nevertheless, if the price succeeds, the following significant resistance line would be the 100 DMA, which was tested only once in early December last year.
Above the 100-day moving average, there is the higher boundary of the range, the $45K zone. It has rejected price four times since the beginning of 2022. On the other hand, if BTC is unable to break above the 50-day moving average, all eyes would be on the $36K support zone to see whether it can push the price higher once again.

The 4 Hour Chart:
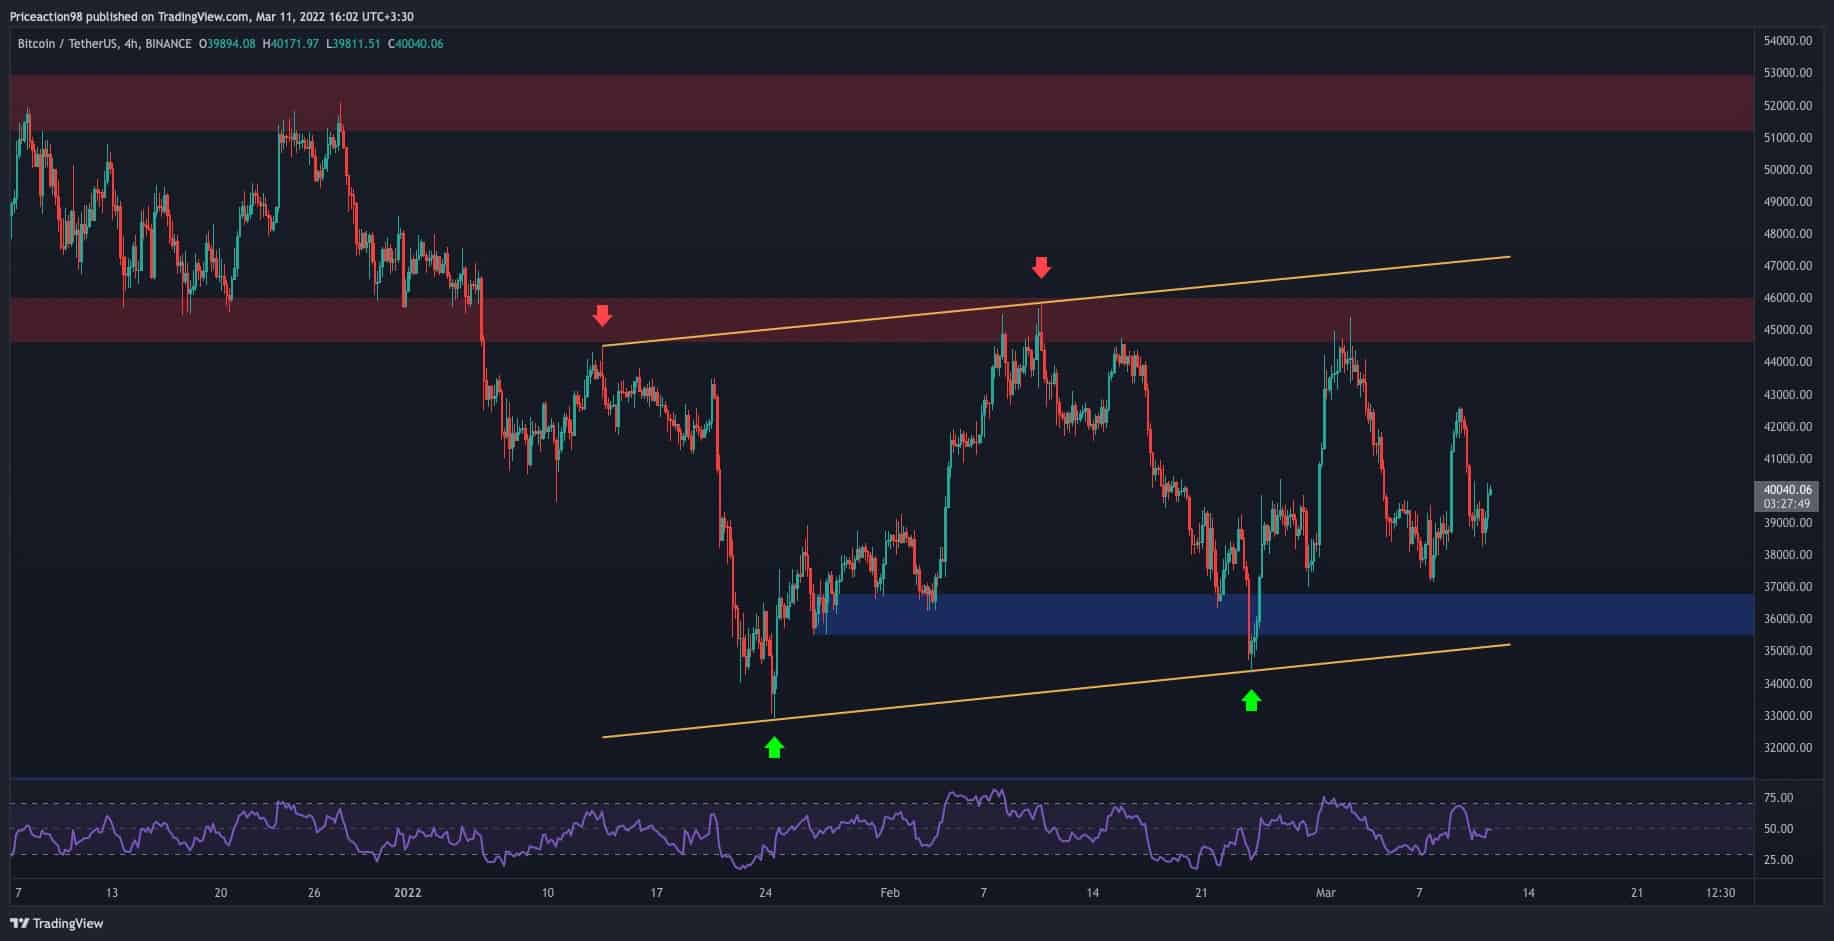
On the 4-hour timeframe, it is evident that BTC is still consolidating in the bearish flag pattern, failing to reach either trendline for the third time. This structure confirms the continuation of the bearish scenario, in which only a bullish breakout from the top trendline would disprove. Furthermore, the RSI demonstrates a balance of power between the bears and the bulls at the moment, as it sits at the 50% mark, trying to break above once more.

Onchain Analysis
By: Edris
Bitcoin Capitalization models
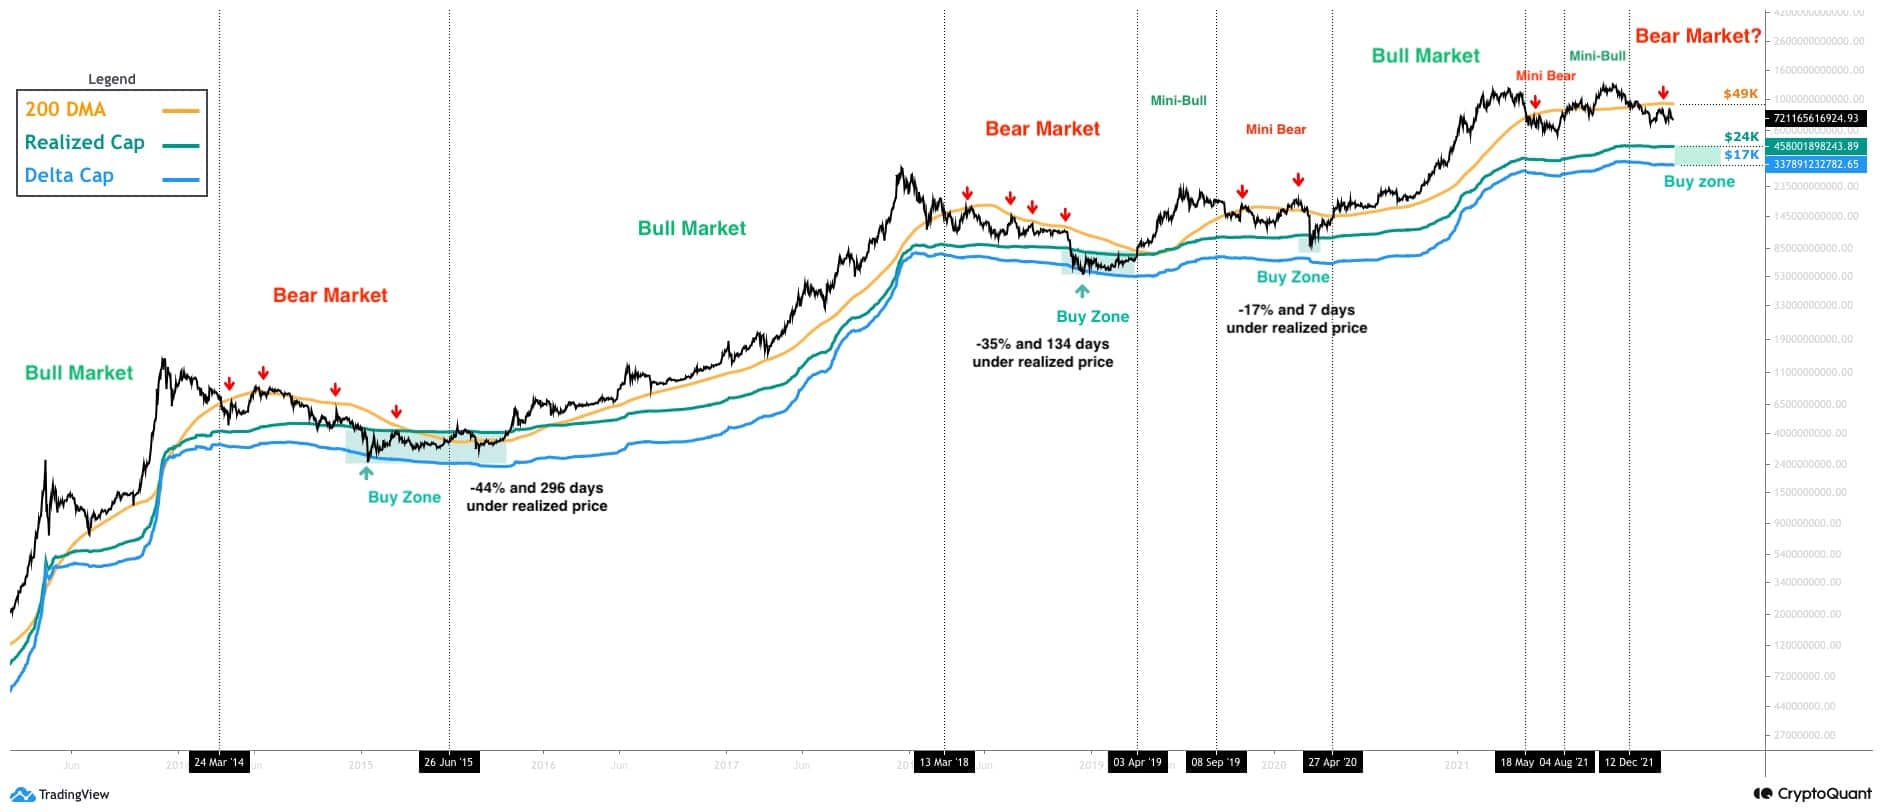
With the current economic and geopolitical uncertainty worldwide, it would be wise to consider the worst possible case and plan for it. The below chart consists of different Bitcoin capitalization models such as the Market Cap (black) and its 200-day moving average (yellow), Realized Cap (green), and Delta Cap (blue).

Historically, the 200 DMA has been reliable support in bull markets and strong resistance during bear markets. So, the areas above it are usually considered bull territory. The Realized Cap has also been reliable support in the first phase of the bear market. However, it tends to get broken to the downside for the final capitulation, and when the market returns above it, a bull (or mini-bull) market begins.
Finally, the Delta Cap has marked the absolute bottom of the last two bear markets with high precision. Considering these facts and the chart demonstrated, it is evident that the area between Delta Cap and Realized Cap has been the best buy zone over the past eight years. Currently, this price range would be $17K-$24K.
It also seems that the amount of time spent and the percentage of drawdown below the Realized Cap has been decreasing each cycle. This constant reduction could be explained by Bitcoin’s growing adoption, especially by institutional investors. More and more people are seeing value in Bitcoin over time, and they are eager to allocate a portion of their portfolios to the “Digital Gold” when it seems cheap. These capitalization models would be helpful to determine whether Bitcoin is undervalued or in a bubble.


