BTC Price Analysis: Here’s the Next Crucial Support for Bitcoin After Losing $40K
Though the major static and dynamic support lines failed on a daily time frame, the long-term holders’ sell pressure (inflows to all exchanges) was reduced after failing the $39K support levels. A consolidation phase in the $36K-$40K range is the most expected behavior for the mid-term window.
Technical Analysis
By: Edris
Long-Term
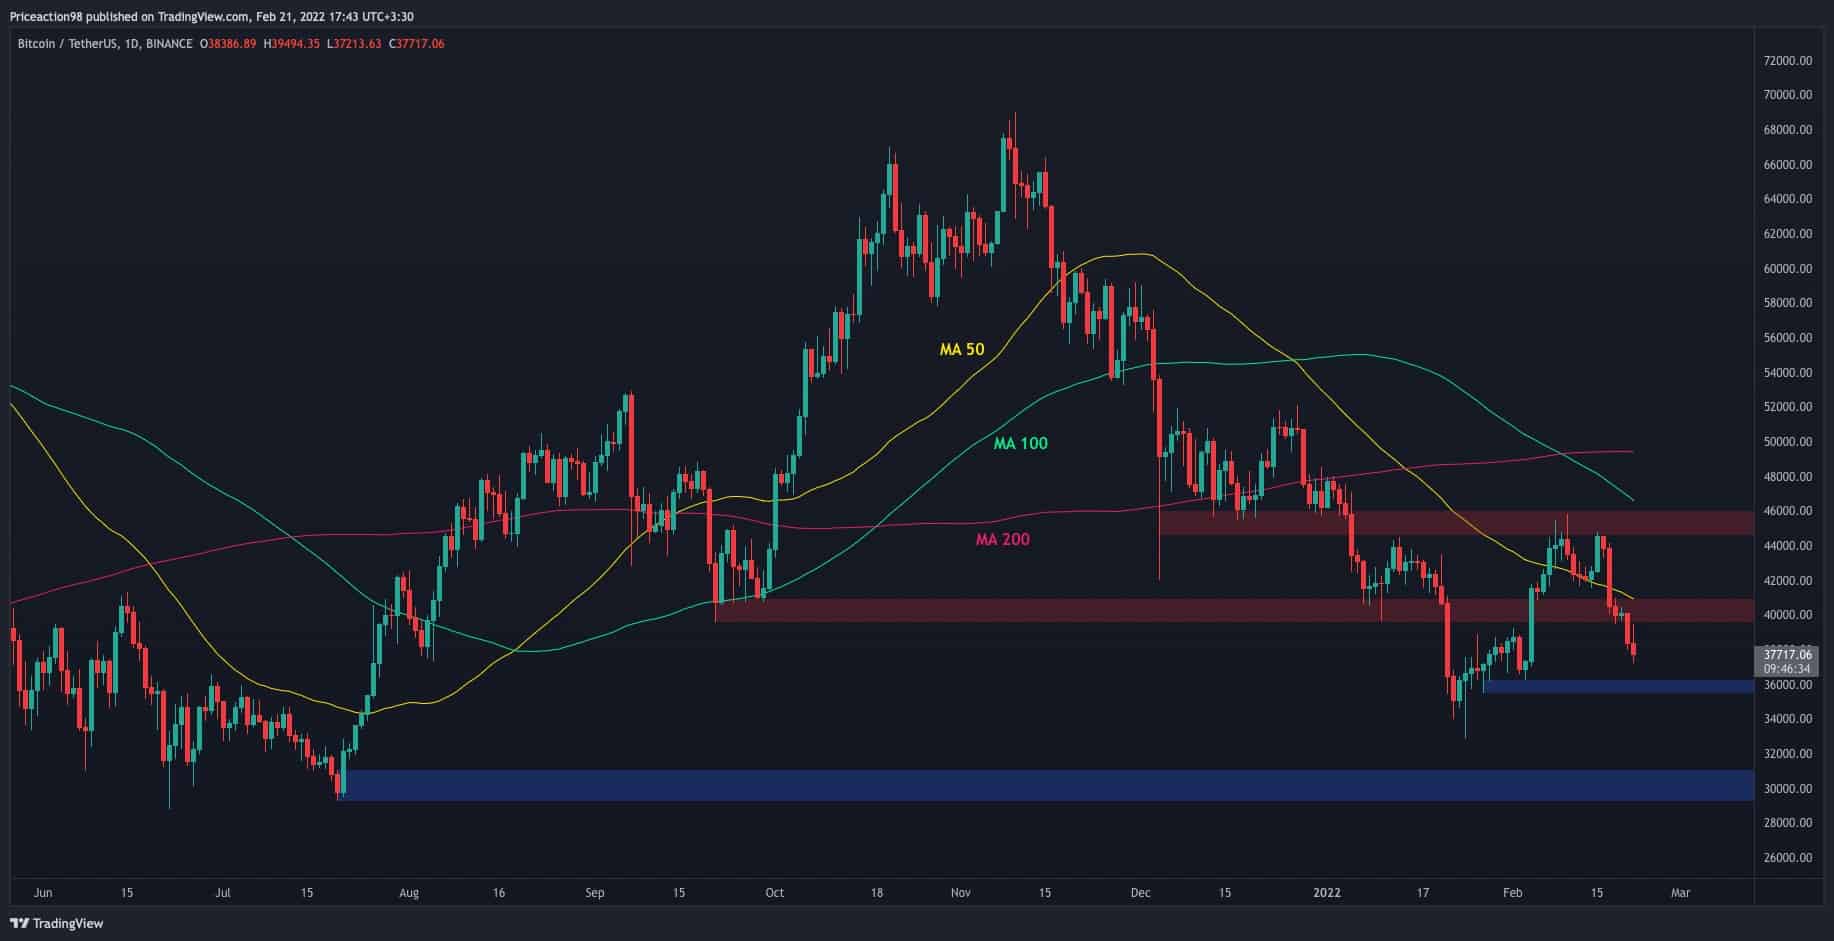
Bitcoin price has lost two significant supports in the last couple of days, and the hopes for a recovery turned into fear. BTC is currently trading below the $40k mark and the 50-day moving average, both key levels were broken in the recent upside move. The following critical level to watch would be the $36k area. Having enough demand, a reversal towards the $40k resistance and the 50-day moving average could be anticipated.

Short-Term
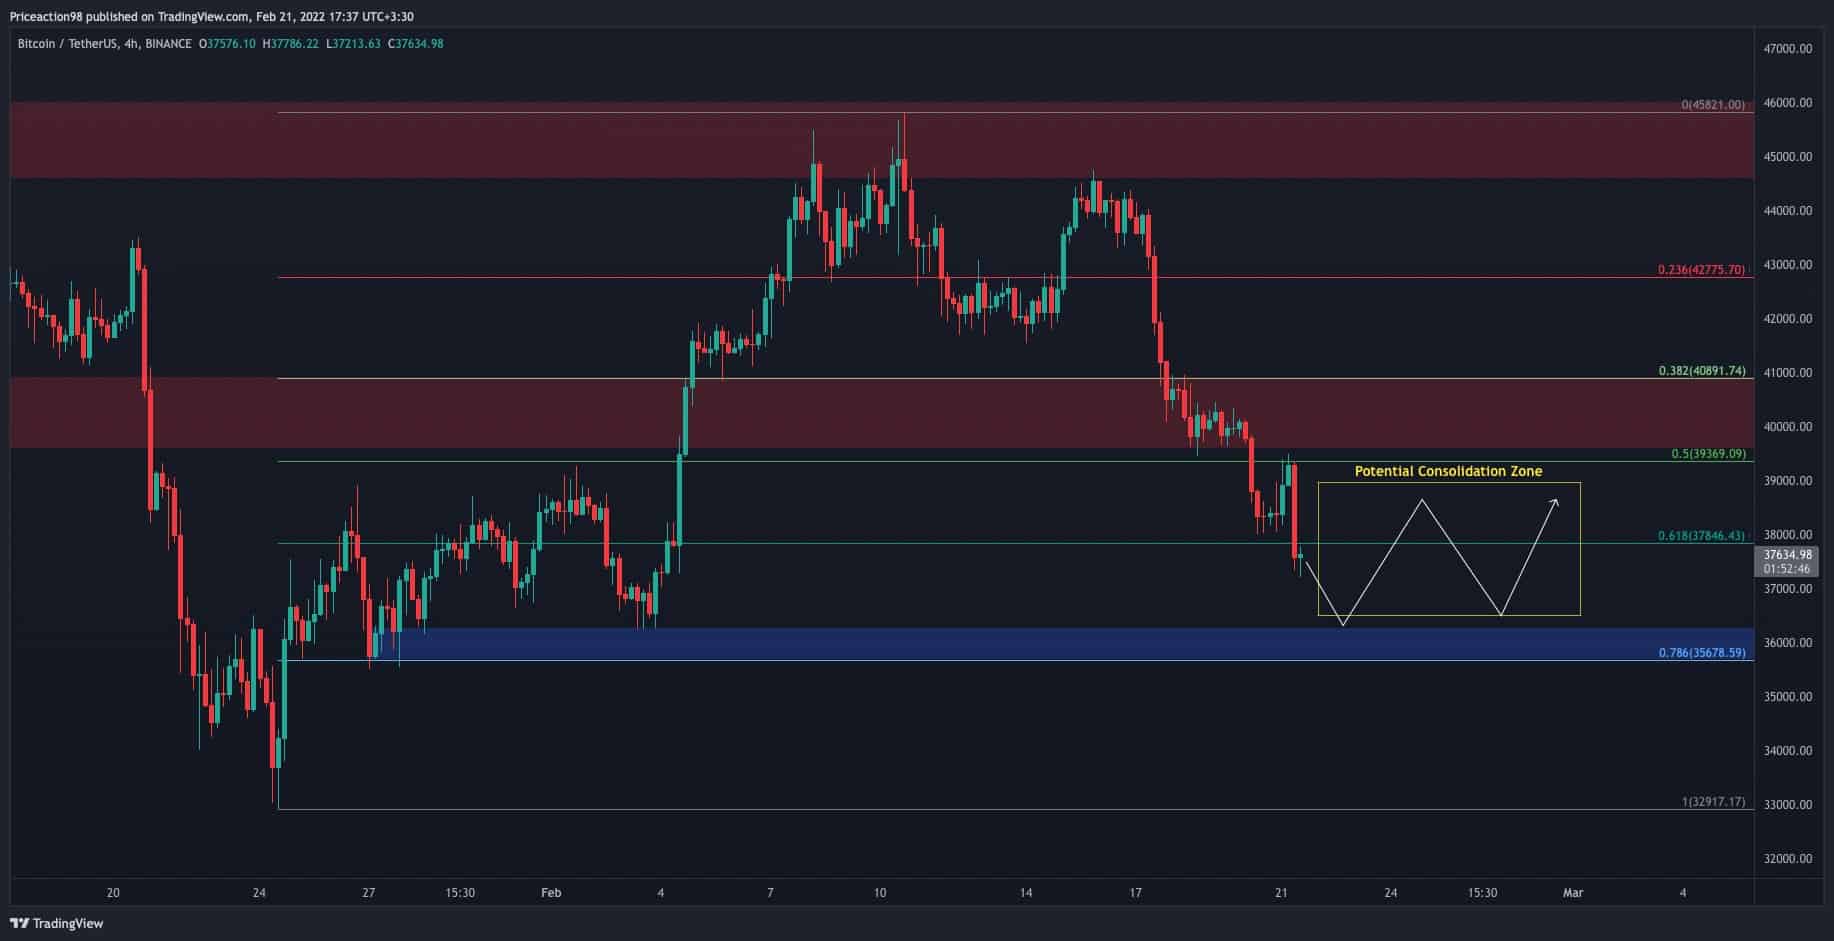
The bearish momentum seems overwhelming on the 4-hour time frame as the price has been breaking below supports with ease. However, it is currently trading in a key Fibonacci retracement zone (between 50% and 78.6%) which could potentially halt the drop in the short term. So, a consolidation phase is expected in the next couple of days where the bulls and bears collide between the $36k and $40k levels.

Onchain Analysis

By: Shayan
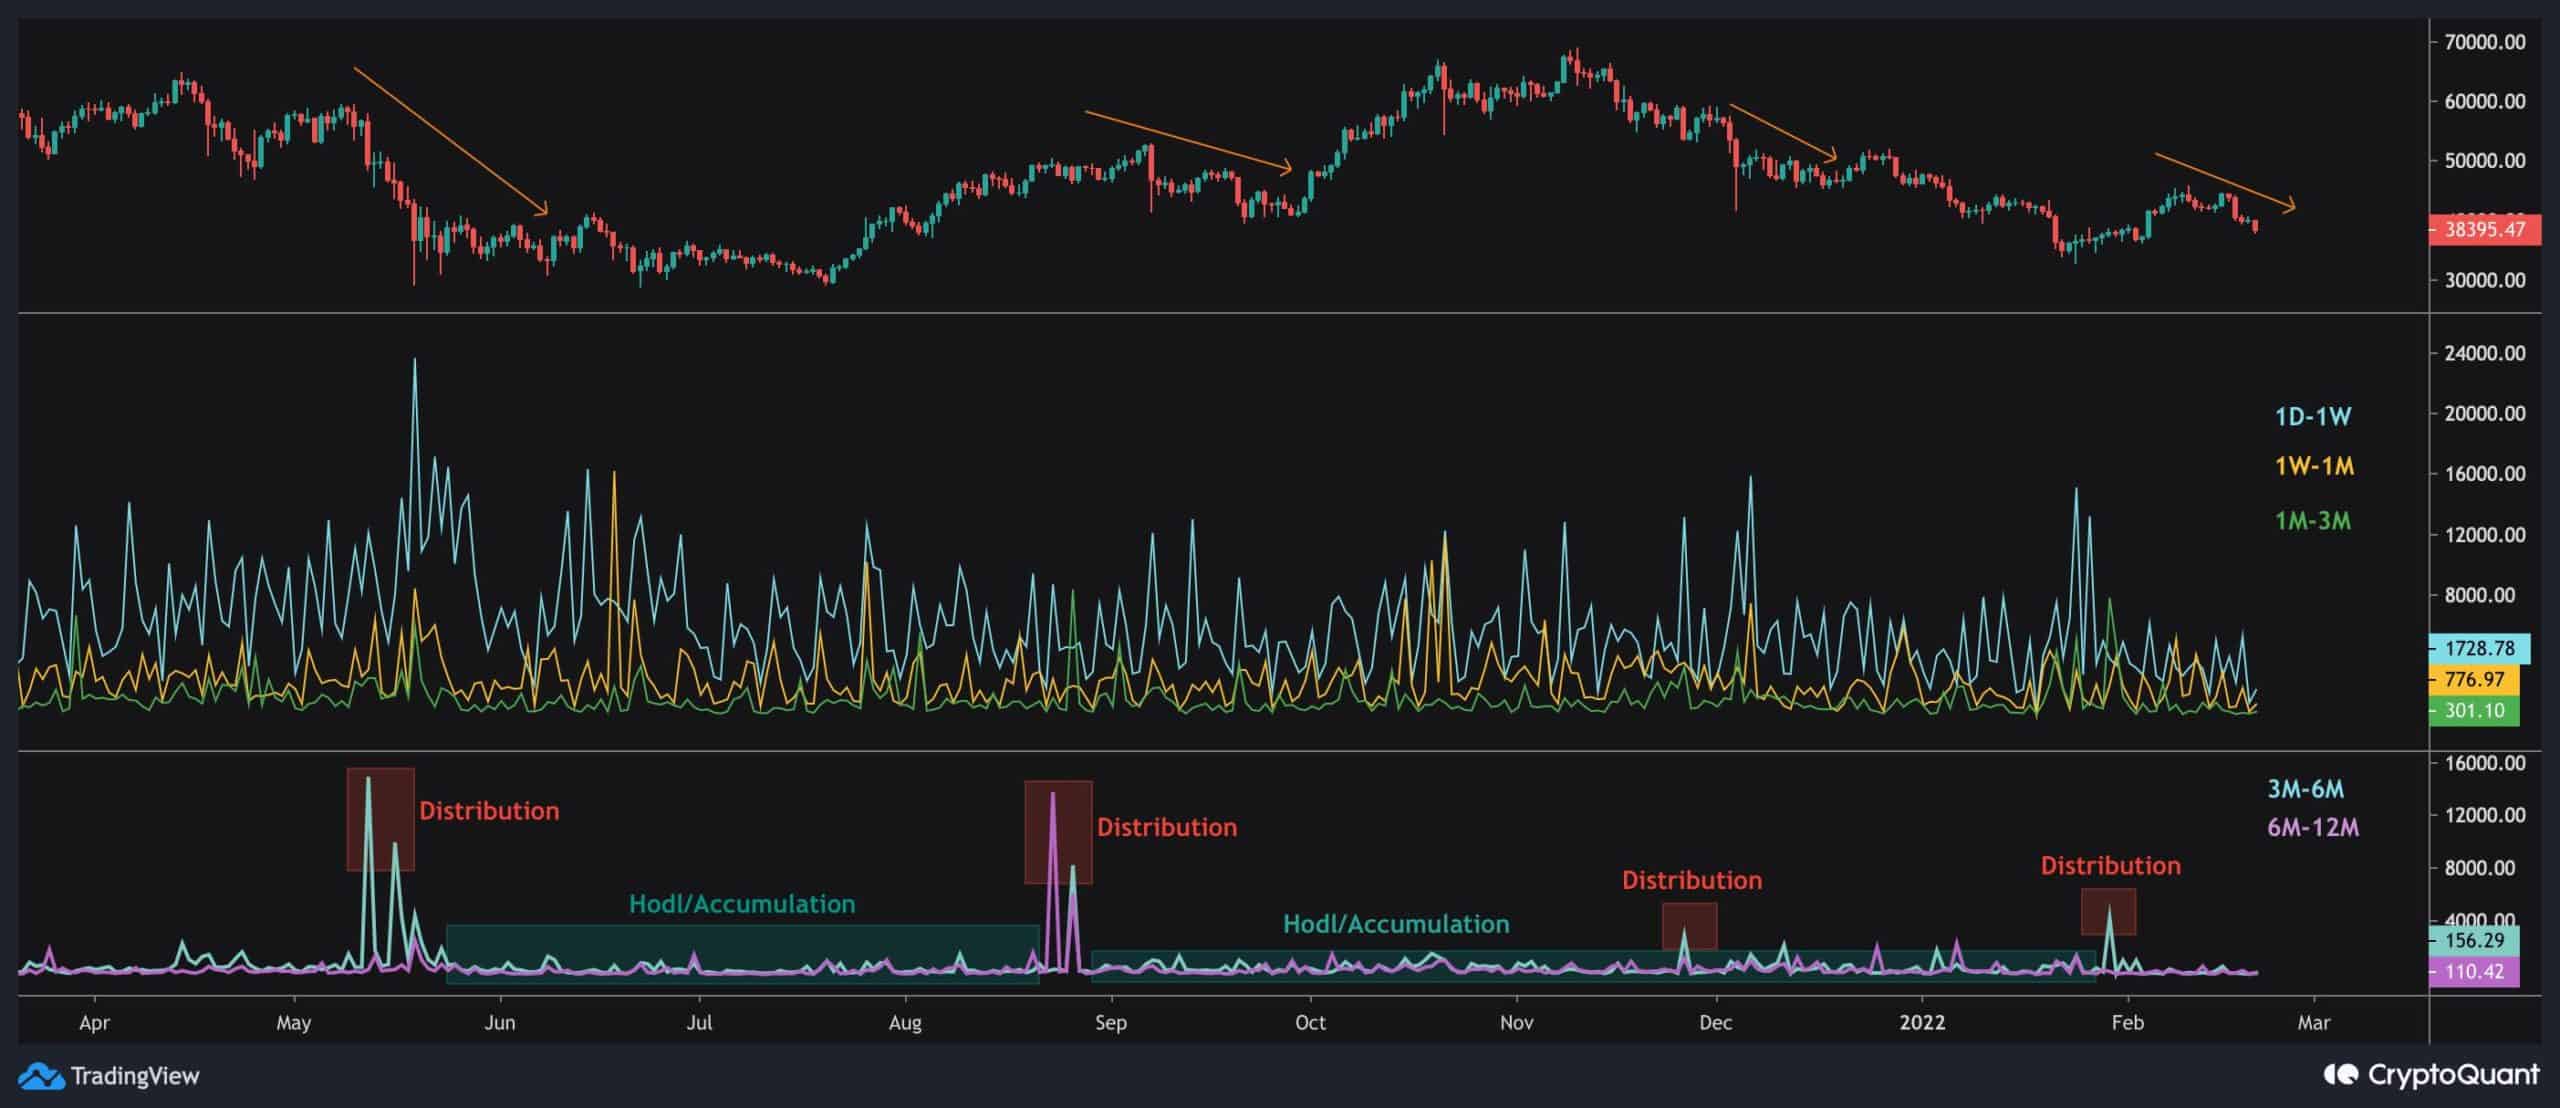
Here, the inflow to all exchanges is divided into various age bands illustrated in the graph. Interestingly, each time the inflow of 6M-12M old coins surged, the market has witnessed a shakeout. This structure can be interpreted as long/mid-term holders’ distribution through recoveries.
On the other hand, short-term investors have displayed a lot of panic selling during bearish periods. Investigating the short-term holders’ behavior (<3M), most inflows to the exchanges come from 1D-1M holders, also known as “retailers.” After breaking below the $39K, long-term holders’ selling pressure is diminishing and mostly shifting to accumulating.


