BTC Price Analysis: Following a 10% Weekly Surge, is Bitcoin Due For a Correction?
The sentiment in the cryptocurrency market has improved considerably during the previous week, as prices have increased and the $45K major supply zone has been broken. Bitcoin is presently trading at around $48K.
Technical Analysis
The Daily Chart:
Technical Analysis By Shayan
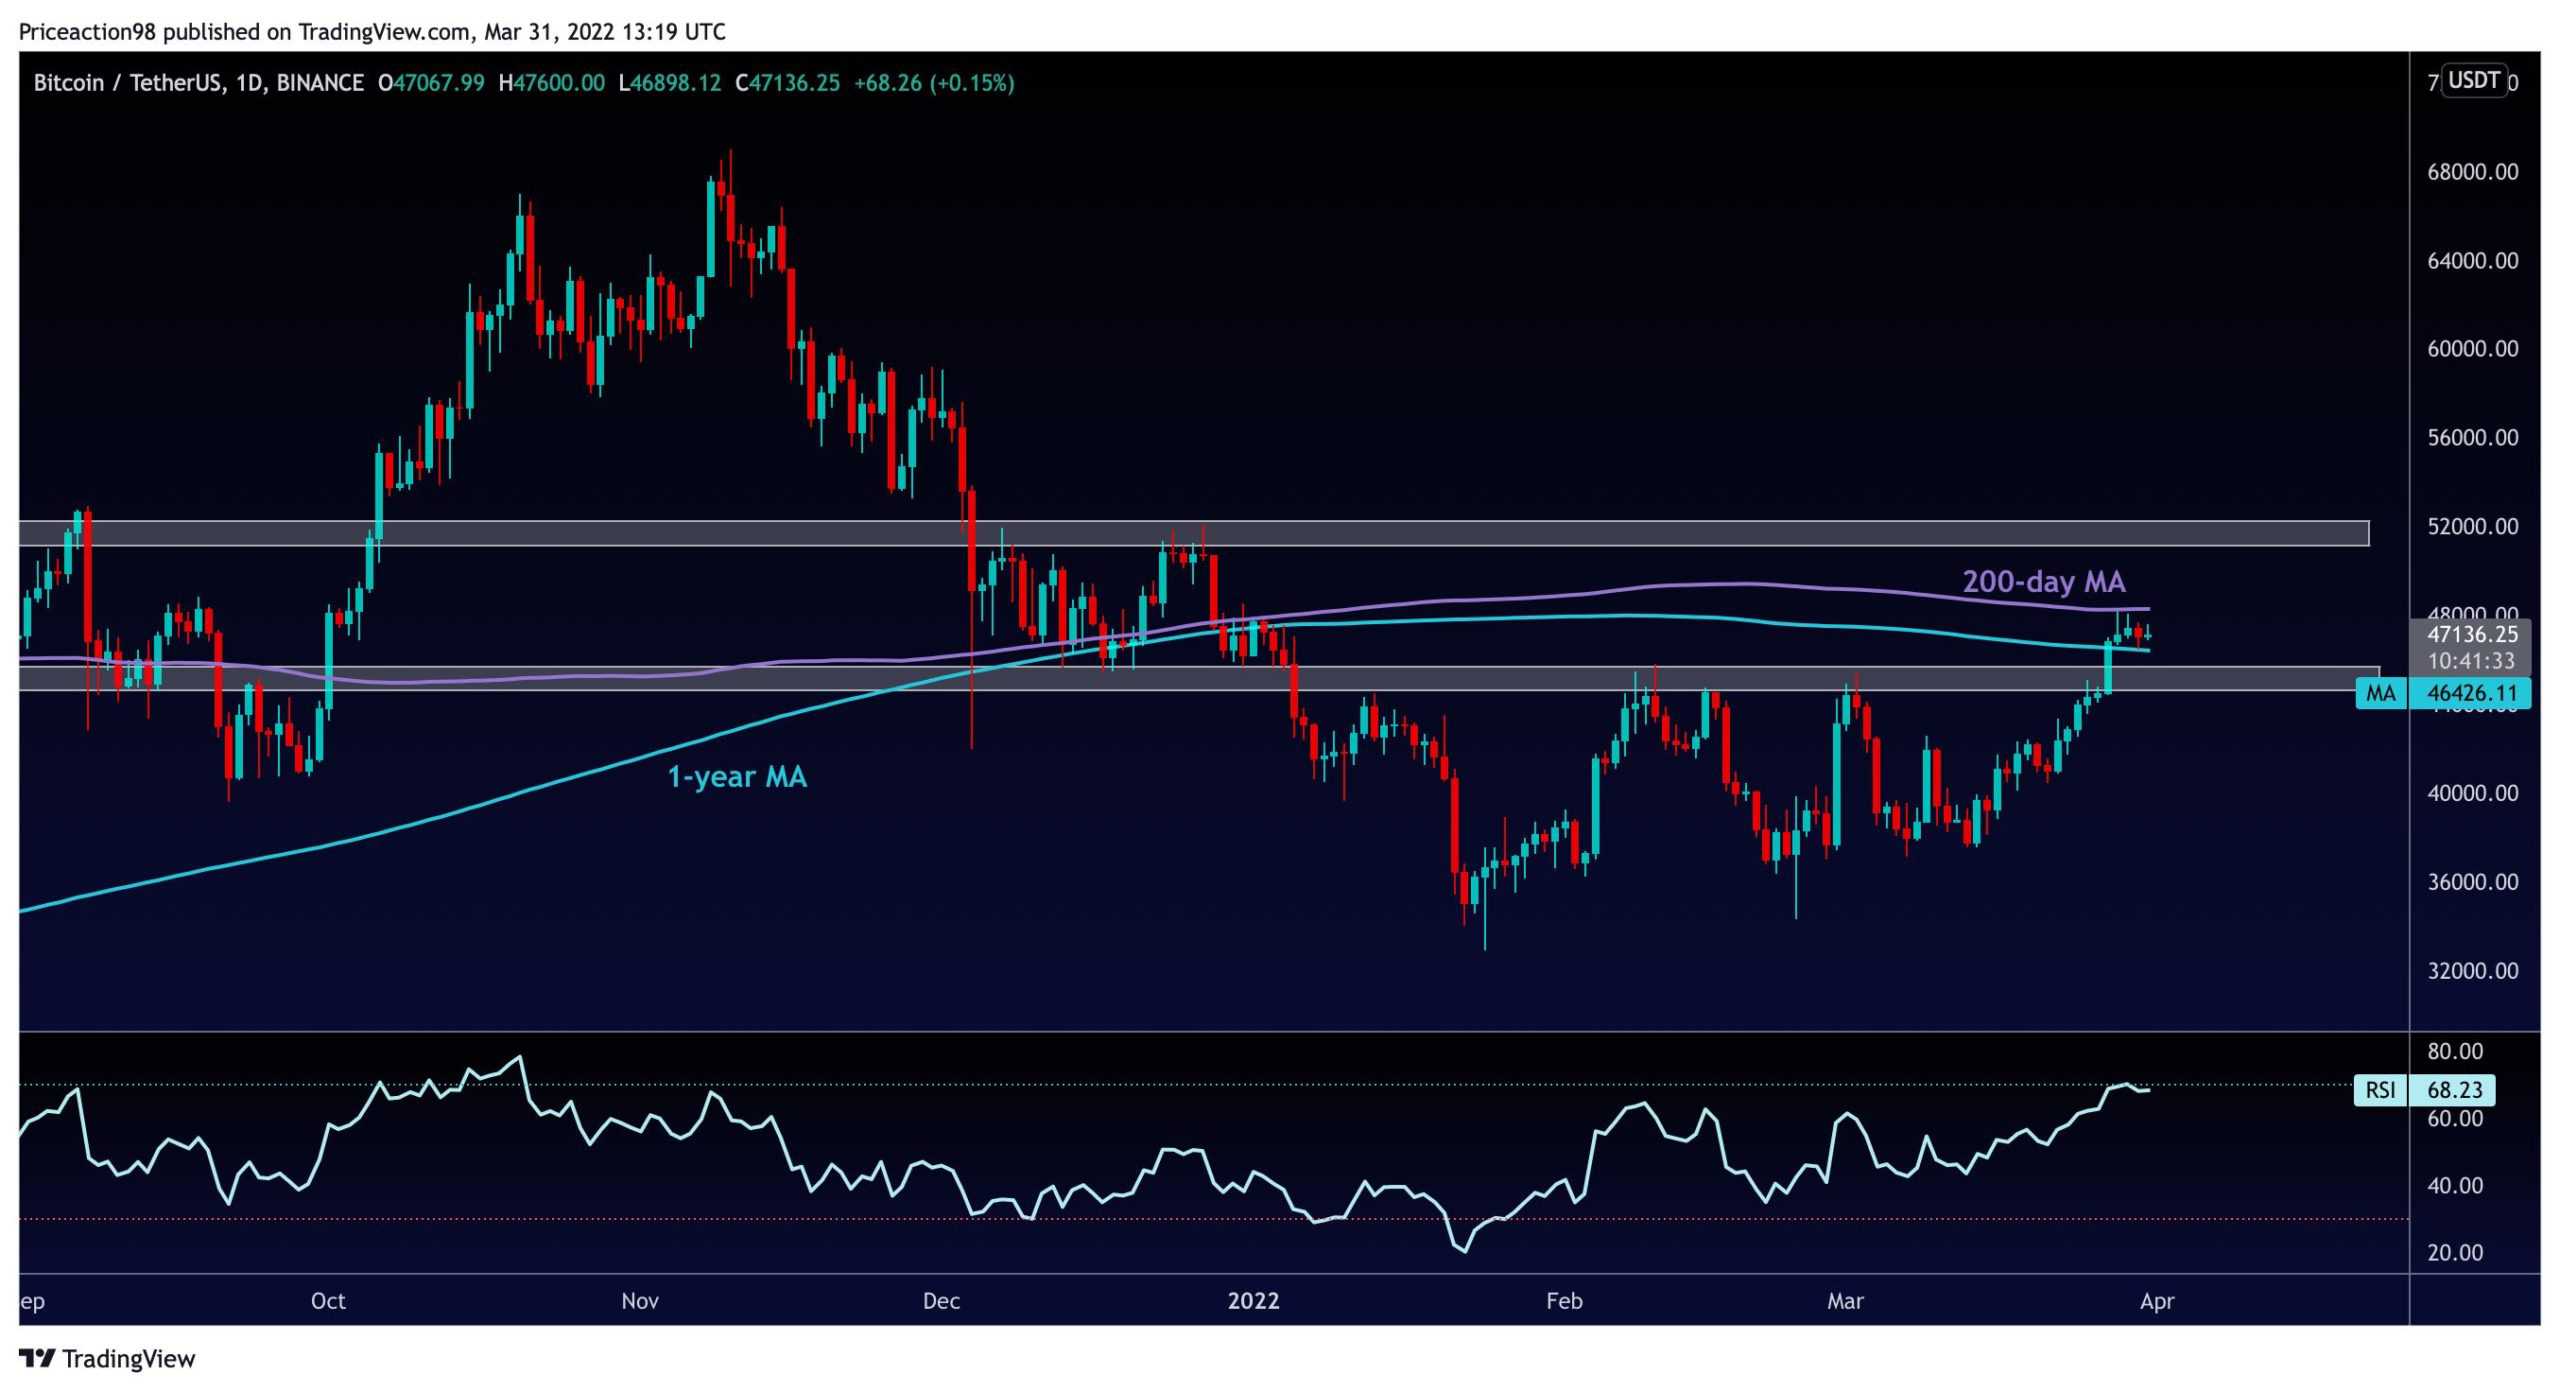
Since breaking above $45K early on March 28, Bitcoin has entered into a rally, and higher targets have come back into play.
It is important to note that the price has recently climbed above the 1-year moving average. Historically, this has been a critical milestone for BTC, and a breakthrough above it might signal the start of a bullish surge. Currently, the 200-day moving average has been the main barrier for the cryptocurrency to explore higher targets, and the bulls are attempting to break above it.
The RSI, on the other hand, has reached the overbought zone, which increases the probability of an upcoming correction for Bitcoin’s price.

The 4-Hour Chart:
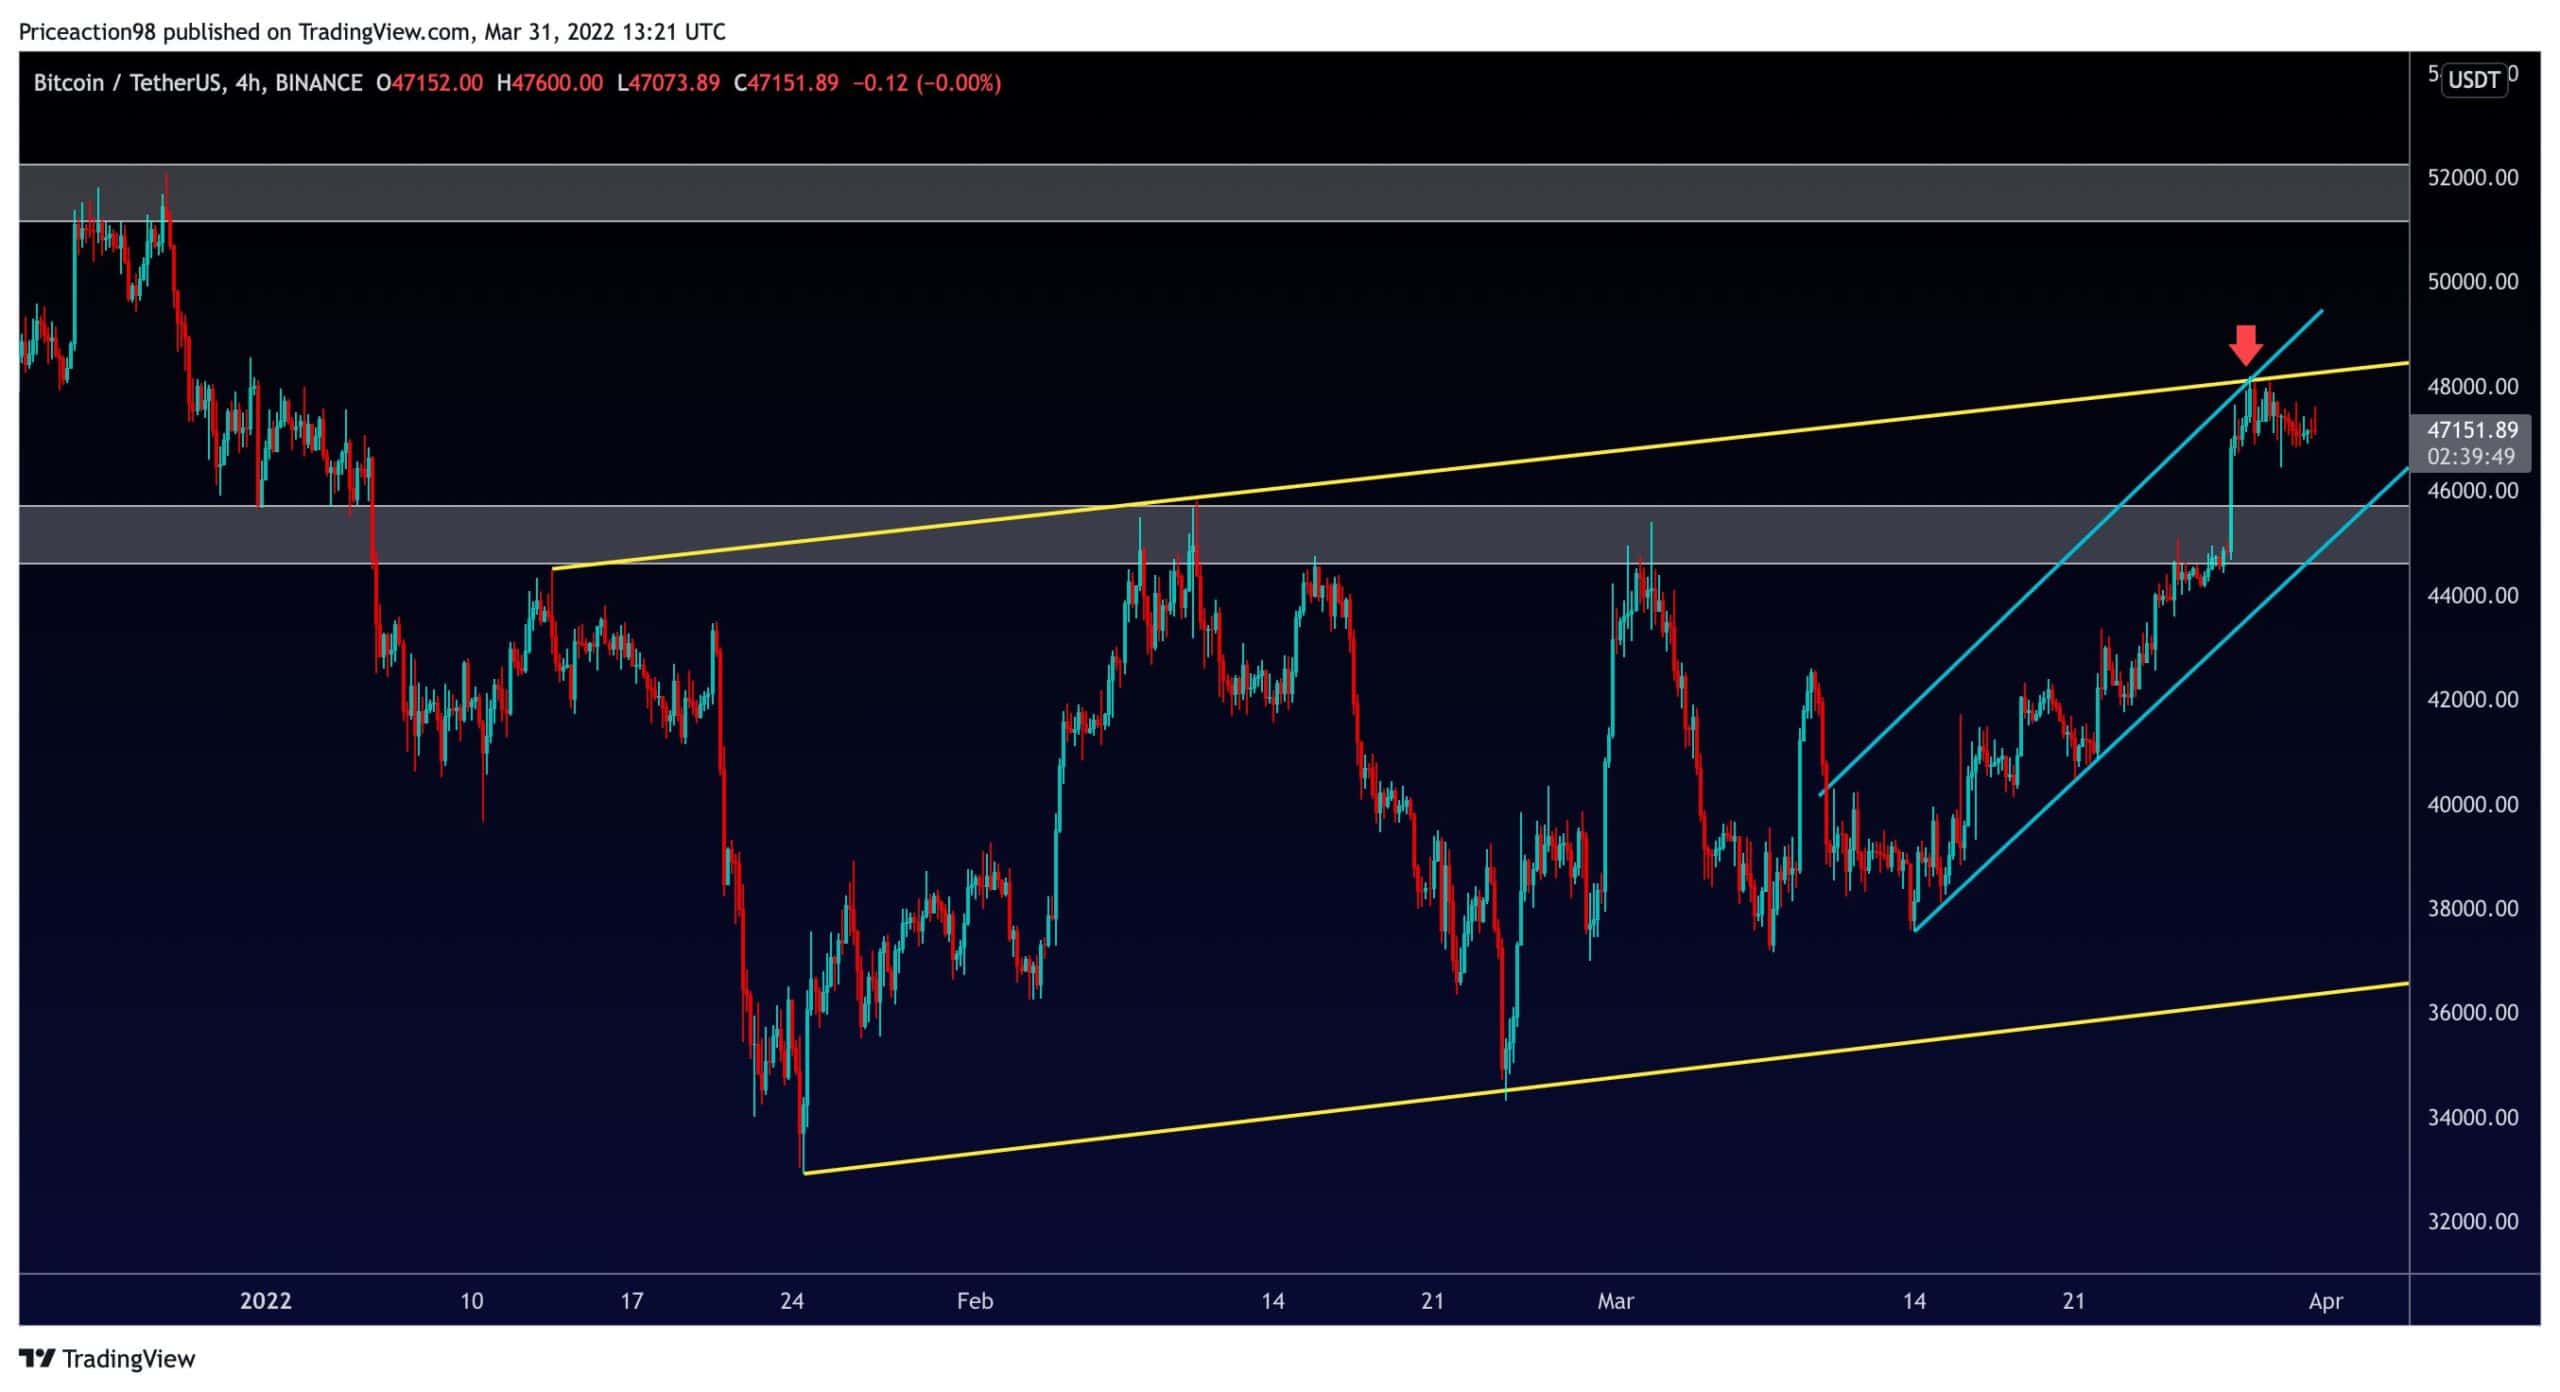
The price has been making higher highs and higher lows within a short-term ascending channel (Blue trendlines), which is a strong indication of a solid bullish rebound based on price action patterns. However, BTC has been rejected from the upper trendline and started a short-term correction. On the other hand, Bitcoin has been forming a continuation correction flag (Yellow trendlines) in higher timeframes and has now reached the upper trendline.
Corrections are essential for a healthy rally, and the price can experience a drawdown to lower support levels around $45K to verify the breakout and continue upwards. The next significant resistance is found in the $52K region, and if the channel’s upper trendline is broken, the mentioned will be unavoidable.

Sentiment Analysis
Bitcoin Open Interest
Sentiment Analysis By Edris
Open interest is a critical metric in evaluating the futures market sentiment as it shows the number of available futures positions at any given time. The open interest in all exchanges has risen rapidly in the past few days as the price has rallied to the $48K area, and it is reaching the values of $64K and $69K all-time highs.
This sharp growth indicates that the speculators are back in the market as the price has broken out of a multi-month consolidation. Traders feel more confident to take risks and use leverage to multiply their gains. However, the futures market getting overheated is a significant alarm signal because it means high volatility soon due to probable liquidation cascades.


