BTC Price Analysis: Bitcoin’s Consolidation About to End as Major Move Seems Imminent
Bitcoin’s price rally has come to a halt over the last couple of months as the market consolidates. Yet, things are about to change soon, either for the better or for the worse.
Technical Analysis
By TradingRage
The Daily Chart
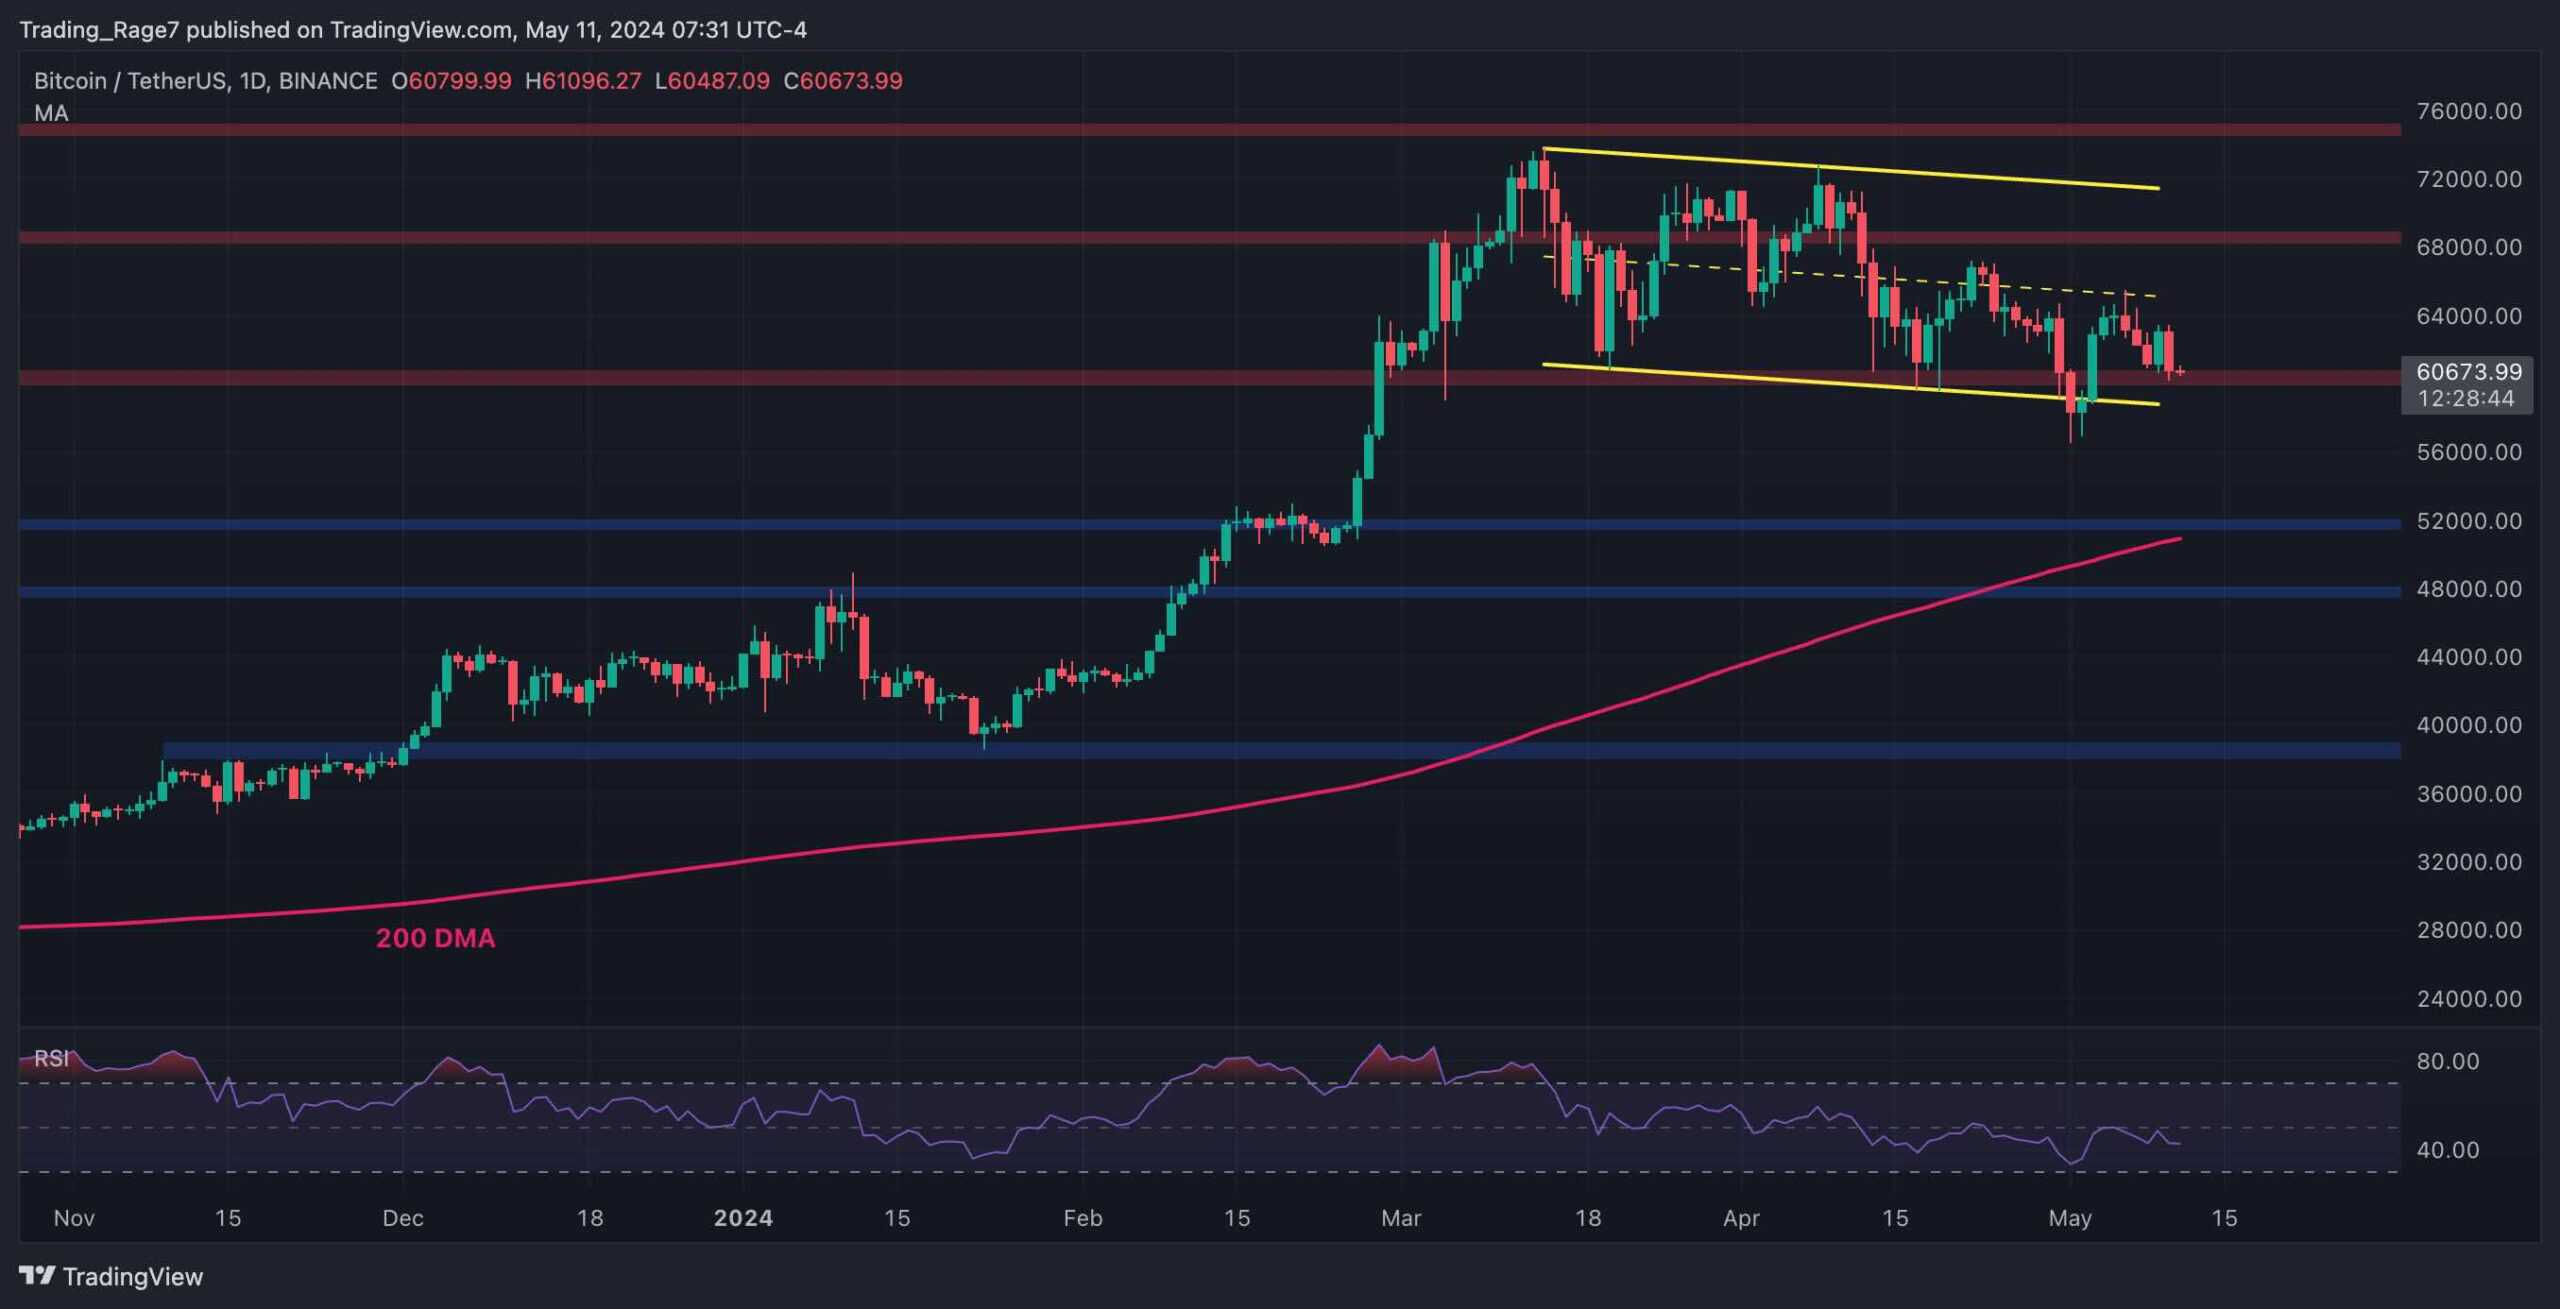
On the daily chart, it is evident that the Bitcoin price has been consolidating inside a large descending channel. The midline of the channel has recently rejected the price to the downside, and the market is testing the $60K level once again.
If this level breaks, there is a high probability for the channel also to break down, and the price will be more likely to experience a massive drop toward the $52K support zone.

The 4-Hour Chart
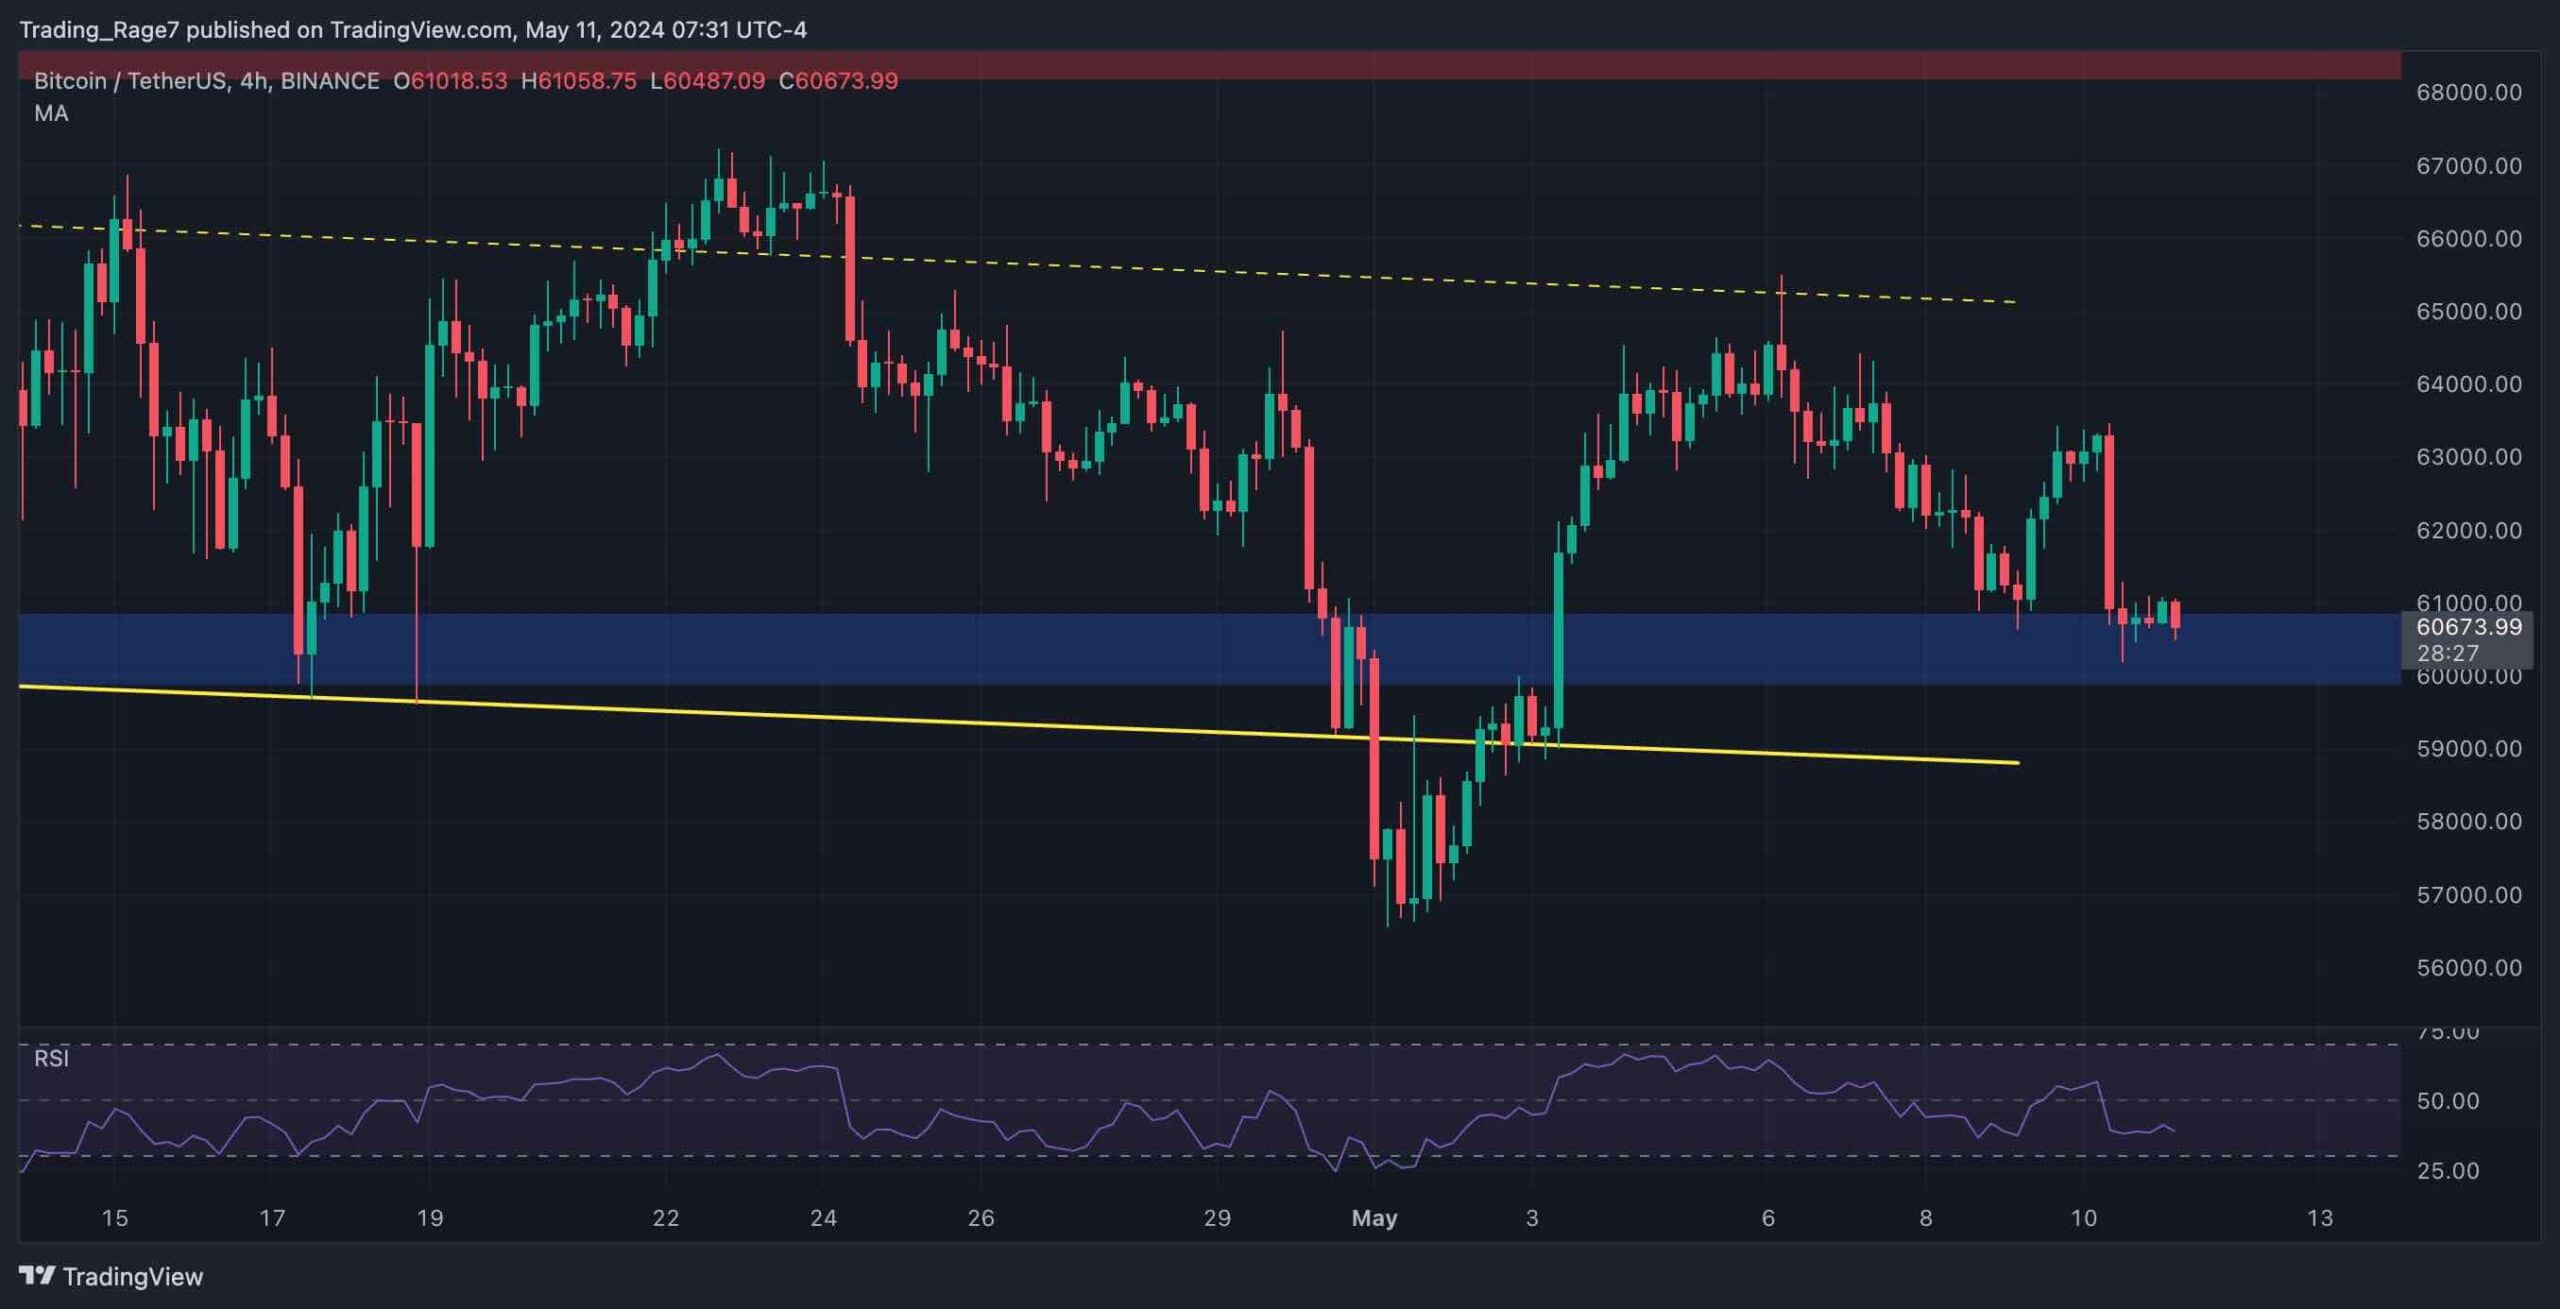
Looking at the 4-hour chart, things seem much clearer. The price has recently tested the midline of the channel but has been rejected decisively. Yet today’s action gives us the most significant clue, as the price has been dropping aggressively.
The RSI also shows values below 50%, as momentum is in favor of the sellers. Therefore, things can get ugly if the $60K level breaks to the downside.

On-Chain Analysis
By TradingRage
Bitcoin Exchange Reserve
As Bitcoin’s price struggles to continue its uptrend and record a new high, the bears have been taking advantage and are now seemingly staging a further decline.
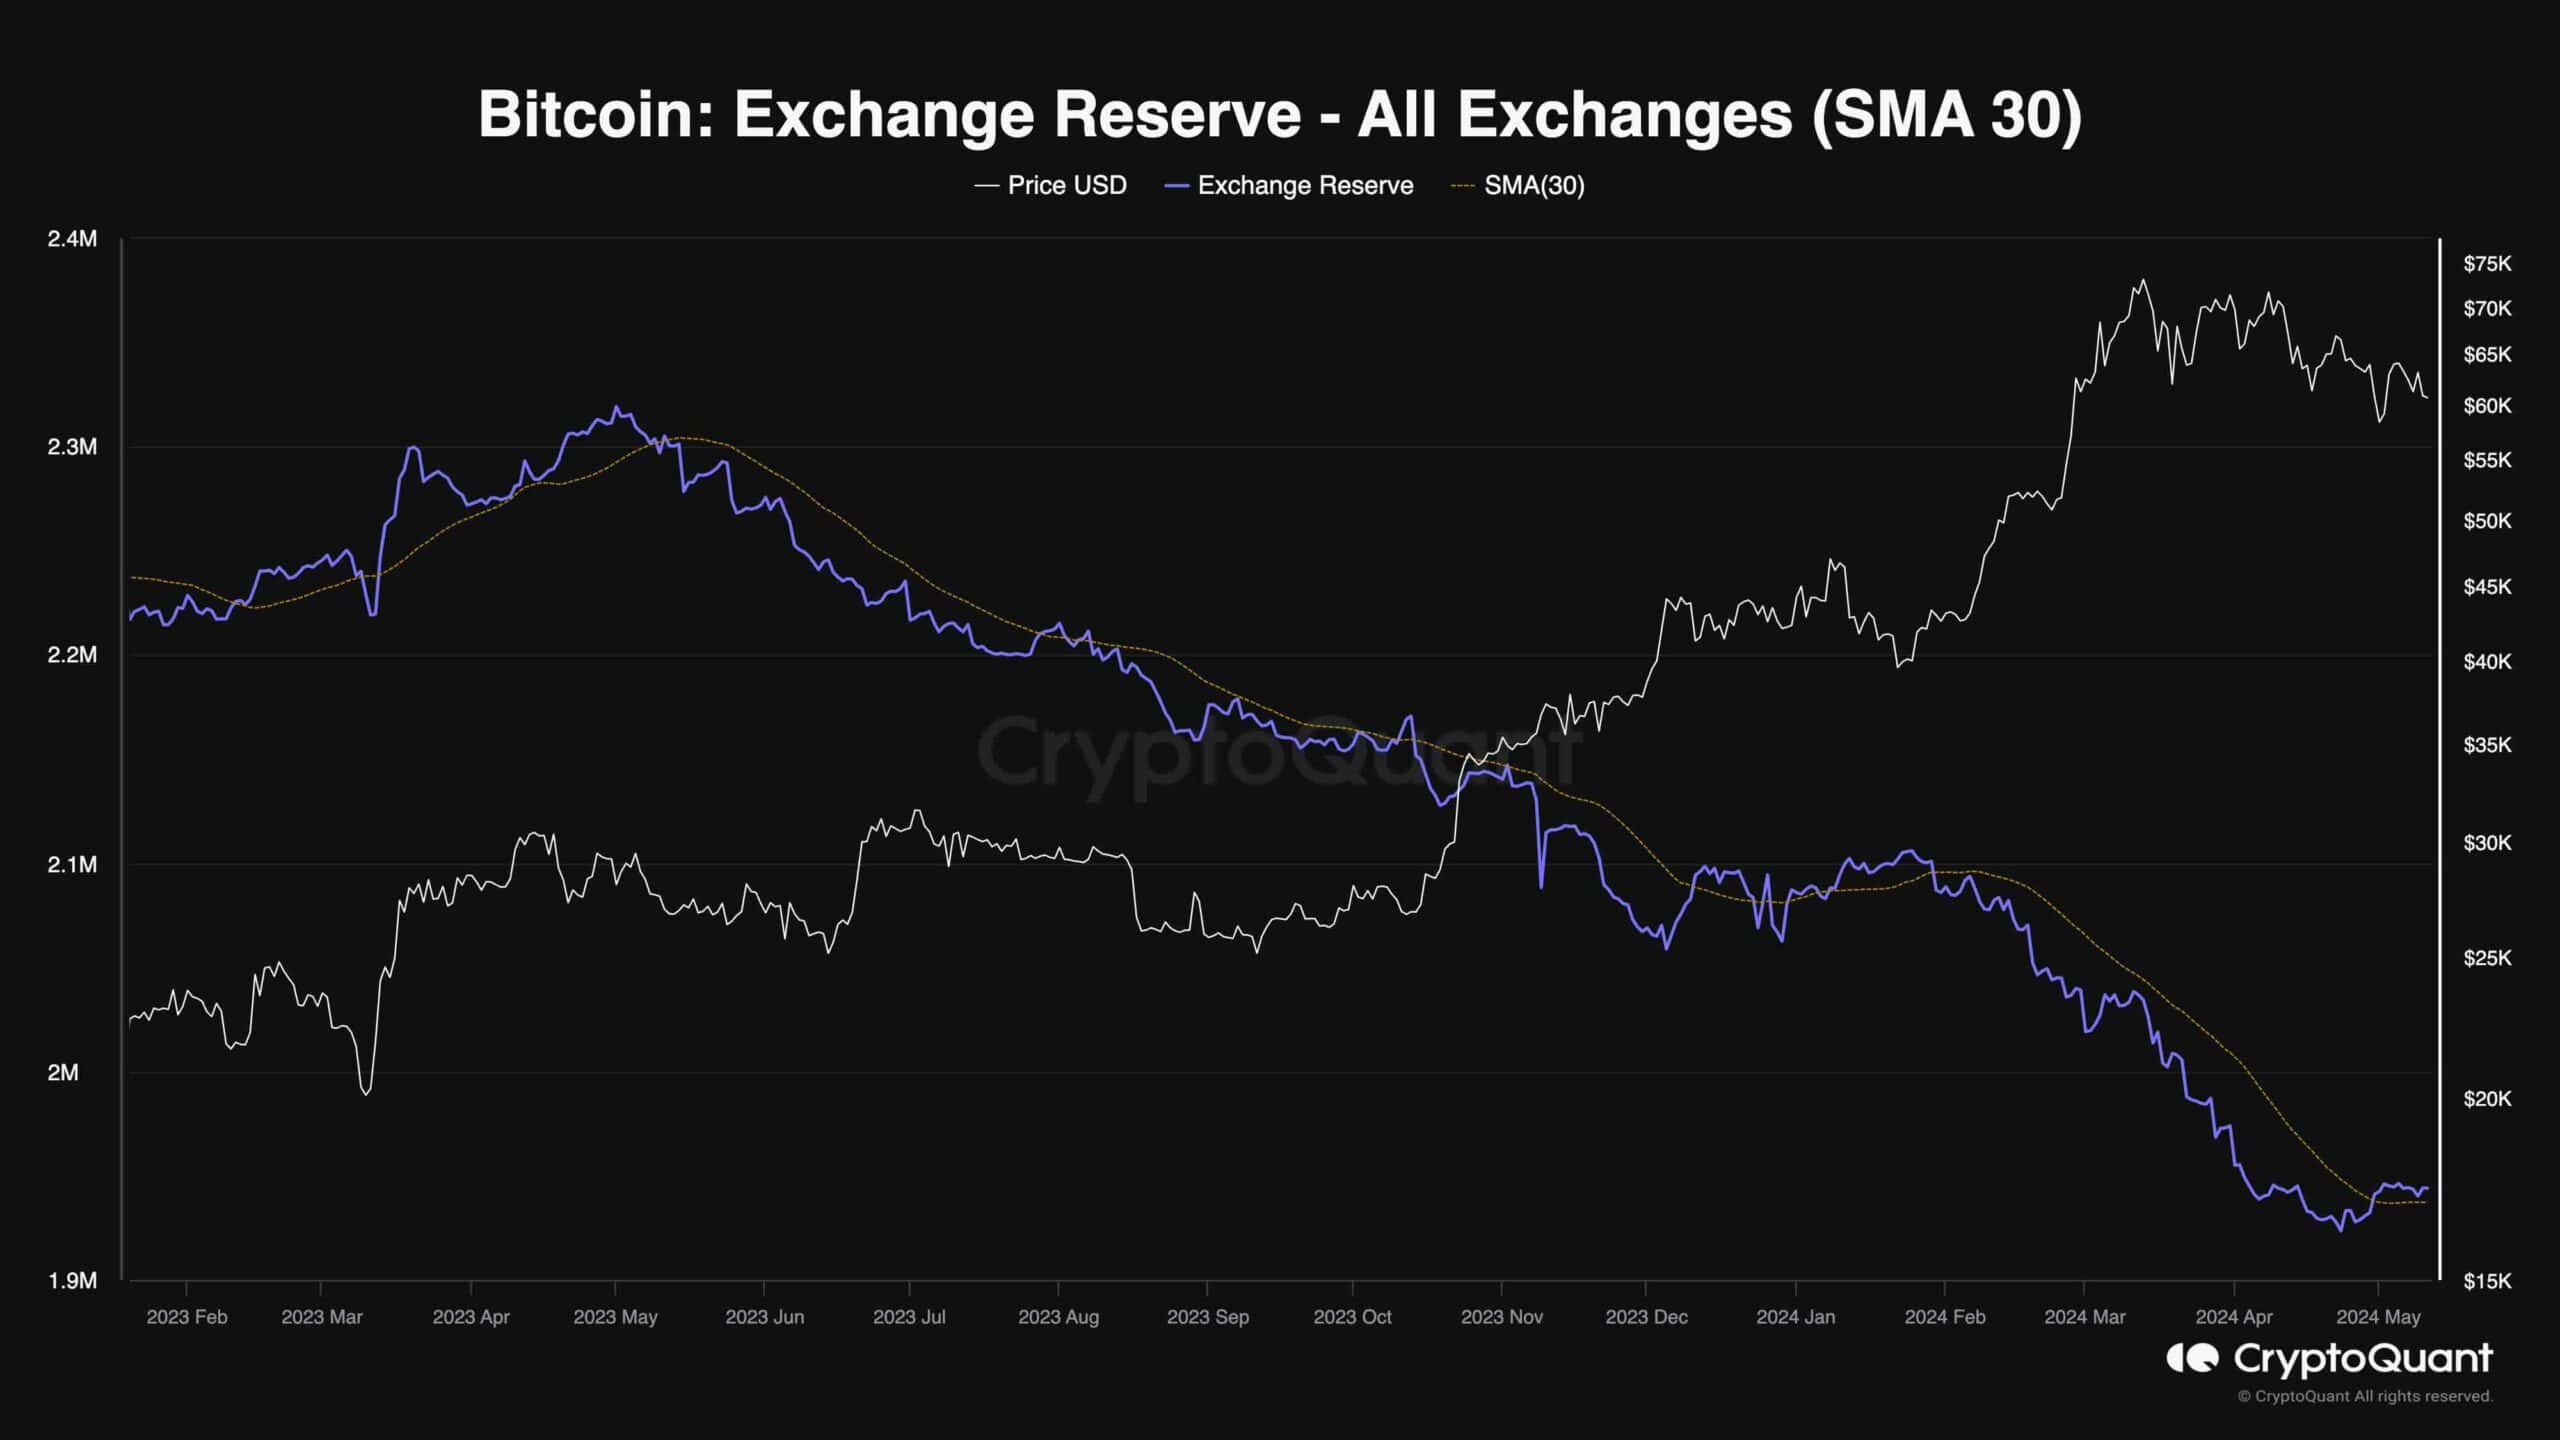
This chart demonstrates the exchange reserve metric and its 30-day standard moving average. Rising values are usually considered bearish, as they mean that investors are depositing their coins to exchanges to sell them.
As the chart depicts, the exchange reserve metric has been rising, and it has climbed above its 30-day moving average. This supply from the spot market is one of the contributing factors to the recent correction.

The post BTC Price Analysis: Bitcoin’s Consolidation About to End as Major Move Seems Imminent appeared first on CryptoPotato.


