BTC Price Analysis: Bitcoin Trading Flat but is a Drop Below $18K Imminent?
Bitcoin continues to consolidate around the $19K support level as the bulls attempt to prevent a deeper crash. If unsuccessful, this could prolong the ongoing bear market and apply even more pressure on participants.
Technical Analysis
By: Edris
The Daily Chart
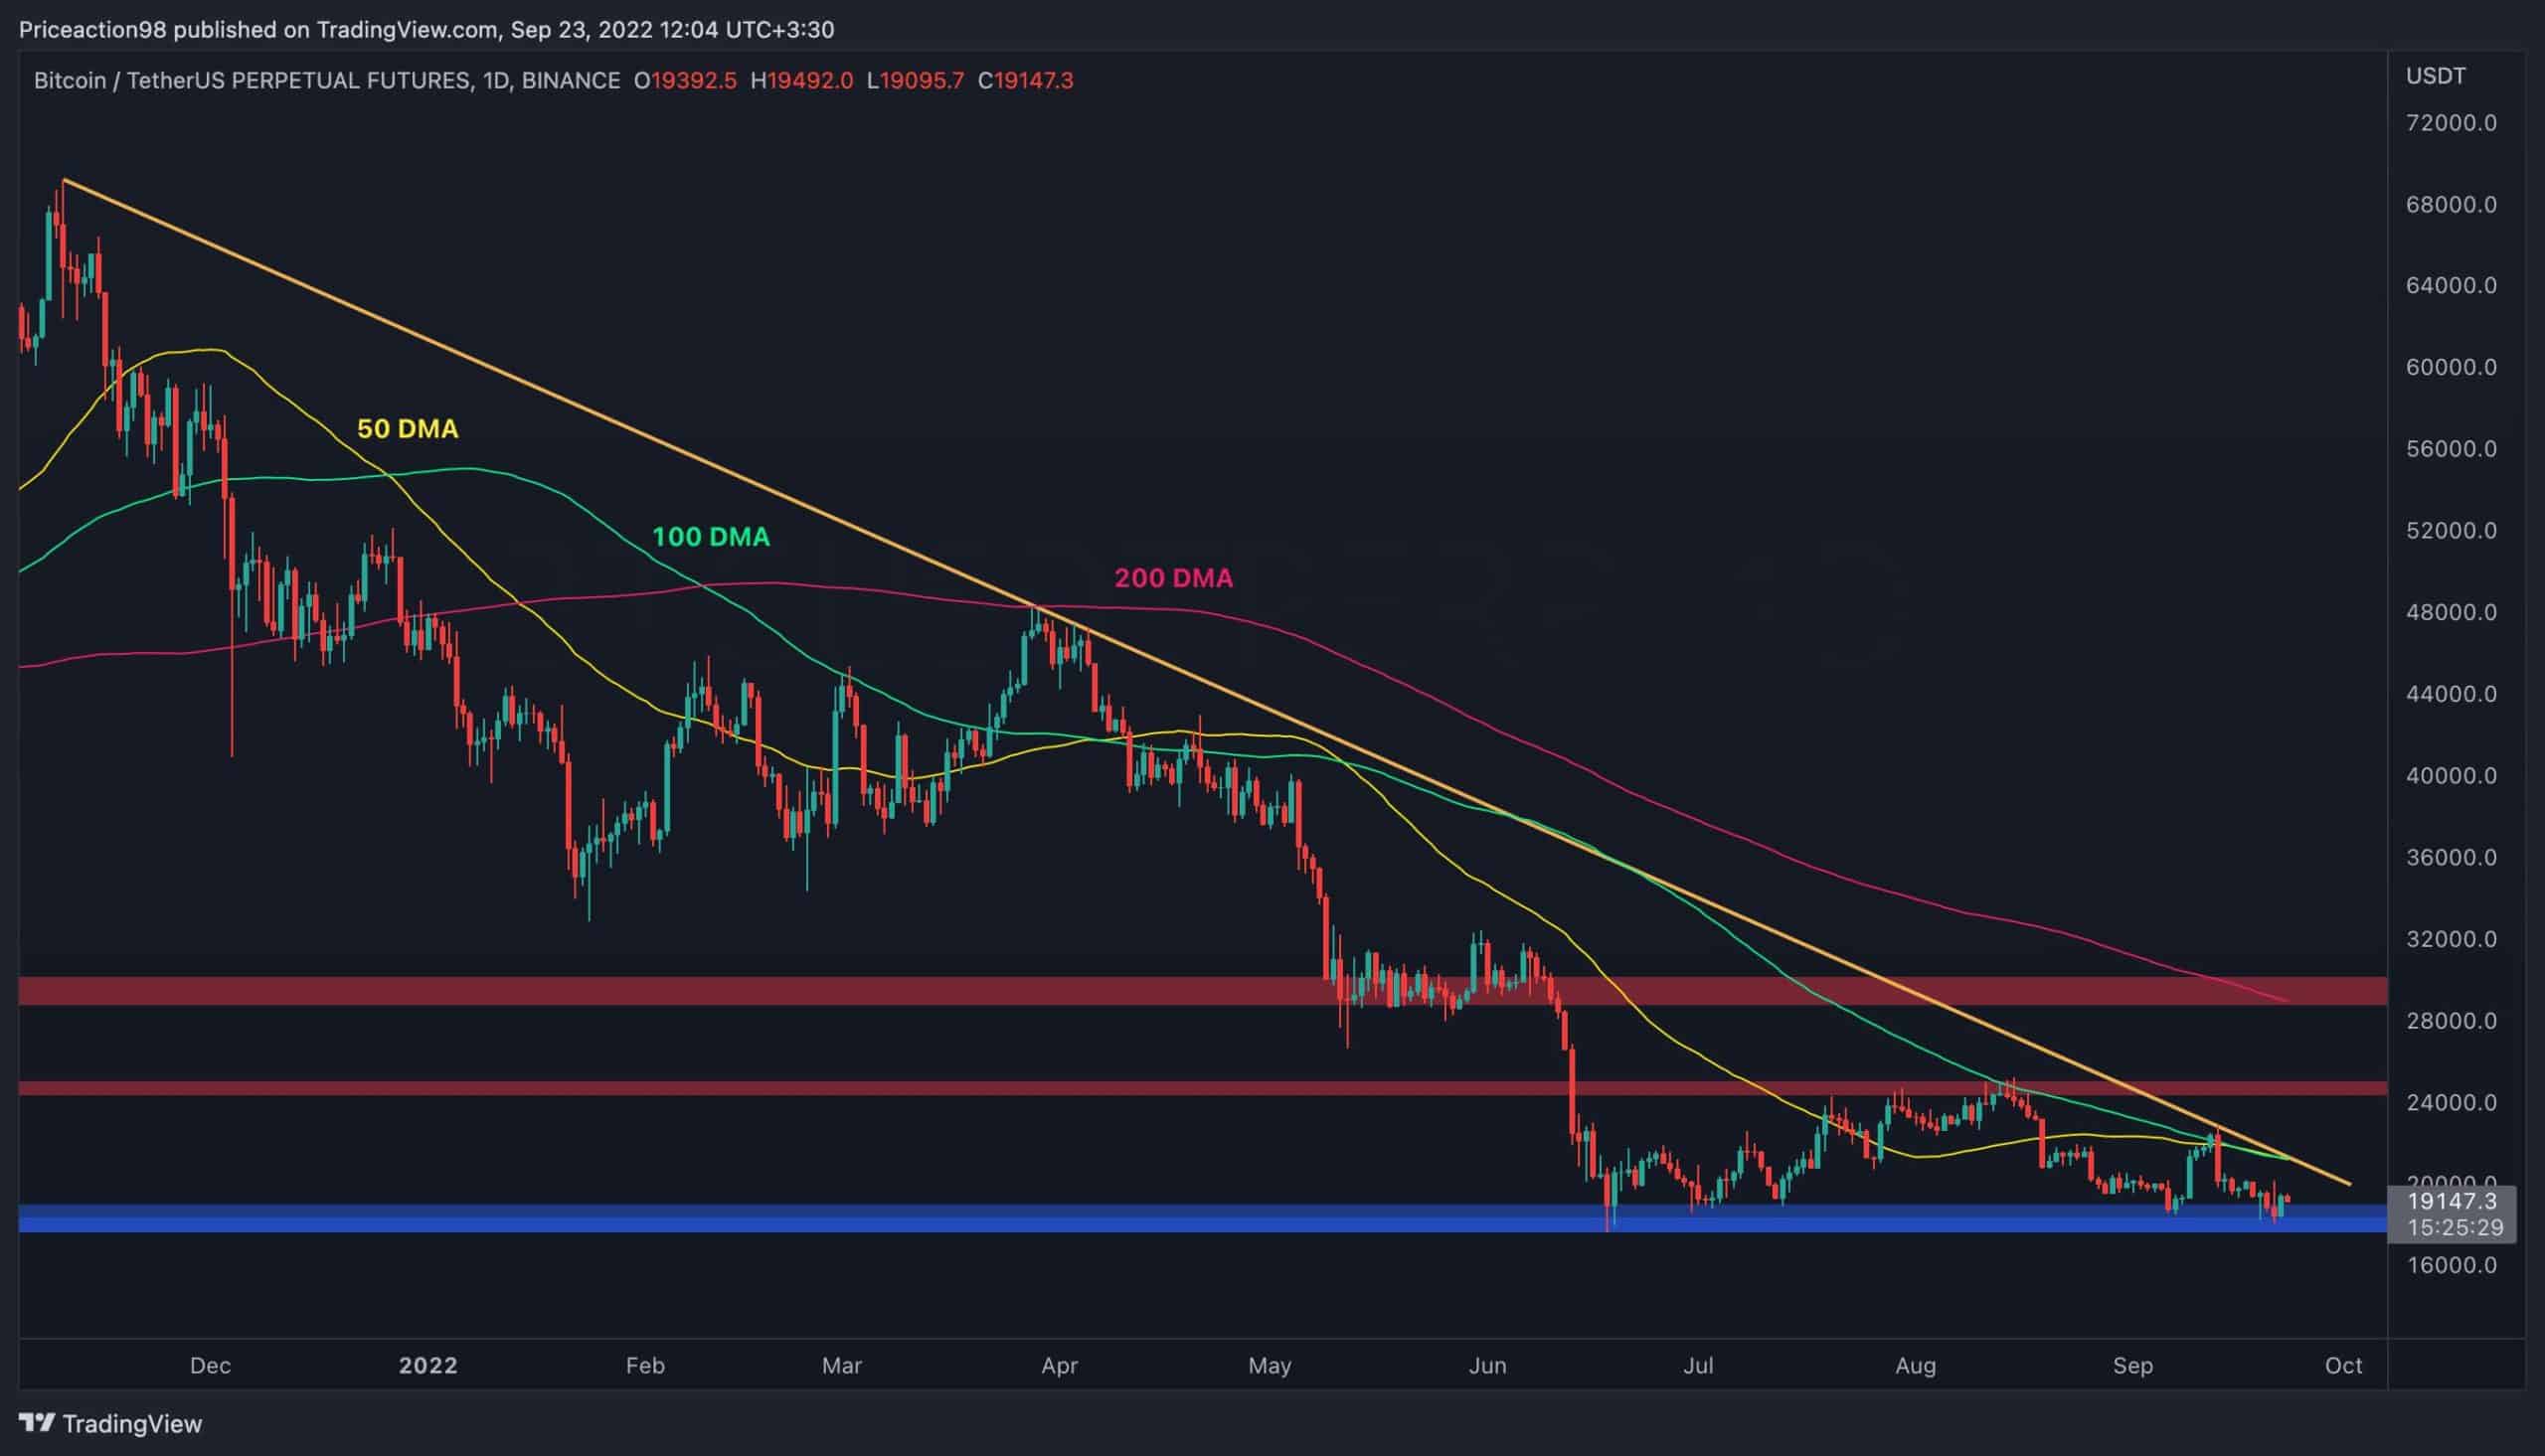
On the daily timeframe, the price has been retesting the $18K support level following rejection from the major bearish trendline. The 50-day and 100-day moving average lines have also rejected the cryptocurrency.
If BTC rebounds from the current support zone, the above-mentioned moving averages and the bearish trendline would be major dynamic resistance levels before the $24K area, which is a significant static resistance point.
The price should break above all of these in order to reverse the ongoing negative trend. On the other hand, if the $18K level gets broken to the downside, a rapid crash towards $15K and beyond becomes more possible.
The 4-Hour Chart
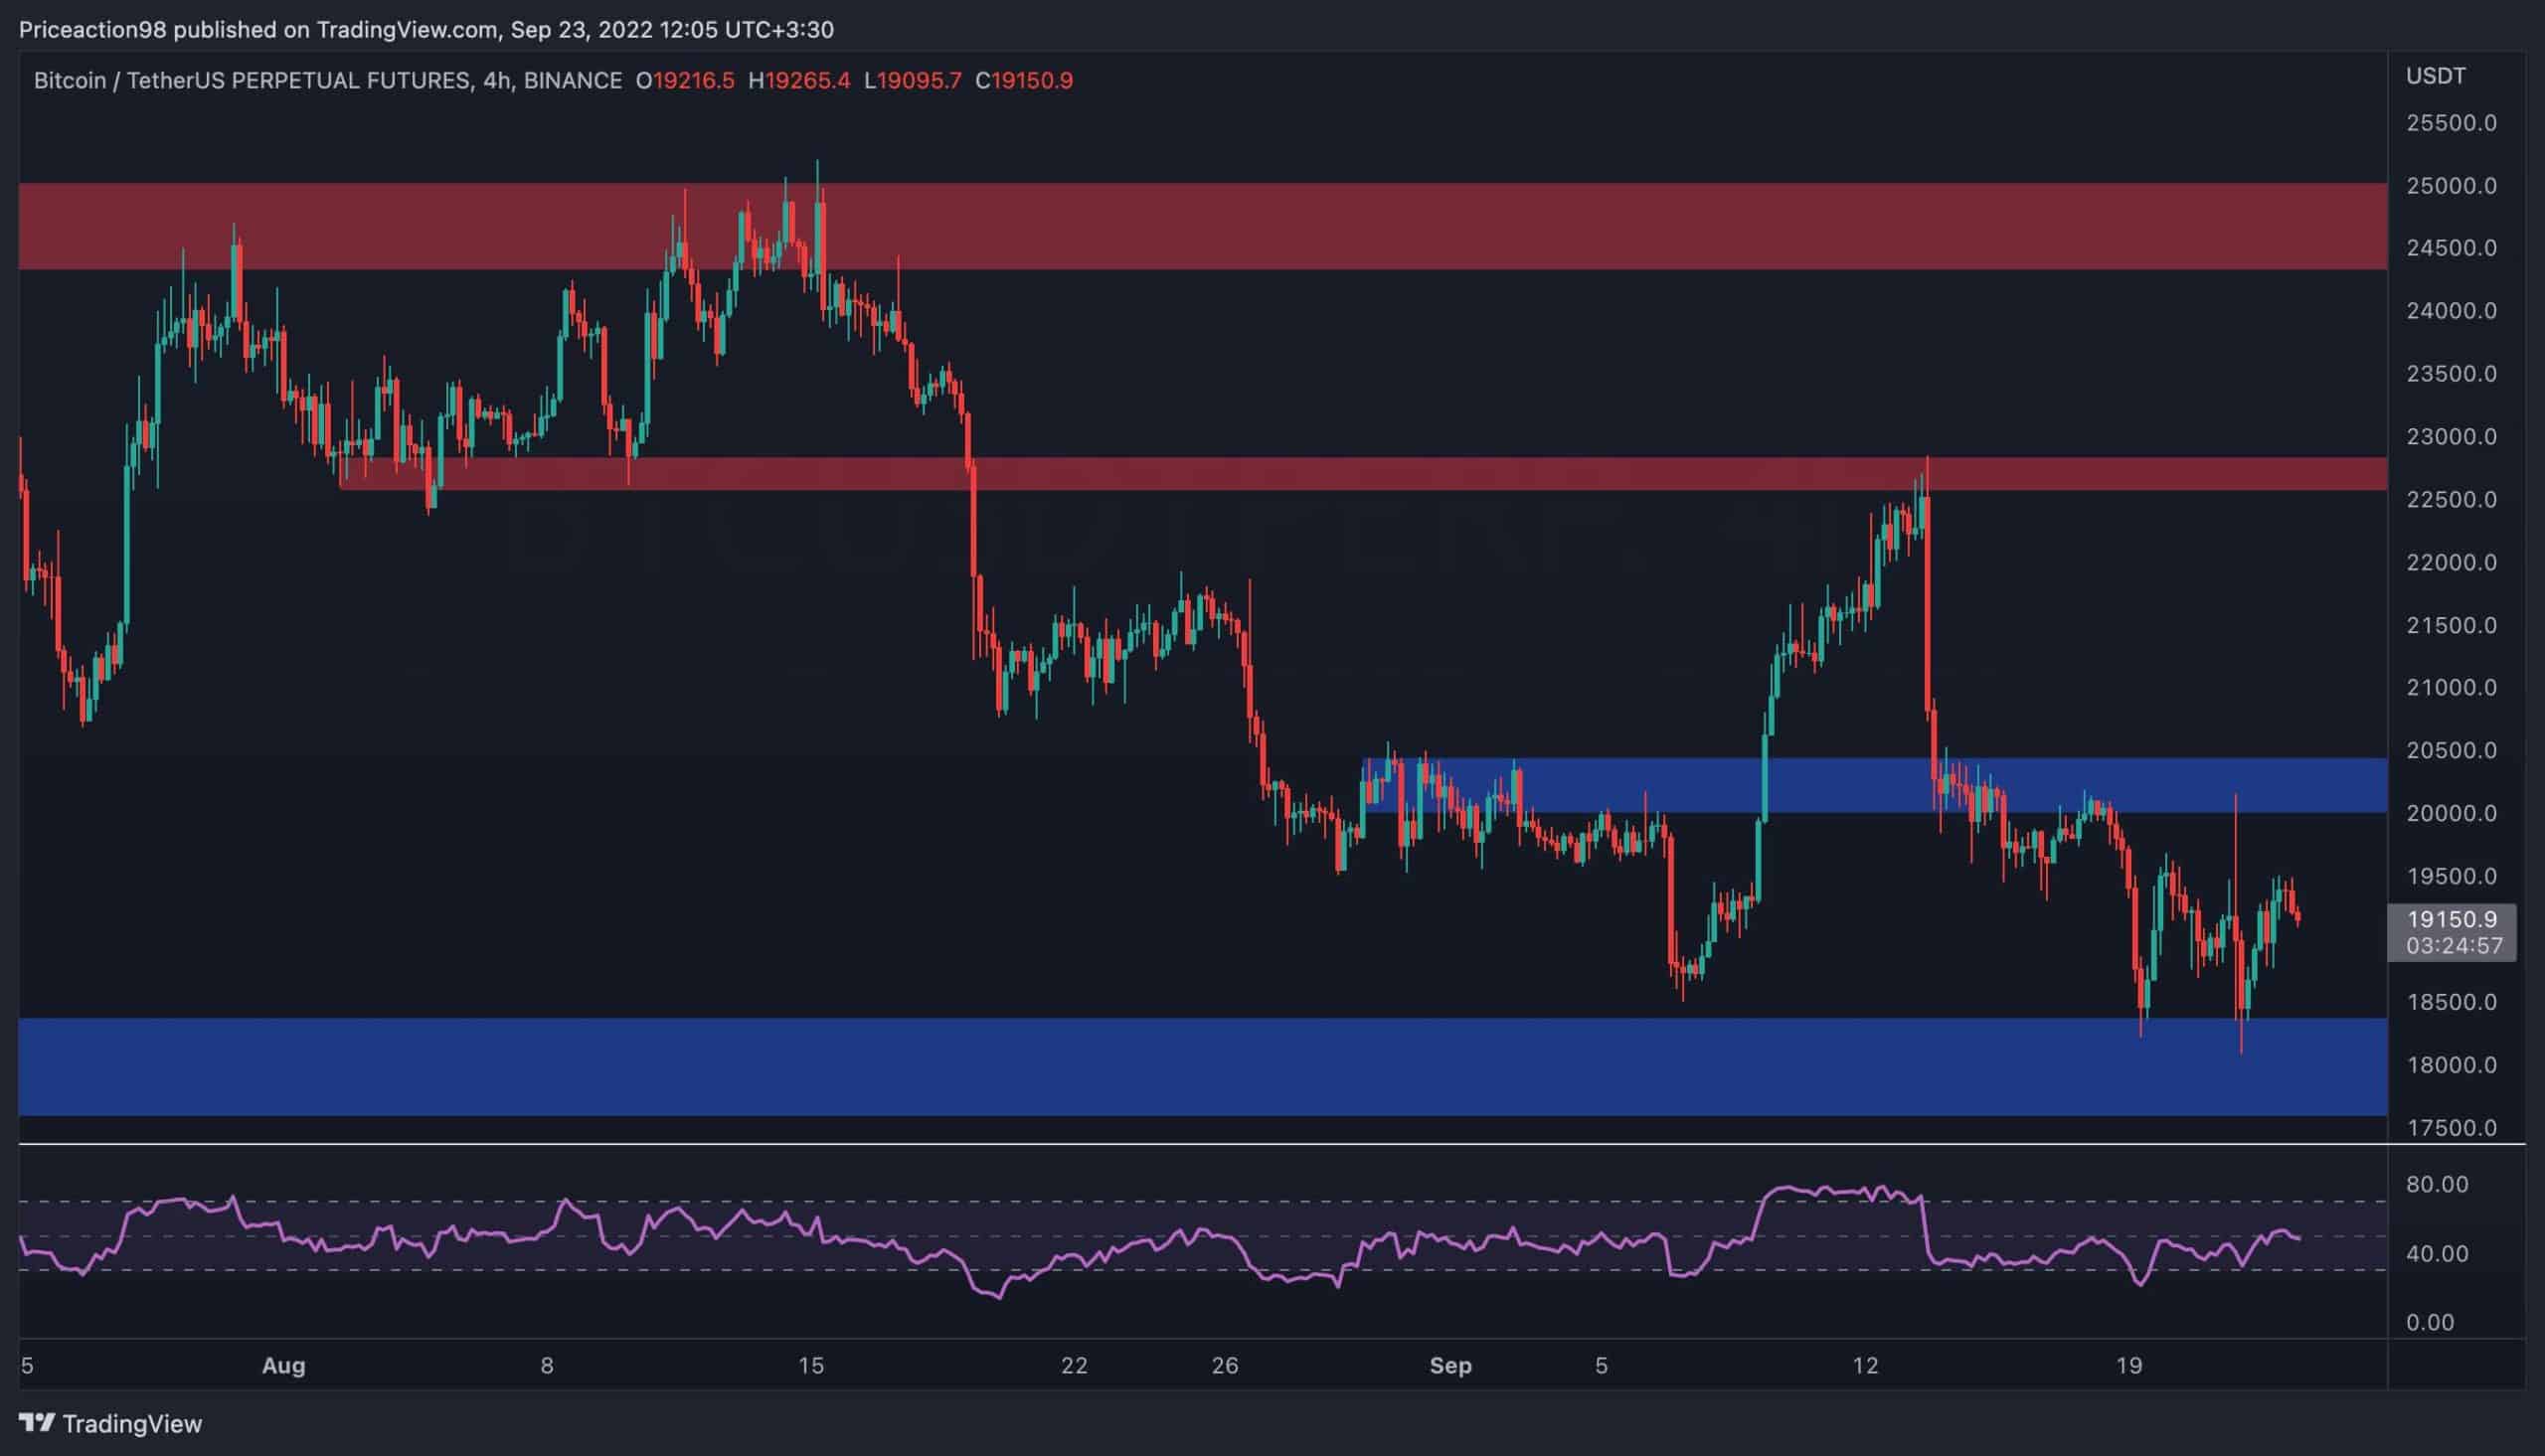
The price has been fluctuating in a tight range between $18K and $20K in the last few days, preparing for the next crucial move.
A double bottom pattern has been formed at the $18K level recently, which could push the price towards $20K once more. In the event of a bullish breakout, both $22,500 and $24K would be key resistance levels to watch in this timeframe.
The RSI indicator is also in a state of equilibrium, as recently, it has been oscillating around 50. The bulls and bears are currently struggling to take control, and the market could break out in either direction.
However, considering the higher timeframe bearish trend, a breakdown below $18K is still the more probable scenario.
Onchain Analysis
By Shayan
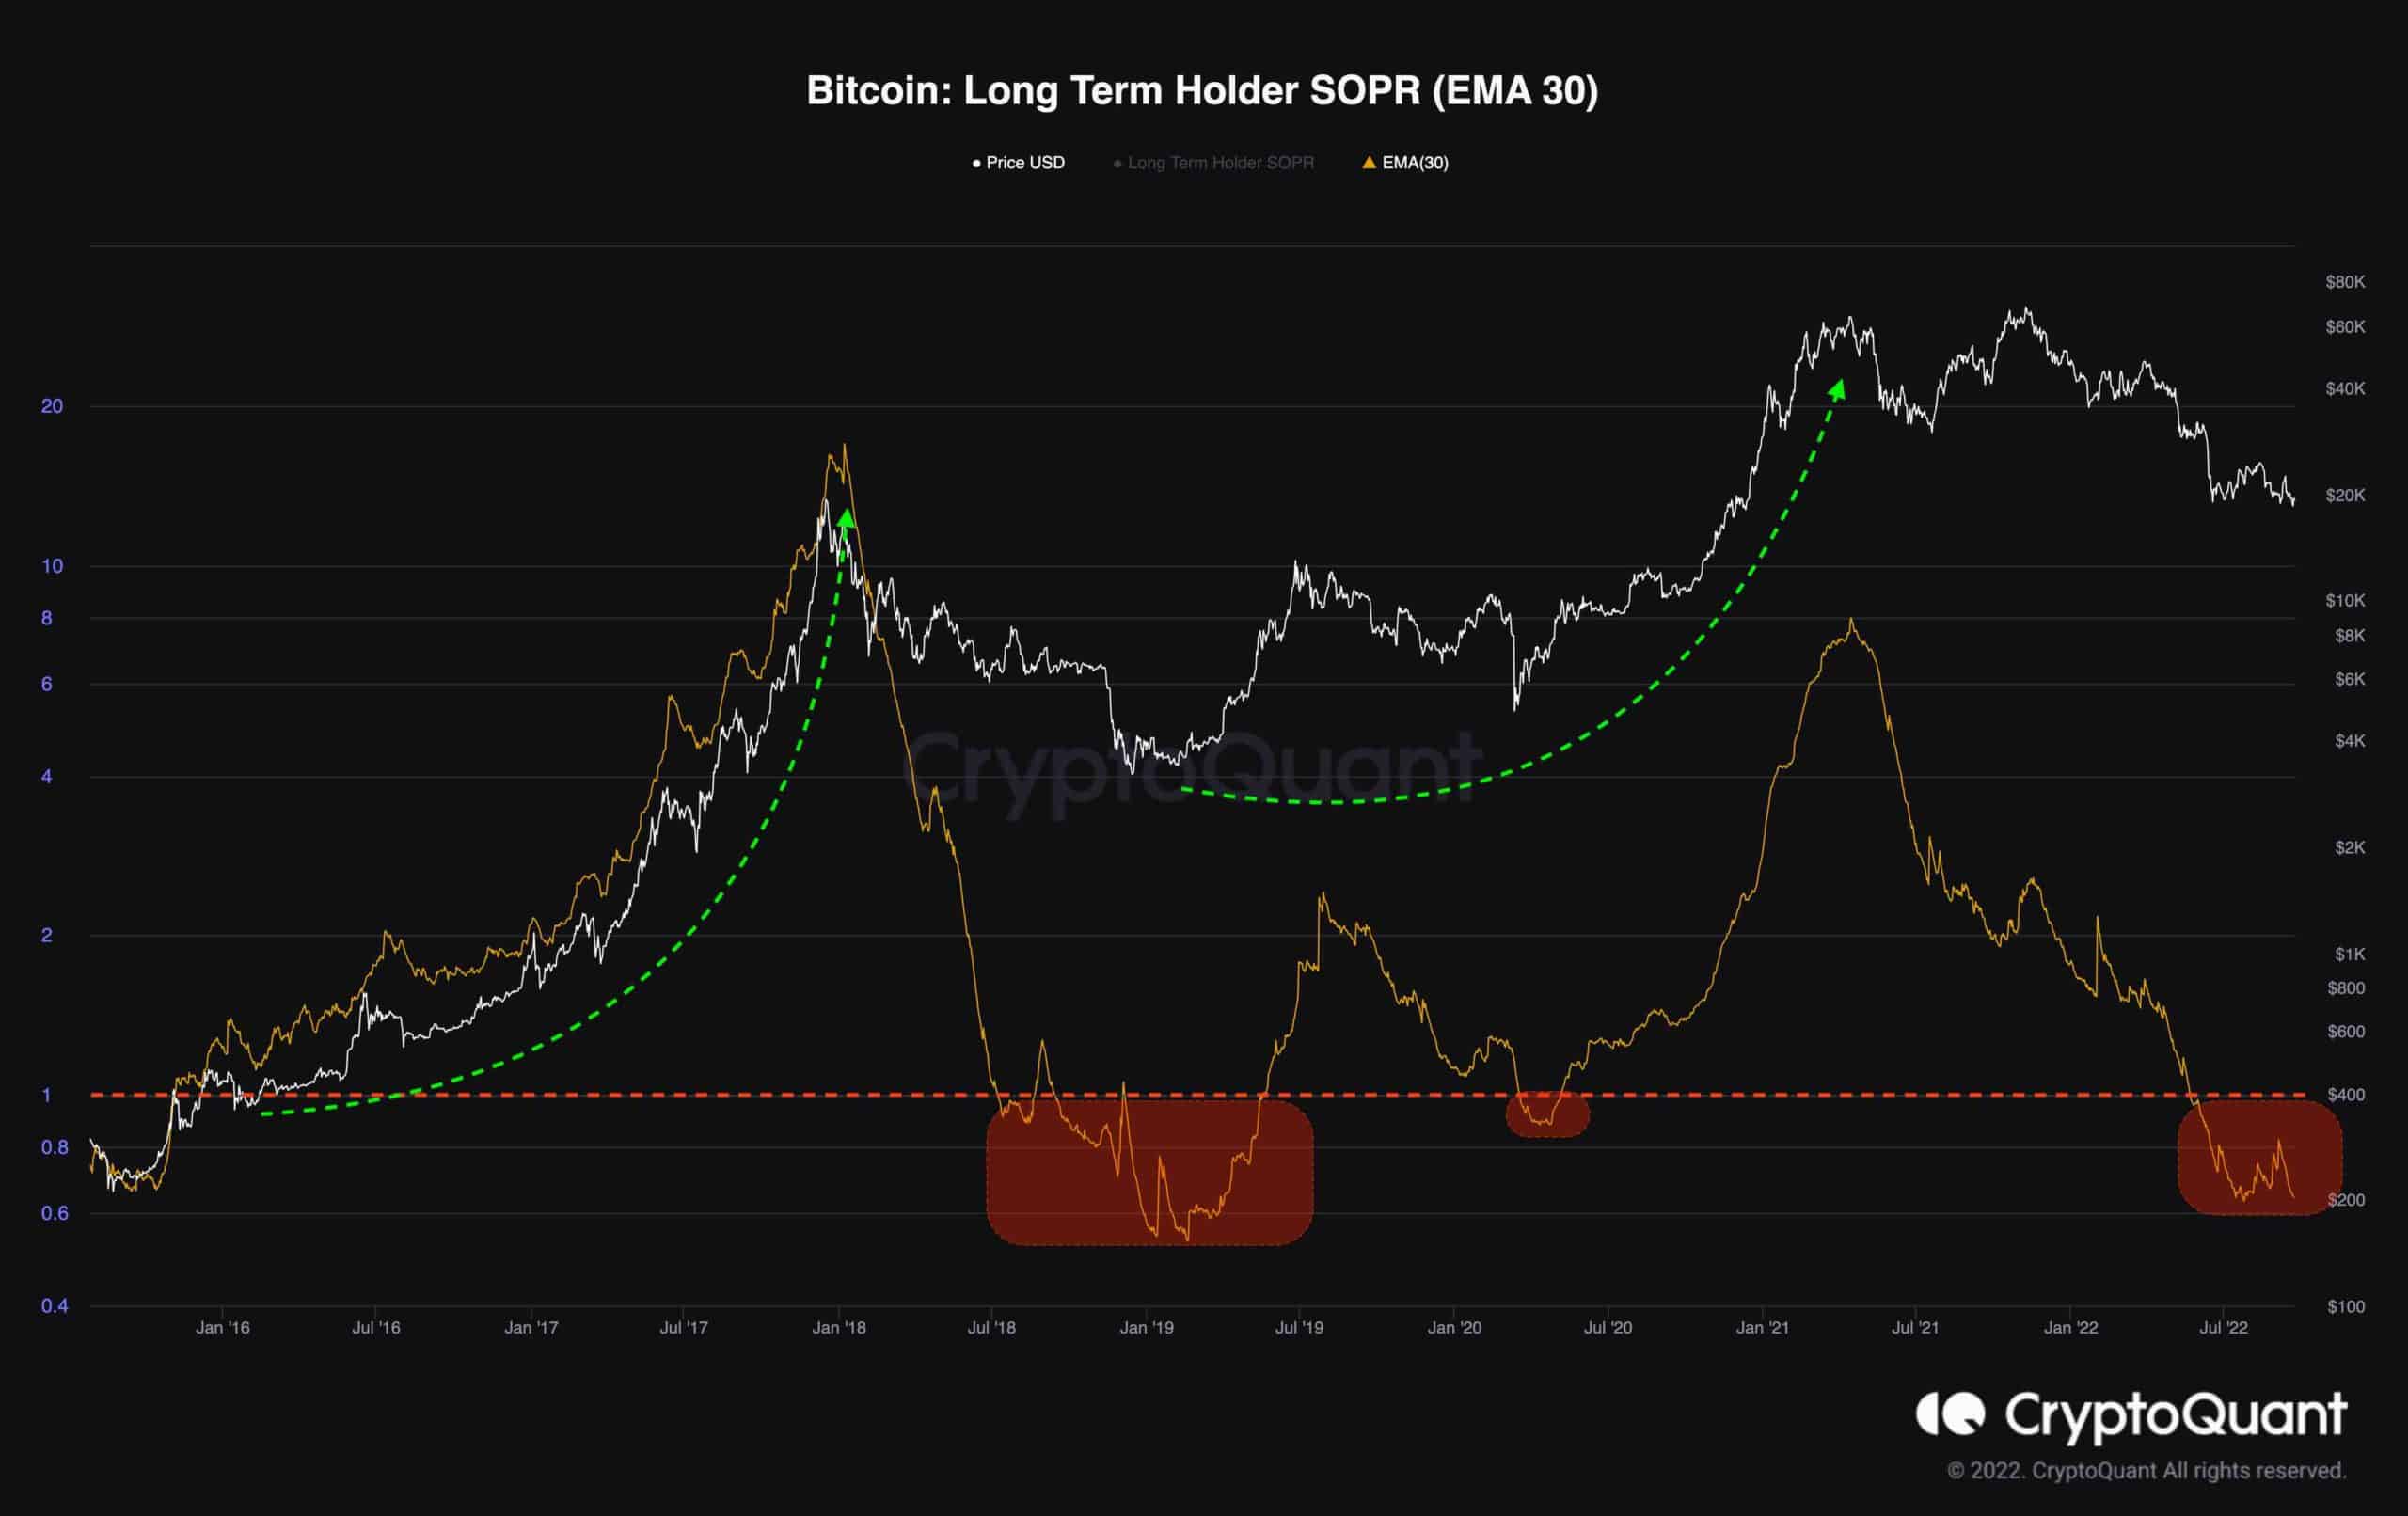
Markets typically tend to bottom out when players experience substantial losses, referred to as “Capitulation.” Since long-term investors control most of the supply, the Bitcoin market emphasizes their losses. A multi-year bottom cannot occur without a long-term holders’ capitulation phase.
The Long-Term Holder SOPR’s 30-day exponential moving average and the BTC price are displayed on the chart below. It becomes evident that long-term holders capitulated over an extended period during previous bear markets.
The indicator has dropped below 1, a signal that long-term investors are under pressure to distribute. This has frequently initiated the final phase of the bear market.
However, it should be understood that this phase may require several months of volatility, followed by numerous significant shakeouts.
The post BTC Price Analysis: Bitcoin Trading Flat but is a Drop Below $18K Imminent? appeared first on CryptoPotato.


