BTC Price Analysis: After Crashing $2K, Will Bitcoin’s Recent Recovery Hold?
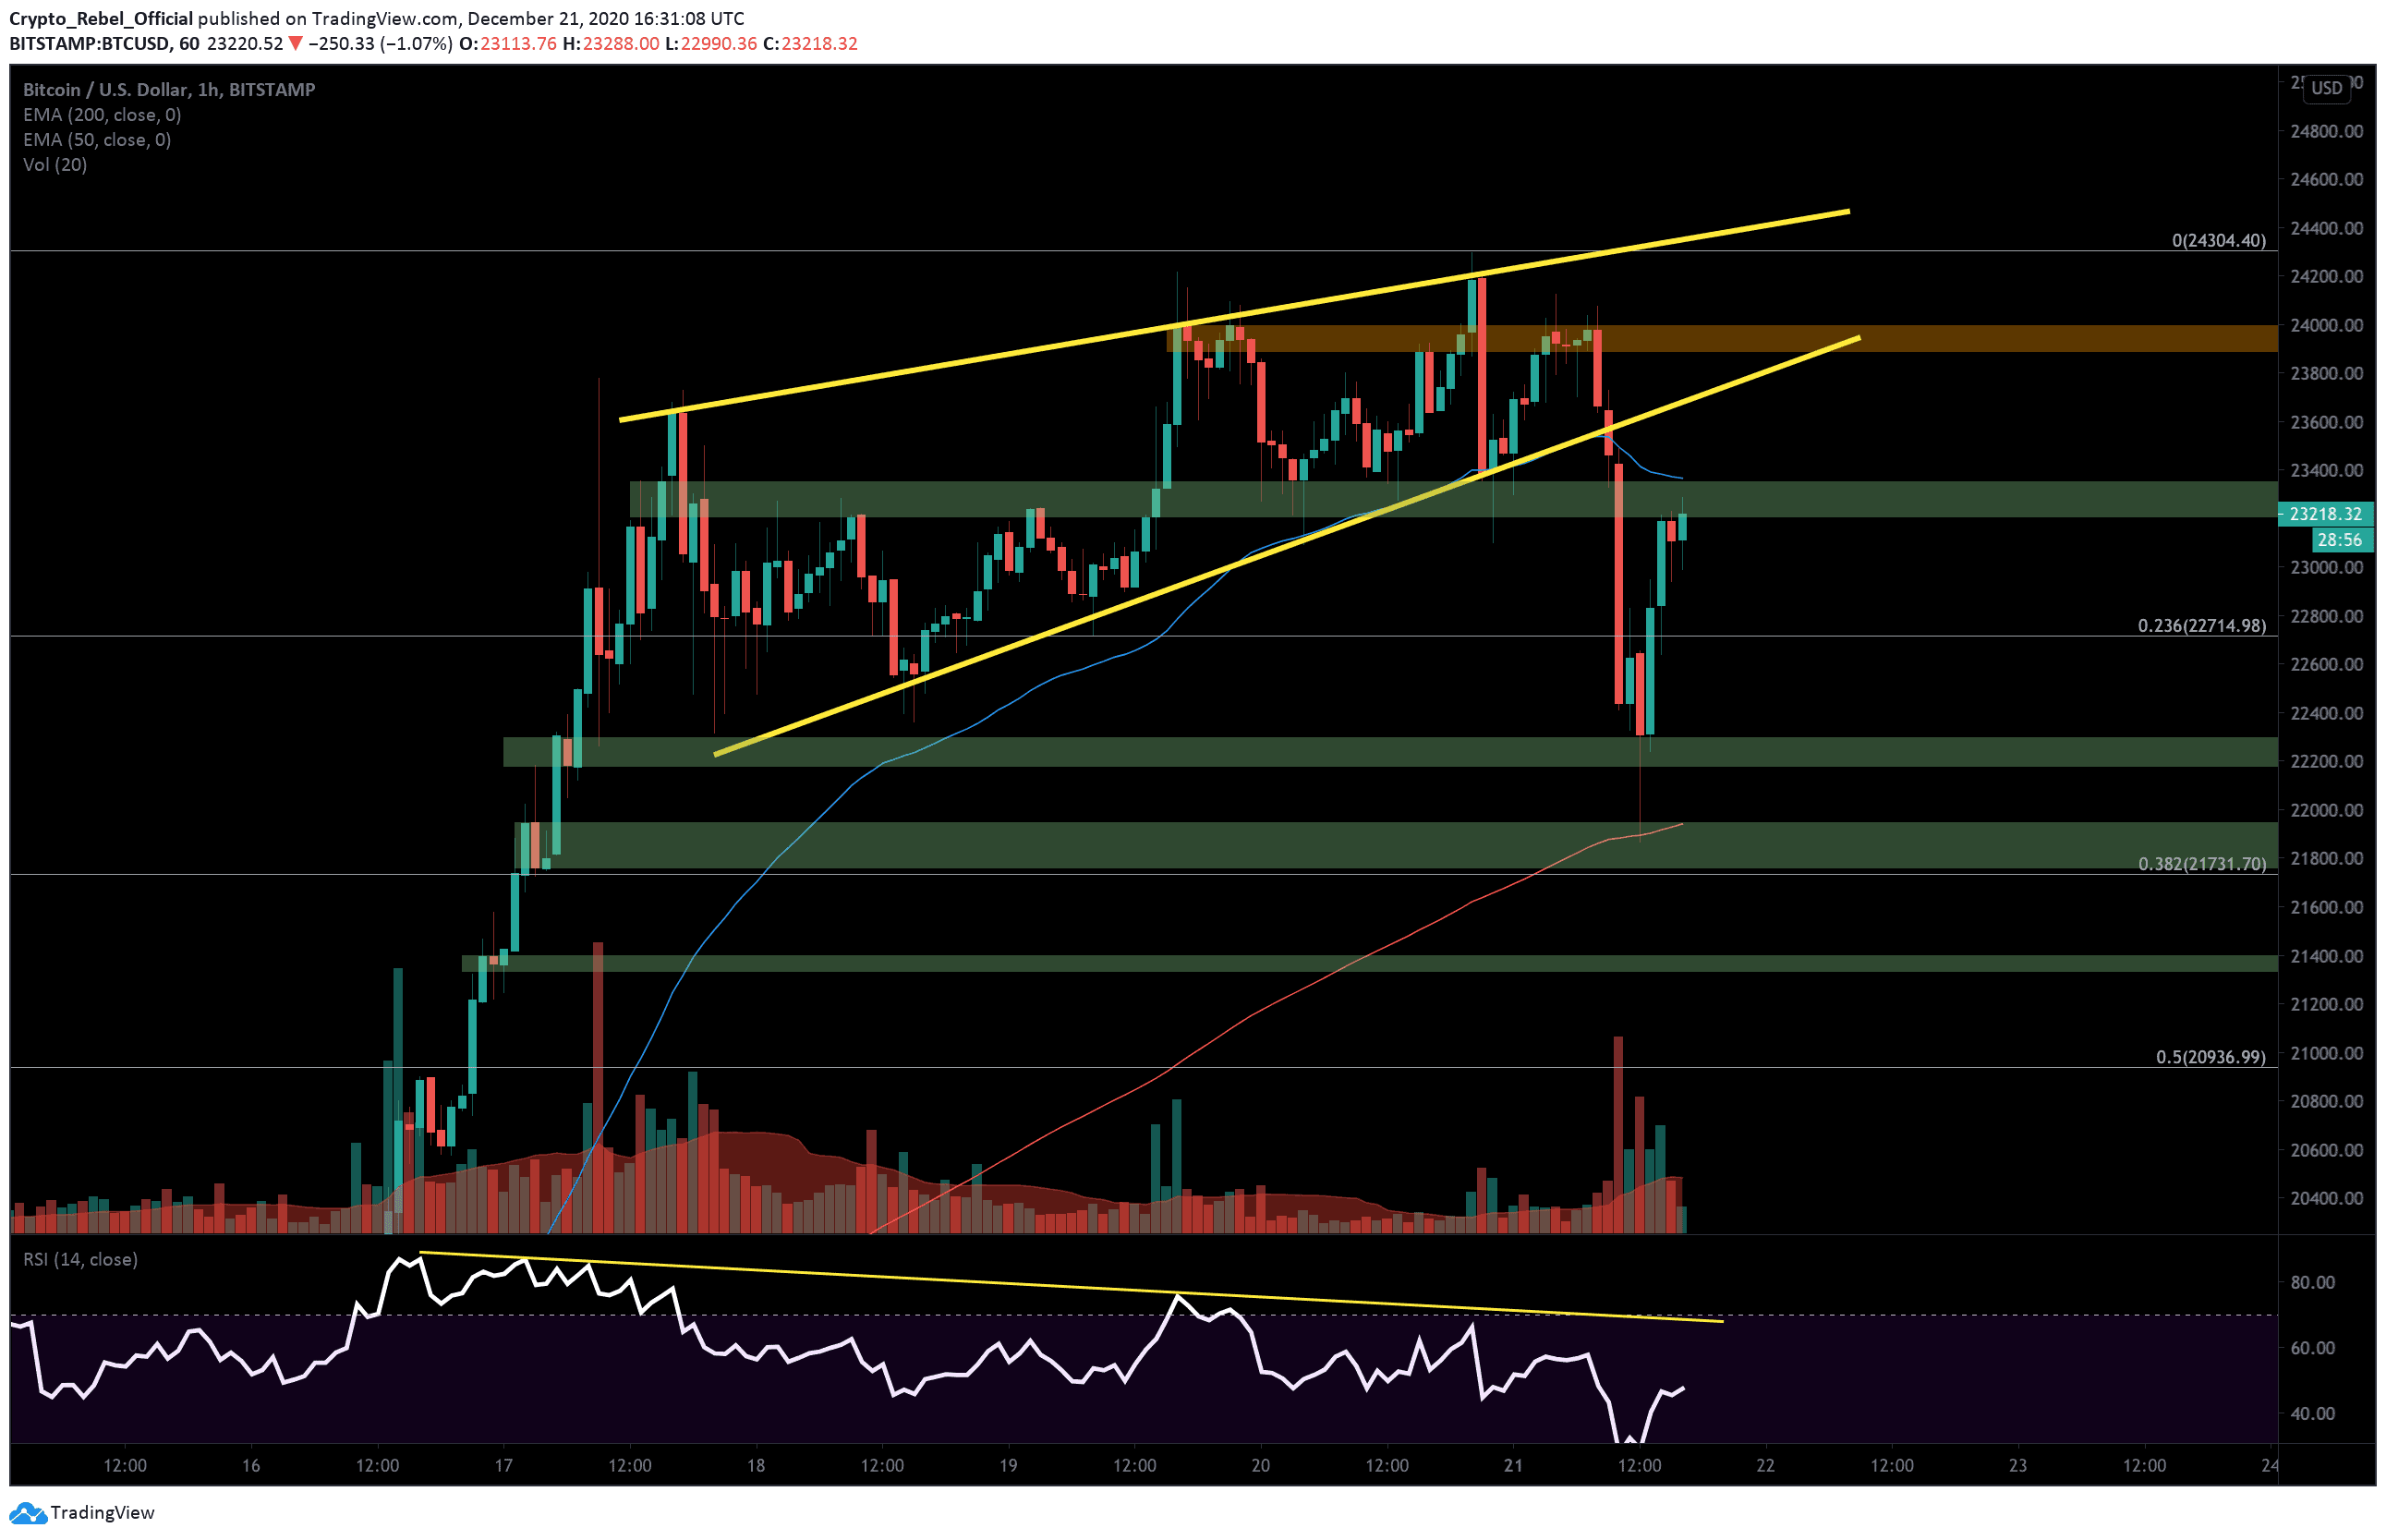
Bitcoin price has finally started to correct from its parabolic rally to new all-time highs. During the European trading session today, we saw the first hourly candle close beneath the support of the bearish rising wedge pattern (yellow lines), around 09:00 UTC.
Rising wedges are classic bearish reversal patterns and typically result in strong corrections. This morning’s breakout signaled to the rest of the market that BTC was about to dive sharply and within minutes of the new candle starting, the bitcoin price tumbled over $980. The strong RSI divergence on Bitcoin’s chart (yellow line on RSI) was also a strong indication that the previous uptrend was weakening and that a correction was on the cards soon.
$47 billion was wiped out during the peak of the reversal, according to Coinmarketcap data, which bottomed out at $21,874 before breaking back over $23,000.
Price Levels to Watch in the Short-term
On the hourly BTC/USD chart, we can see that the 200-EMA (red) provided the strong support BTC needed to push back against the initial downtrend. Since then, bulls have managed to stage a recovery right the way back towards the 50-EMA (blue), which is now acting as an intraday resistance.
This point also overlaps with the top resistance of a key S/R area (top green bar) which, up until today, had helped prop up Bitcoin’s price over yesterday’s trading session. We should now expect BTC to throwback from this area and continue downward – unless of course, significant buying momentum arrives during the Asian trading session later today.
Looking below, we will look to the following areas to provide rebounding opportunities for bullish traders over the rest of this week;
(1) $22,700 – 0.236 Fibonacci level and key S/R level.
(2) $22,300 – Order block support zone (second green bar from top).
(3) $21,950 – 200 EMA line (red).
(4) $21,730 – 0.382 Fibonacci level and bottom level of the next order block support zone.
If Bitcoin bulls can break back above the 50-EMA line in the short-term, however, then the former rising wedge support level and the red zone around the $24,000 area will be the major resistances to overcome.
Total market capital: $660 billion.
Bitcoin market capital: $430 billion.
Bitcoin dominance: 65.3%
*Data by Coingecko.
Bitstamp BTC/USD Hourly Chart


