BTC Price Analysis: After Breaking 2020 High, Is Bitcoin Eyeing $14K?
Bitcoin price has managed to avoid all 3 unfilled CME gaps this week and go on to break the $13,235 level for the first time since July 10, 2019 – 469 days ago.
The catalyst for the 11% surge was the breaking news from PayPal yesterday that the payments giant will soon facilitate BTC and other crypto-asset payments.
According to data from Datamish, the Paypal rally caused a $70.8M short squeeze on BitMEX as an eye-popping $31 billion returned to the crypto market during yesterday’s frenzy. This will have undoubtedly helped catapult prices beyond the milestone $12K and $13K levels as short traders buy back into BTC to cover losses.
Price Levels to Watch in the Short-Term
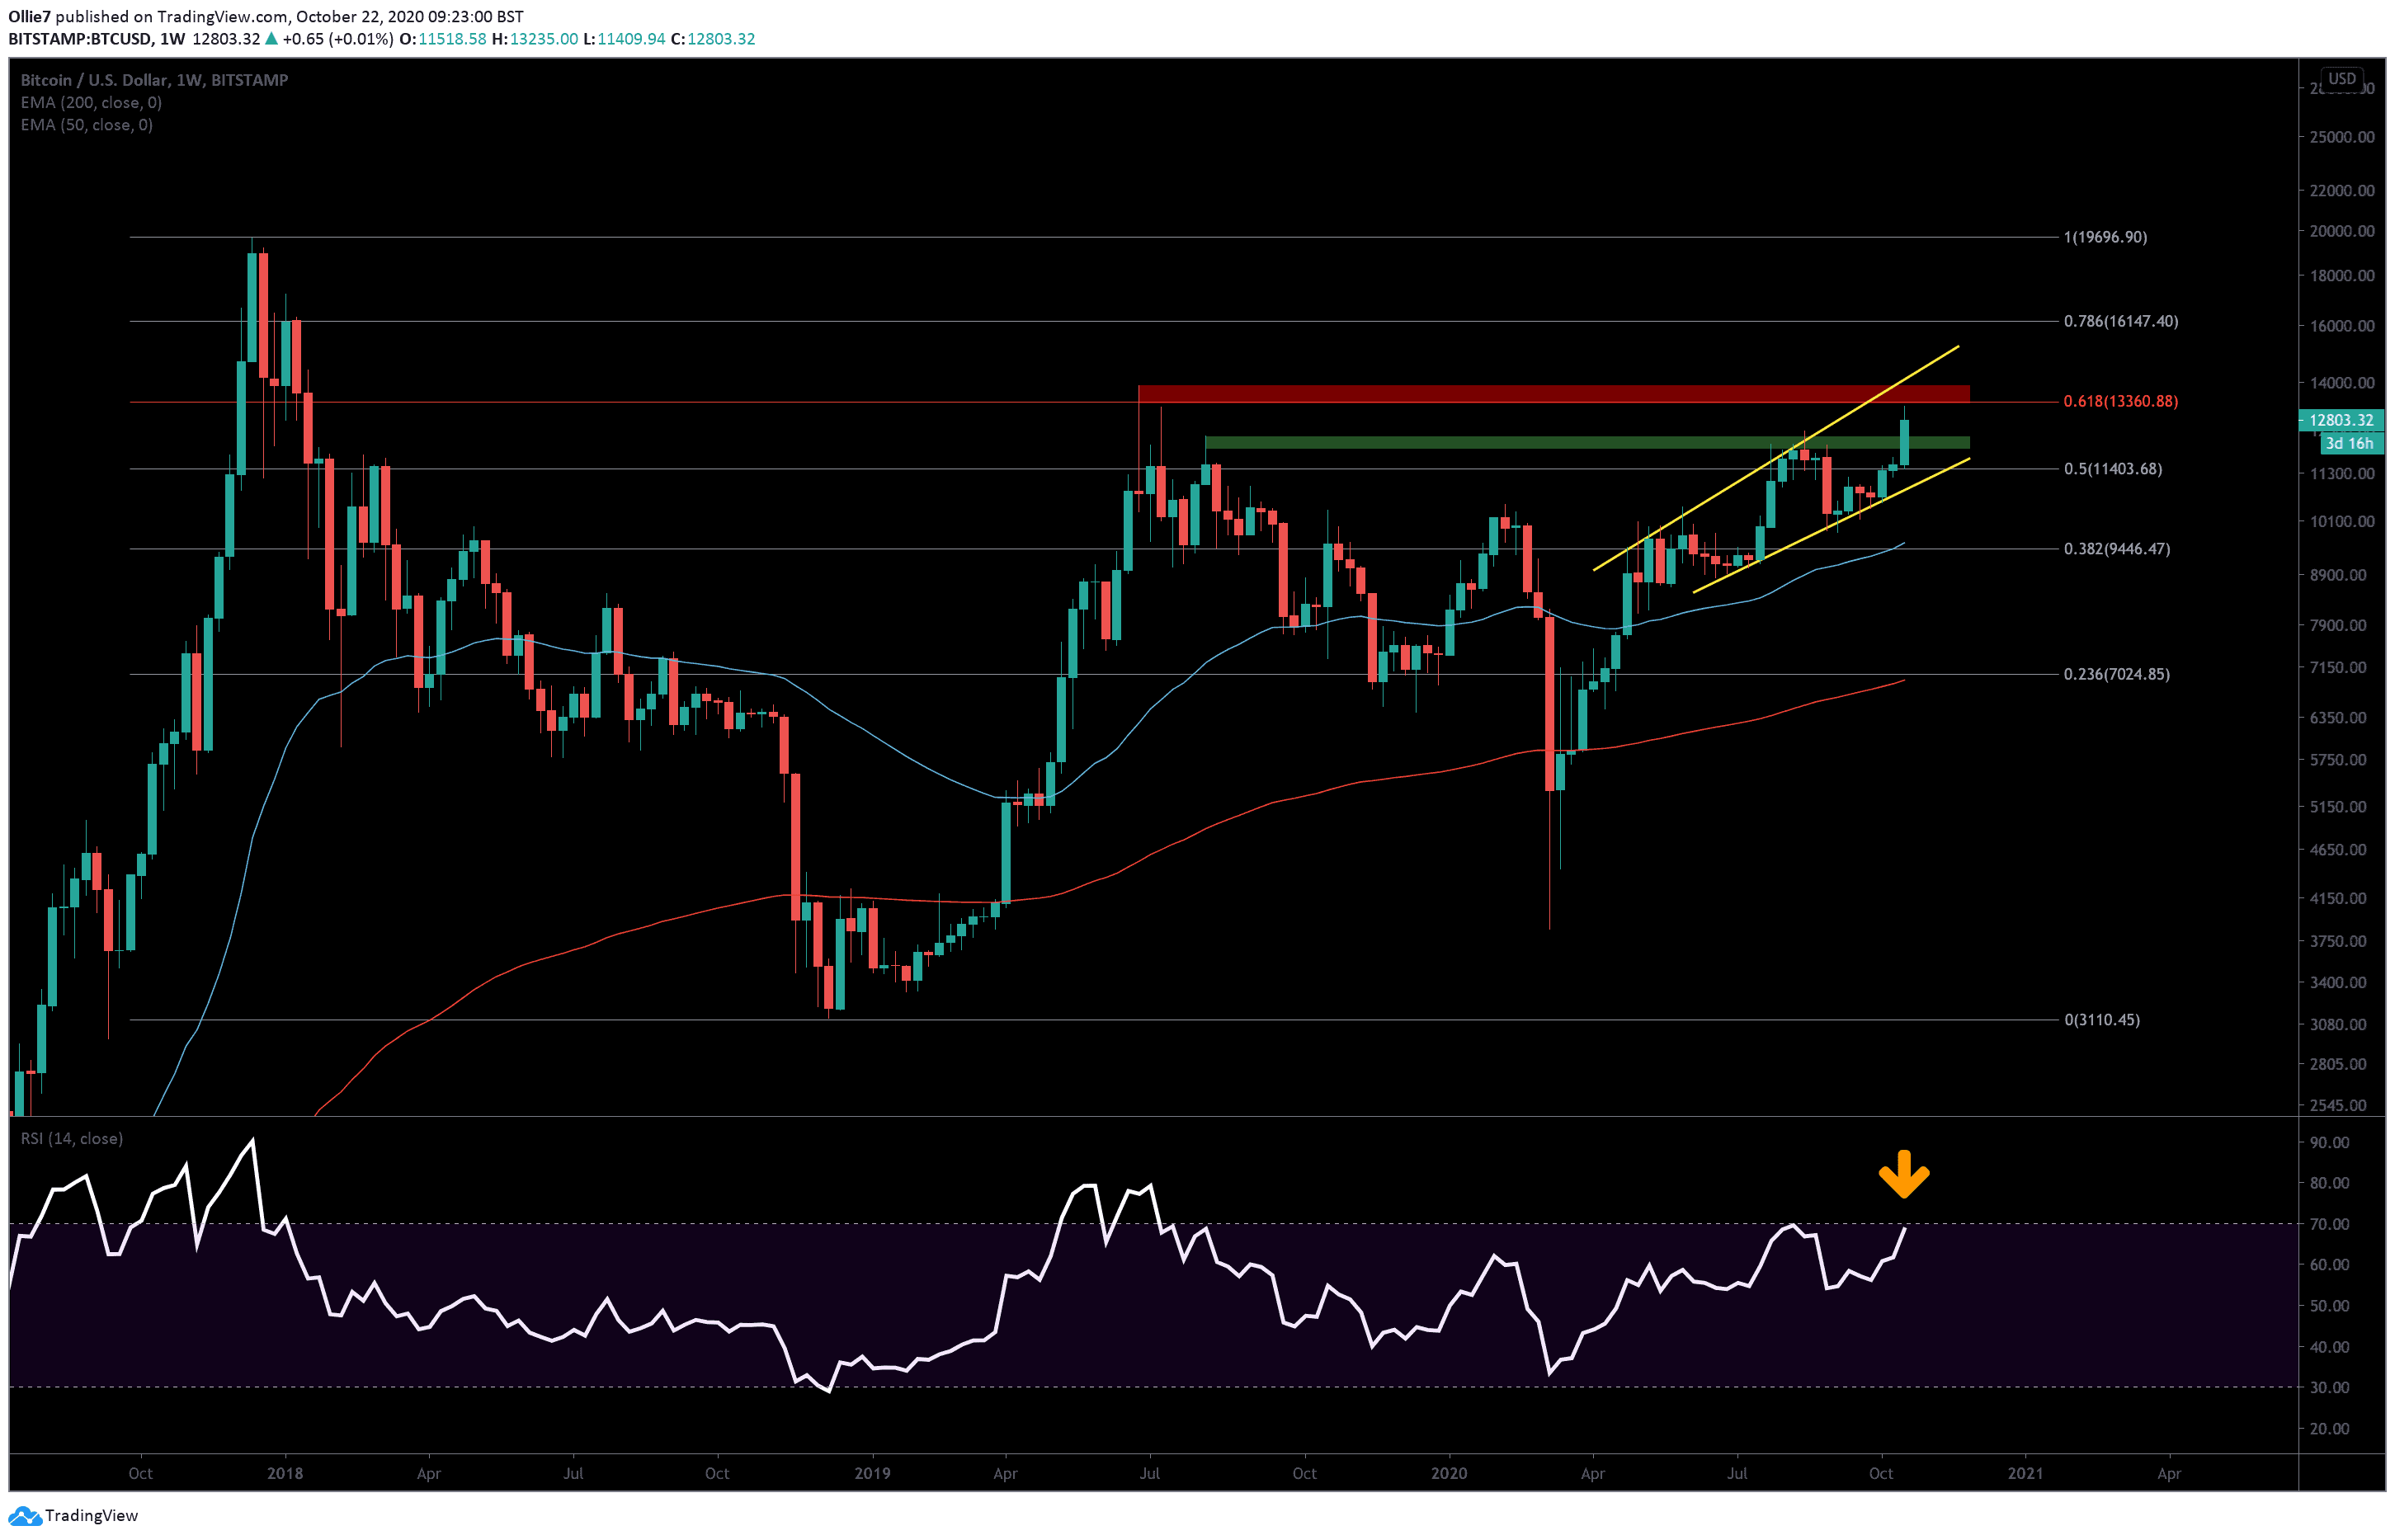
On the weekly BTC/USD chart, we can see that prices fell just shy of the 0.618 Fibonacci resistance at $13,360. Between this price point and the $13,890 level above, we have a major resistance zone (red shaded area) that has not been closed above since January 15, 2018 – during the huge crash from Bitcoin’s all-time high of $20,000.
This will be a massive psychological barrier for bullish traders to overcome, and will need considerable momentum to break it successfully.
Just above this area, we also have the upper resistance line of a broadening wedge pattern that bitcoin price has been tracking inside of since April 27, 2020, on the weekly chart (yellow lines). This currently sits around the $14,000 level. It’s possible that we could see a reaction at this trend line if prices managed to break through the aforementioned red zone.
From there, the most obvious daily resistances above this are the $14,600, $15,400, and $15,800 levels, before we get to the 0.786 Fibonacci level at $16,150.
Looking at potential supports, we have a key S/R zone (green shaded area) between $11,950 and $12,300, which should create some buying pressure to push back against a bearish decline.
Underneath that, we have the 0.5 Fibonacci level at $11,400, the daily 50 EMA (blue) at approx $11,170, and the support line of the broadening wedge pattern at around the $10,900 area.
With Bitcoin now dangerously close to breaking into the overbought region on the weekly RSI for the first time since July 2019, it’s possible that we could see a sharp decline as trading bots are triggered by the indicator before a new leg of the uptrend begins.
Total market capital: $395 billion
Bitcoin market capital: $ 237 billion
Bitcoin dominance: 60.1%
*Data by Coingecko.
Bitstamp BTC/USD Weekly Chart
The post BTC Price Analysis: After Breaking 2020 High, Is Bitcoin Eyeing $14K? appeared first on CryptoPotato.